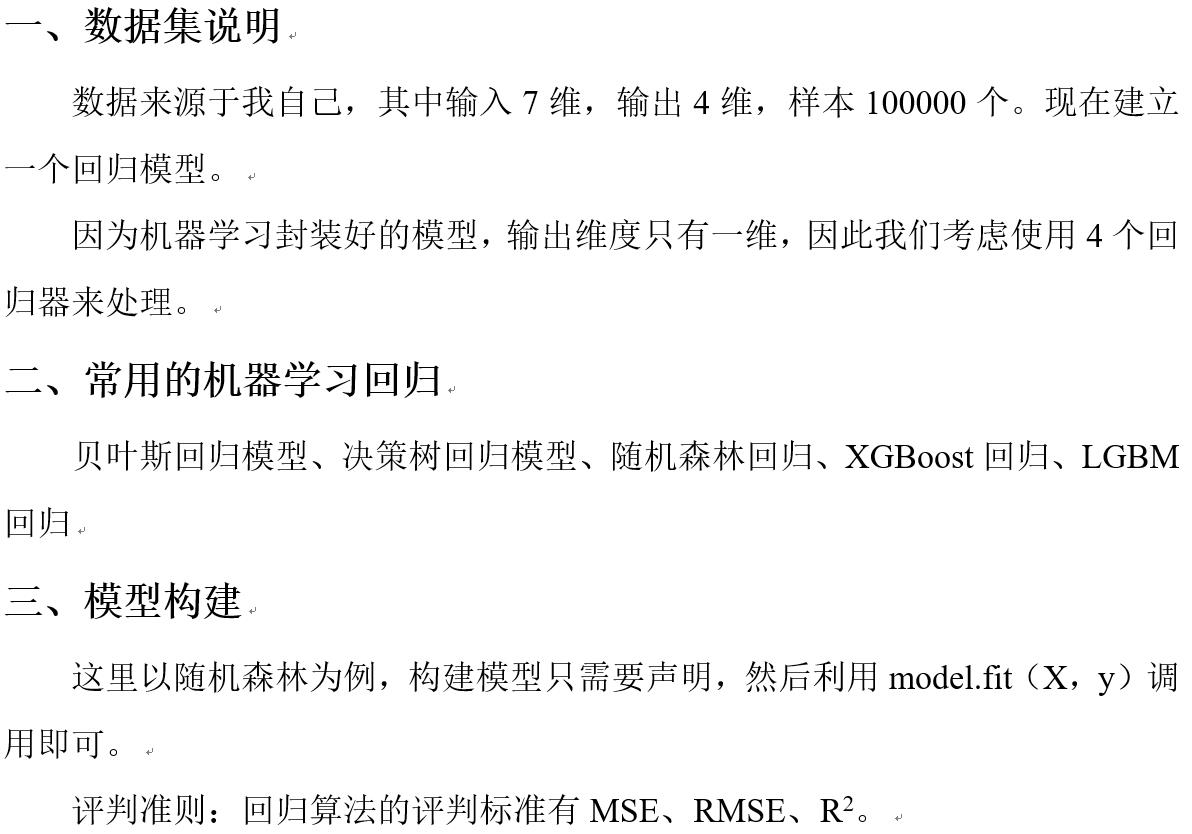
如何基于Python-sklearn搭建一个机器学习模型,保存与调用该模型,有哪些机器学习回归算法
Posted 小乖乖的臭坏坏
tags:
篇首语:本文由小常识网(cha138.com)小编为大家整理,主要介绍了如何基于Python-sklearn搭建一个机器学习模型,保存与调用该模型,有哪些机器学习回归算法相关的知识,希望对你有一定的参考价值。

RandomForestRegressor1 = RandomForestRegressor()
RandomForestRegressor1.fit(X, y1)
MSE1 = sklearn.metrics.mean_squared_error(y1, RandomForestRegressor1.predict(X))
r2_score1 = sklearn.metrics.r2_score(RandomForestRegressor1.predict(X), y1)
print("RandomForestRegressor MSE1", MSE1)
print("RandomForestRegressor r2_score1", r2_score1)

joblib.dump(RandomForestRegressor1, 'RandomForestRegressor1.pkl')

RandomForestRegressor1 = joblib.load('RandomForestRegressor1.pkl')


from xgboost import XGBRegressor
import xgboost
import pandas as pd
from sklearn.metrics import mean_squared_error, r2_score
import joblib
import matplotlib.pyplot as plt
import numpy as np

# csv_data = pd.read_csv('multiple_train.csv',header=None, index_col=None)
csv_data = pd.read_csv('add_test.csv', header=None, index_col=None)
datas = csv_data.values
X = datas[:, 4:(4+7)]
# y = datas[:, :4]
y = datas[:, (4+7+4):(4+7+4+4)]
y1 = y[:, 0]
y2 = y[:, 1]
y3 = y[:, 2]
y4 = y[:, 3]

#模型定义
RandomForestRegressor1 = joblib.load('RandomForestRegressor1.pkl')
RandomForestRegressor2 = joblib.load('RandomForestRegressor2.pkl')
RandomForestRegressor3 = joblib.load('RandomForestRegressor3.pkl')
RandomForestRegressor4 = joblib.load('RandomForestRegressor4.pkl')

y1_hat = RandomForestRegressor1.predict(X)
y2_hat = RandomForestRegressor2.predict(X)
y3_hat = RandomForestRegressor3.predict(X)
y4_hat = RandomForestRegressor4.predict(X)

y_hat = np.concatenate([y1_hat[:,np.newaxis],y2_hat[:,np.newaxis],y3_hat[:,np.newaxis],y4_hat[:,np.newaxis]], axis=1)

mse1 = mean_squared_error(y1,y1_hat)
mse2 = mean_squared_error(y2,y2_hat)
mse3 = mean_squared_error(y3,y3_hat)
mse4 = mean_squared_error(y4,y4_hat)
r2_score1 = r2_score(y1,y1_hat)
r2_score2 = r2_score(y2,y2_hat)
r2_score3 = r2_score(y3,y3_hat)
r2_score4 = r2_score(y4,y4_hat)
print('RandomForestRegressor mse1:', mse1)
print('RandomForestRegressor mse2:', mse2)
print('RandomForestRegressor mse3:', mse3)
print('RandomForestRegressor mse4:', mse4)
print('RandomForestRegressor r2_score1:', r2_score1)
print('RandomForestRegressor r2_score2:', r2_score2)
print('RandomForestRegressor r2_score3:', r2_score3)
print('RandomForestRegressor r2_score4:', r2_score4)

for i in range(4):
    plt.figure('multiple test {} : ua and ua_hat'.format(i+1),dpi=500)
    plt.subplot(4,1,1)
    plt.plot(y1[100*i:100*(i+1)], color='r', linewidth=0.6)
    plt.plot(y1_hat[100*i:100*(i+1)], color='b', linewidth=0.6)
    plt.legend(['ua1','ua1_hat'])
    plt.grid(True)
    plt.title('ua1')

    plt.subplot(4,1,2)
    plt.plot(y2[100*i:100*(i+1)], color='r', linewidth=0.6)
    plt.plot(y2_hat[100*i:100*(i+1)], color='b', linewidth=0.6)
    plt.legend(['ua2','ua2_hat'])
    plt.grid(True)
    plt.title('ua2')

    plt.subplot(4,1,3)
    plt.plot(y3[100*i:100*(i+1)], color='r', linewidth=0.6)
    plt.plot(y3_hat[100*i:100*(i+1)], color='b', linewidth=0.6)
    plt.legend(['ua3','ua3_hat'])
    plt.grid(True)
    plt.title('ua3')

    plt.subplot(4,1,4)
    plt.plot(y4[100*i:100*(i+1)], color='r', linewidth=0.6)
    plt.plot(y4_hat[100*i:100*(i+1)], color='b', linewidth=0.6)
    plt.legend(['ua4','ua4_hat'])
    plt.grid(True)
    plt.title('ua4')

    plt.savefig('multiple test {} ua and ua_hat.png'.format(i+1))
    plt.savefig('multiple test {} ua and ua_hat.svg'.format(i+1))


names = ['ua1','ua2','ua3','ua4']

y_hat = pd.DataFrame(y_hat,columns=names)
y_hat.to_csv('RandomForestRegressor_predict_add.csv')
作于:
2021-5-31
22:45
以上是关于如何基于Python-sklearn搭建一个机器学习模型,保存与调用该模型,有哪些机器学习回归算法的主要内容,如果未能解决你的问题,请参考以下文章