echarts实现环形进度条
Posted Steven Jon
tags:
篇首语:本文由小常识网(cha138.com)小编为大家整理,主要介绍了echarts实现环形进度条相关的知识,希望对你有一定的参考价值。
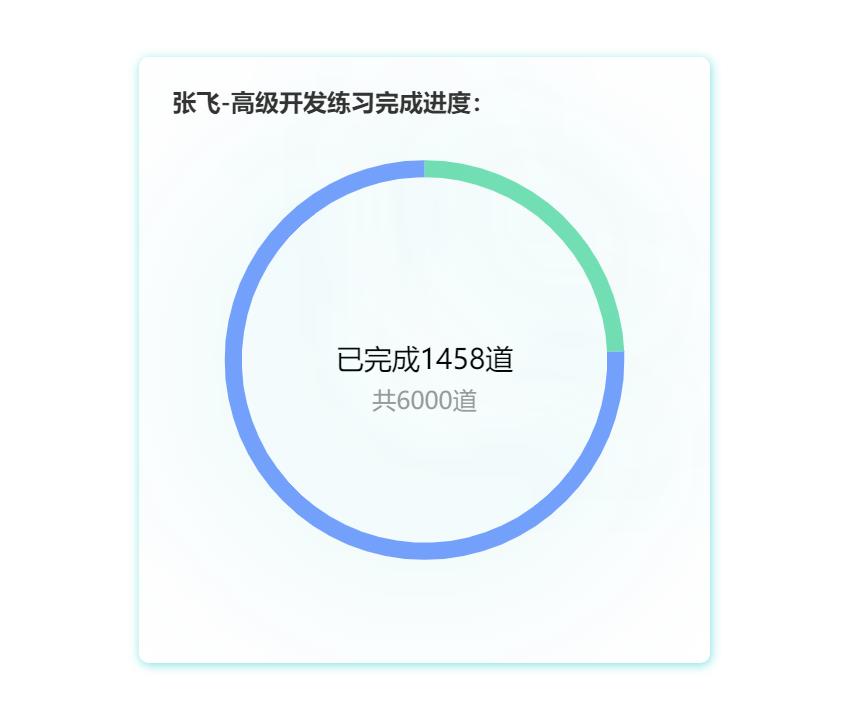
效果图

实现代码
可直接复制运行:
<!DOCTYPE html>
<html>
	<head>
		<meta charset="UTF-8">
		<title>环形进度条</title>
		<script src="https://cdn.staticfile.org/echarts/4.3.0/echarts.min.js"></script>
		<style type="text/css">
			.center {
				position: absolute;
				width: 50%;
				height: 80%;
				box-shadow: 1px 2px 10px 0 rgba(0, 196, 196, 0.5);
				border-radius: 10px;
				left: 0;
				top: 0;
				bottom: 0;
				right: 0;
				margin: auto;
			}
		</style>
	</head>
	<body>
		<div id = "content" class = "center"></div>
		<script type="text/javascript">
			var value = 1458;//当前进度
			var maxValue = 6000;//进度条最大值
			var pipe = echarts.init(document.getElementById('content'));
			var option = {
				title: {
					//标题内容
					text: '张飞-高级开发练习完成进度:',
					textStyle: {
						fontWeight: 'bold',
						fontFamily: 'Microsoft YaHei',
						fontSize: 24
					},
					//标题位置
					top: '5%',
					left: '5%'
				},
				//环形中间文字
				graphic: [
					//第一行文字
					//内容 + 位置
					{
						type: 'text',
						left: 'center',
						top: '48%',
						style: {
							//value当前进度
							text: '已完成' + value + '道',
							textAlign: 'center',
							fill: '#000',
							fontSize: 28
						}
					},
					//第二行文字
					//内容 + 位置
					{
						type: 'text',
						left: 'center',
						top: '55%',
						style: {
							//maxValue进度条最大值
							text: '共' + maxValue + '道',
							textAlign: 'center',
							fill: '#999',
							fontSize: 24
						}
					}
				],
				series: [{
					type: 'pie',
					radius: ['70%', '64%'],//['外圆大小', '内圆大小']
					center: ['50%', '50%'],//圆心位置['左右', '上下']
					hoverAnimation: false,//取消鼠标悬停动画
					animationEasing: 'cubicOut',//设置动画缓动效果
					//取消显示饼图自带数据线条
					labelLine: {
						normal: {
							show: false
						}
					},
					//增加阴影效果
					itemStyle: {
						normal: {
							shadowBlur: 200,
							shadowColor: 'rgba(44, 196, 196, 0.8)'
						}
					},
					data: [
					    //value当前进度 + 颜色
					    {
					    	value: value,
					    	itemStyle: {
					    		normal: {
					    			color: '#73DEB3'
					    		}
					    	}
					    },
					    //(maxValue进度条最大值 - value当前进度) + 颜色
					    {
					    	value: maxValue - value,
					    	itemStyle: {
					    		normal: {
					    			color: '#73A0FA'
					    		}
					    	}
					    }
					]
				}]
			};
			pipe.setOption(option);
			//随着浏览器窗口大小改变而改变
			window.addEventListener("resize", function() {
				pipe.resize();
			});
		</script>
	</body>
</html>
以上是关于echarts实现环形进度条的主要内容,如果未能解决你的问题,请参考以下文章