Spring Boot 应用可视化监控,一目了然!
Posted Java技术栈
tags:
篇首语:本文由小常识网(cha138.com)小编为大家整理,主要介绍了Spring Boot 应用可视化监控,一目了然!相关的知识,希望对你有一定的参考价值。
点击关注公众号,Java干货及时送达
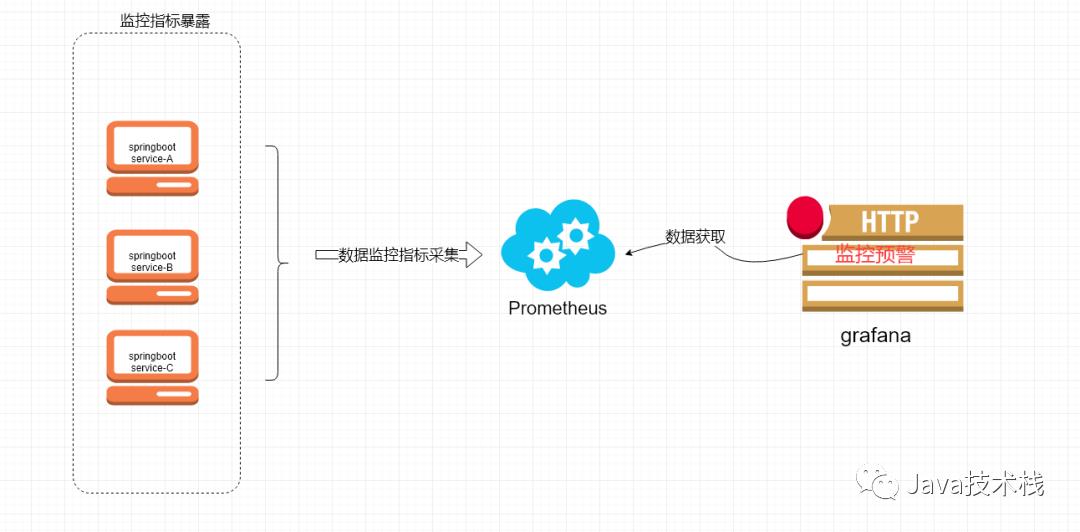
1、Spring Boot 应用暴露监控指标
首先,添加依赖如下依赖:
<dependency>
   <groupId>org.springframework.boot</groupId>
   <artifactId>spring-boot-starter-actuator</artifactId>
</dependency>
采集应用的指标信息,我们使用的是prometheus,相应的我们引入包:
<dependency>
   <groupId>io.prometheus</groupId>
   <artifactId>simpleclient_spring_boot</artifactId>
   <version>0.0.26</version>
</dependency>
然后,在启动类 Application.java 添加如下注解:
@SpringBootApplication
@EnablePrometheusEndpoint
@EnableSpringBootMetricsCollector
public class Application {
    public static void main(String[] args) {
     SpringApplication.run(Application.class, args);
    }
}
最后,配置默认的登录账号和密码,在 application.yml 中:
security:
  user:
    name:user
    password: pwd
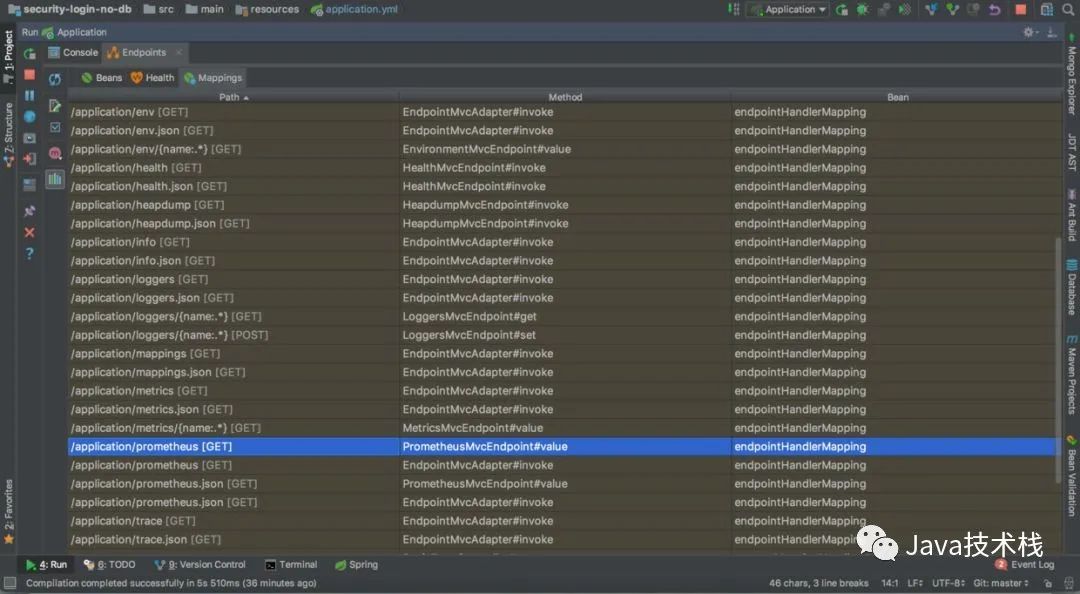
启动应用程序后,会看到如下一系列的 Mappings
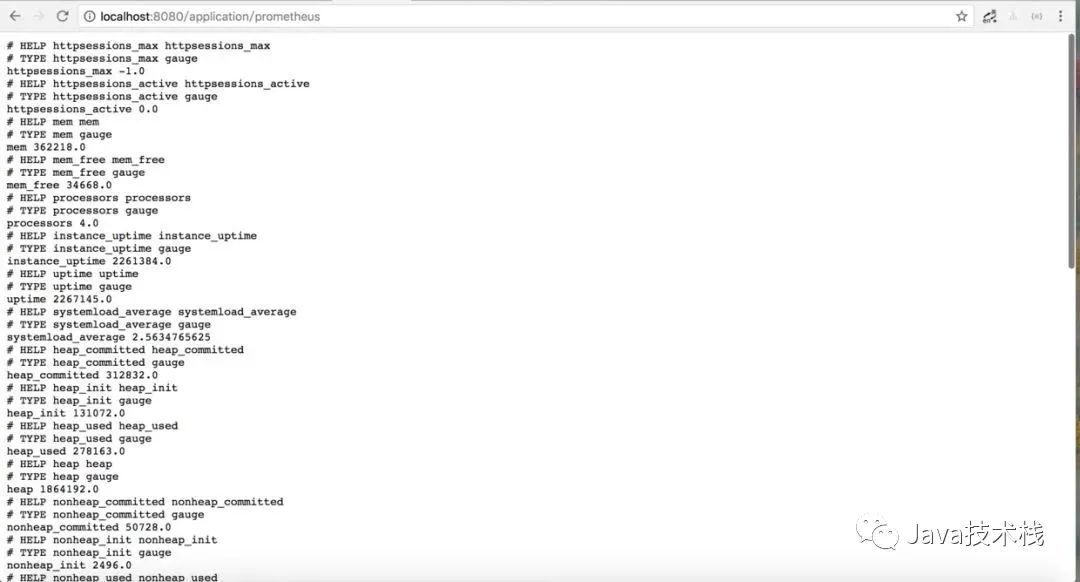
利用账号密码访问 http://localhost:8080/application/prometheus ,可以看到 Prometheus 格式的指标数据:Spring Boot 学习笔记,分享给你看下。
2、Prometheus 采集 Spring Boot 指标数据
首先,获取 Prometheus 的 Docker 镜像:
$ docker pull prom/prometheus
然后,编写配置文件 prometheus.yml :
global:
  scrape_interval: 10s
  scrape_timeout: 10s
  evaluation_interval: 10m
scrape_configs:
  - job_name: spring-boot
    scrape_interval: 5s
    scrape_timeout: 5s
    metrics_path: /application/prometheus
    scheme: http
    basic_auth:
      username: admin
      password: 123456
    static_configs:
      - targets:
        - 192.168.11.54:8099 #此处填写 Spring Boot 应用的 IP + 端口号
接着,启动 Prometheus :
docker run -d --name prometheus -p 9090:9090
-v D:\\test\\actuator\\prometheus\\prometheus.yml:/etc/prometheus/prometheus.yml prom/prometheus
D:\\test\\actuator\\prometheus\\prometheus.yml 是我的配置文件存放地址,我们需要将它放到容器里面去,所以用了-v来做文件映射。
/etc/prometheus/prometheus.yml这个是容器启动的时候去取的默认配置,这里我是直接覆盖掉了它。prom/prometheus这是镜像,如果本地没有,就回去你设置好的镜像仓库去取。
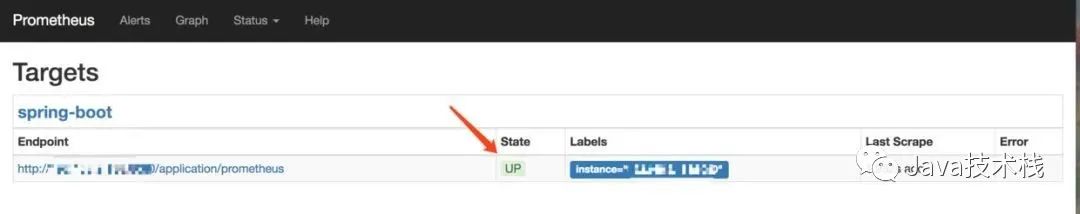
启动完成后用**docker ps**看下是否已经启动成功,之后打开浏览器输入:http://localhost:9090/targets,检查 Spring Boot 采集状态是否正常,如果看到下图就是成功了。
Spring Boot 基础就不介绍了,最新的教程和示例源码看这个:https://github.com/javastacks/spring-boot-best-practice
3、Grafana 可视化监控数据
首先,获取 Grafana 的 Docker 镜像:
$ docker pull grafana/grafana1
然后,启动 Grafana:
$ docker run --name grafana -d -p 3000:3000 grafana/grafana1
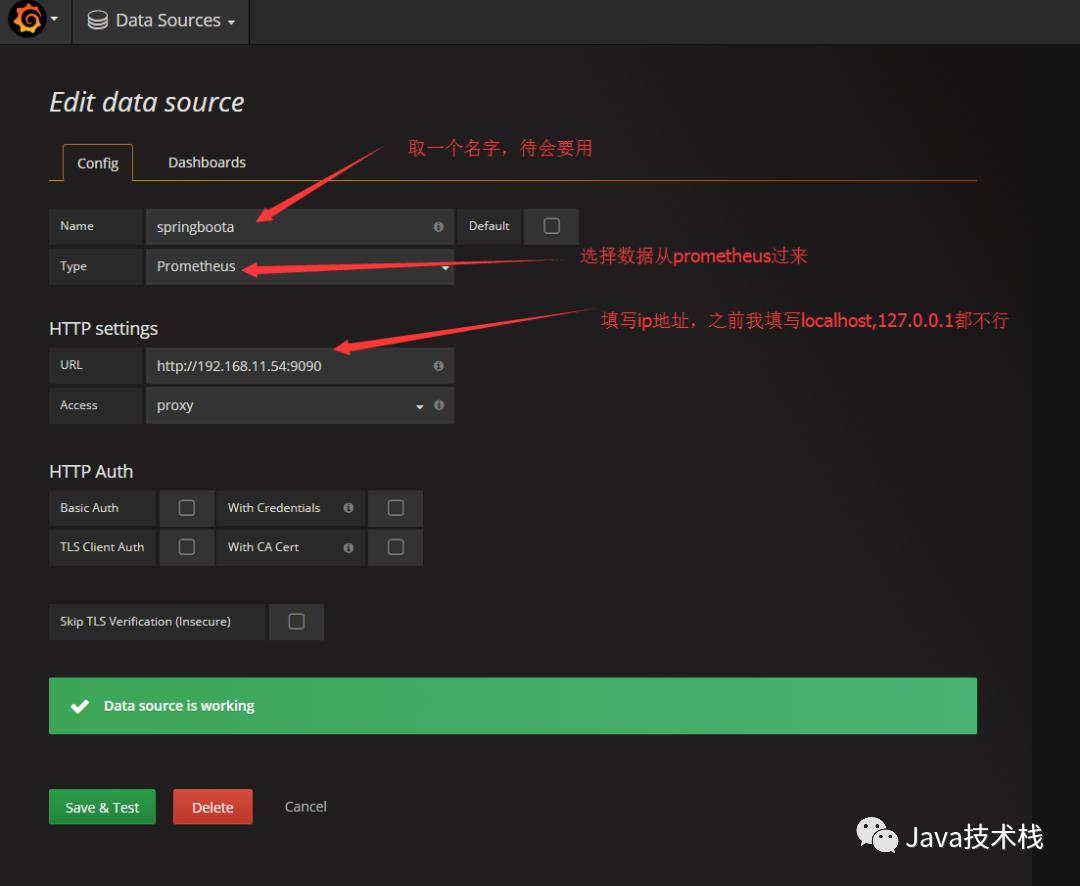
接着,访问 http://localhost:3000/ 配置 Prometheus 数据源:
Grafana 登录账号 admin 密码 admin
先配置数据源.
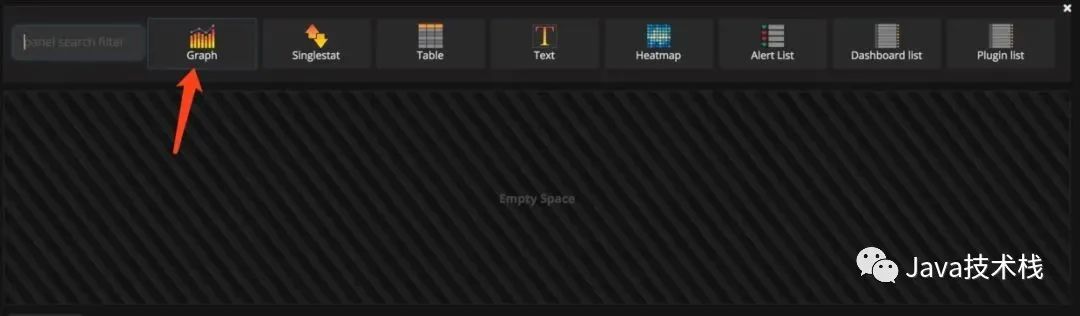
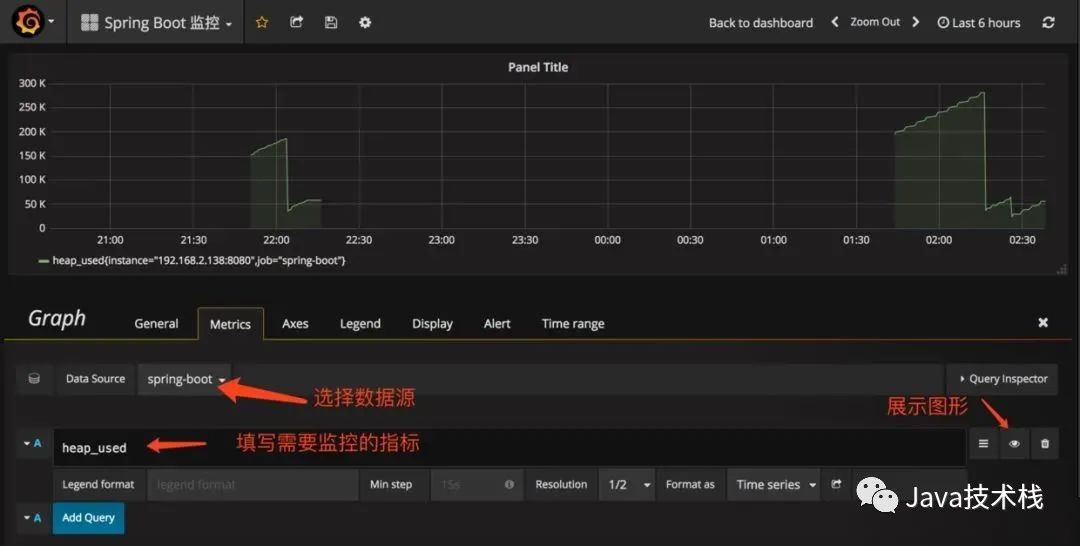
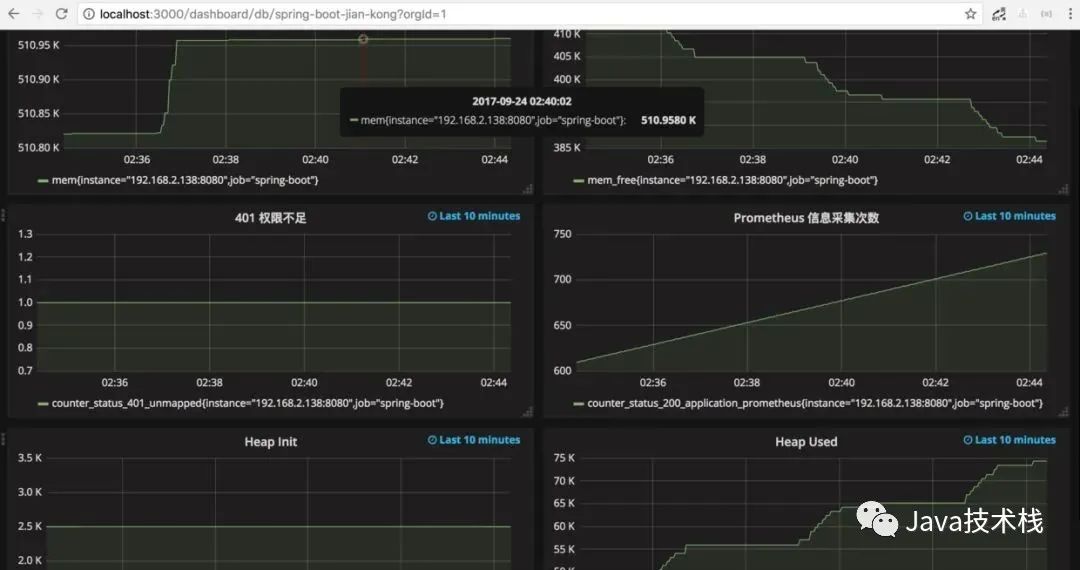
2.配置单个指标的可视化监控面板:

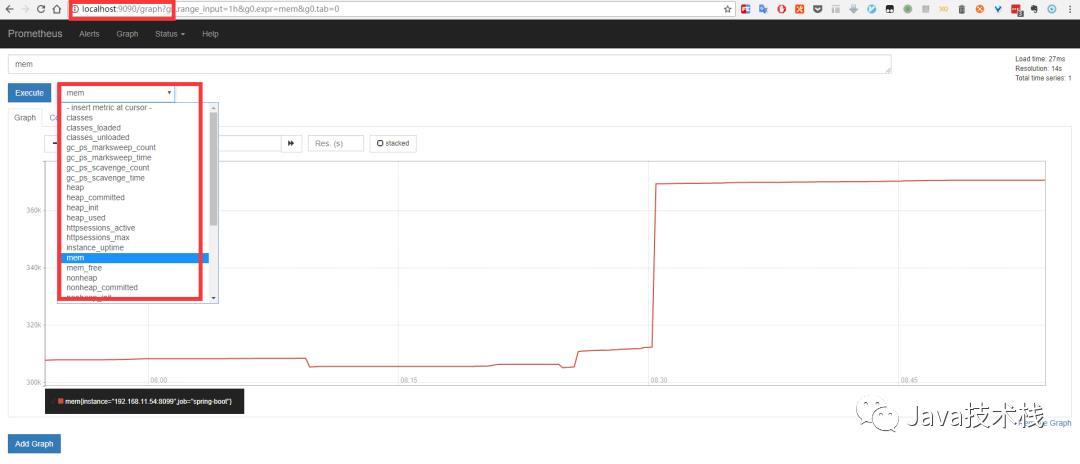
prometh采集的数据:
参考:https://www.jianshu.com/p/7ecb57a3f326
原文:https://blog.csdn.net/weixin_44196699/article/details/105010045
版权声明:本文为CSDN博主「你照亮了我的世界」的原创文章,遵循CC 4.0 BY-SA版权协议,转载请附上原文出处链接及本声明。


关注Java技术栈看更多干货


获取 Spring Boot 实战笔记!
以上是关于Spring Boot 应用可视化监控,一目了然!的主要内容,如果未能解决你的问题,请参考以下文章