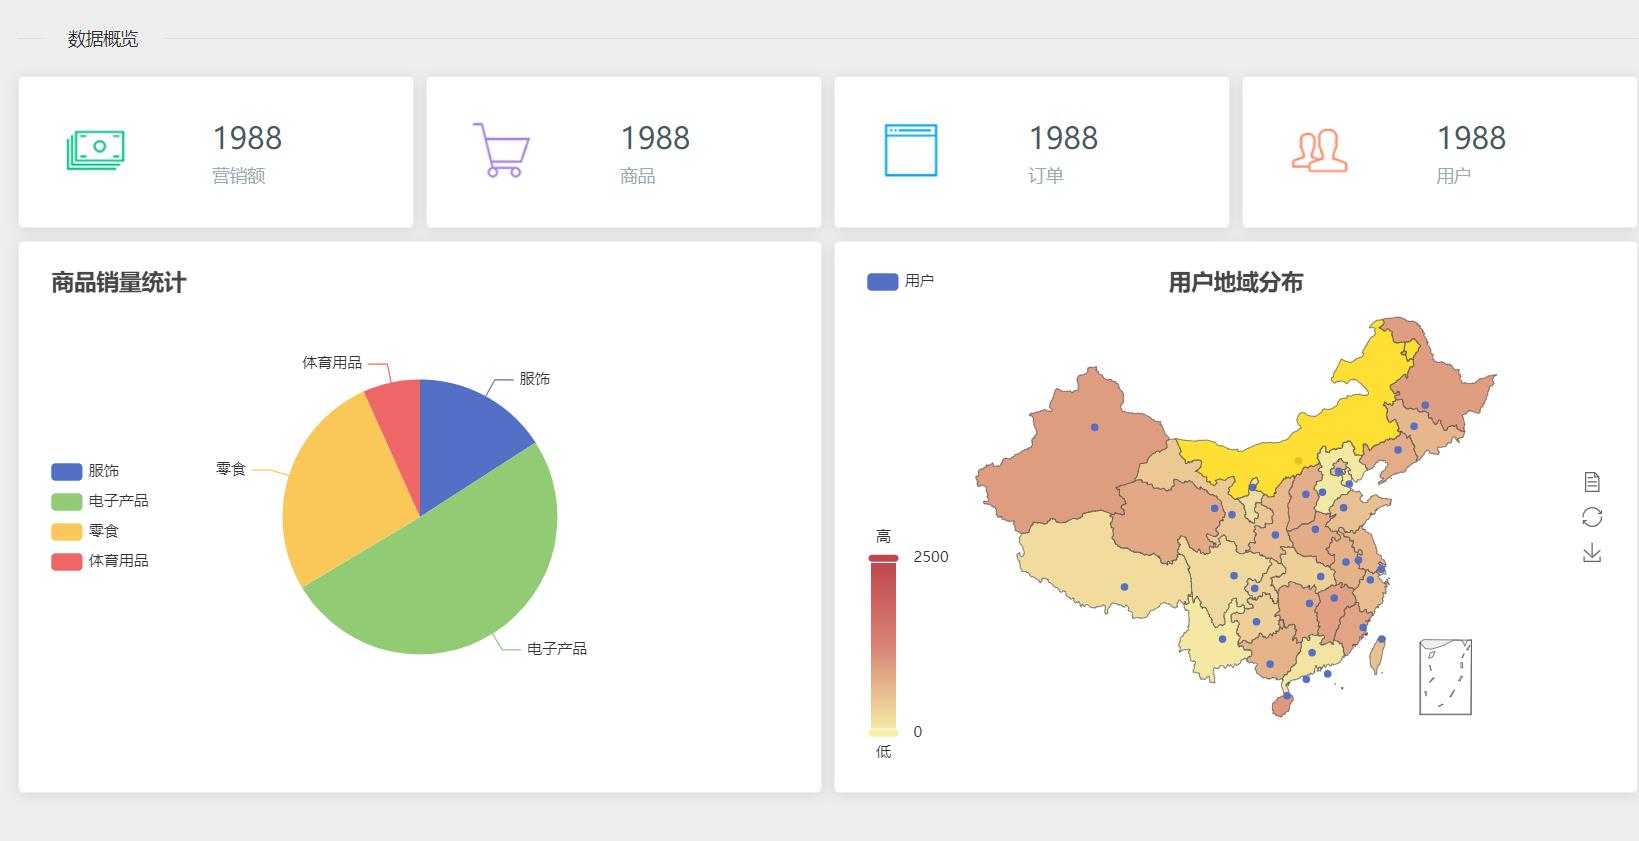
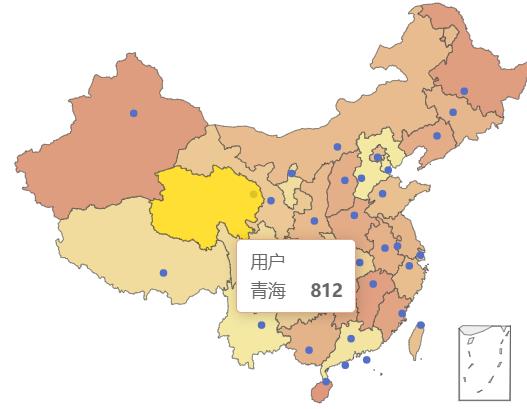
Echarts动态地图实现
Posted Roam-G
tags:
篇首语:本文由小常识网(cha138.com)小编为大家整理,主要介绍了Echarts动态地图实现相关的知识,希望对你有一定的参考价值。


代码:
<!DOCTYPE html>
<html lang="en">
<head>
<meta charset="UTF-8">
<title>首页</title>
<link rel="stylesheet" href="../../css/element.css">
<link rel="stylesheet" href="../../css/base.css">
<style>
.el-divider__text {
background: #eee;
}
</style>
</head>
<body>
<div id="wrapper" v-cloak>
<el-container>
<el-aside :width="isCollapse ? '64px' : '200px'" style="background-color: black; transition:width .5s">
<div style="background-color: black; height: 60px; line-height: 60px; text-align: center;
color: white; font-size: 20px;">
<transition name="el-fade-in-linear">
<span name="fade" v-show="!isCollapse"><a href="/page/end/index.html">X-Admin</a></span>
</transition>
</div>
<!-- 菜单 -->
<el-menu :default-openeds="['1']" style="border: none;" background-color="black" text-color="#fff" active-text-color="#ffd04b"
default-active="home"
class="el-menu-vertical-demo" :collapse="isCollapse">
<a href="/page/end/index.html">
<el-menu-item index="home">
<i class="el-icon-data-line"></i>
<span slot="title">首页</span>
</el-menu-item>
</a>
<el-submenu index="1" v-if="user.permission && user.permission.length > 0">
<template slot="title">
<i class="el-icon-menu"></i>
<span slot="title">信息管理</span>
</template>
<a :href=`${item.path}` v-for="item in user.permission" :key="item.id">
<el-menu-item :index="item.flag">
<i class="el-icon-s-data"></i>
<span slot="title">{{item.name}}</span>
</el-menu-item>
</a>
</el-submenu>
</el-menu>
</el-aside>
<el-container>
<el-header style="background-color: black; line-height: 60px; color: white;">
<el-row>
<el-col :span="1">
<i style="font-size: 22px; cursor: pointer"
:class="[isCollapse ? 'el-icon-s-unfold' : 'el-icon-s-fold']" @click="handleCollapse"></i>
</el-col>
<el-col :span="2" :offset="21" style="text-align: right">
<span style="color: white; margin-right: 10px">{{user.username}}</span>
<el-dropdown>
<img :src=`/files/${user.avatar}`
style="width: 40px; height: 40px; margin-right: 10px; border-radius: 50%">
<el-dropdown-menu slot="dropdown">
<a href="/page/end/person.html"
style="display:inline-block; padding: 5px 0; width: 100px; text-align: center; color: black">个人信息</a>
<a @click="logout" href="#"
style="display:block; width: 100px; text-align: center; color: black">退出</a>
</el-dropdown-menu>
</el-dropdown>
</el-col>
</el-row>
</el-header>
<!-- 主体区域 -->
<el-main>
<el-divider content-position="left">数据概览</el-divider>
<el-row :gutter="10" style="padding: 5px 0">
<el-col :span="6">
<el-card style="padding: 10px">
<div style="display: inline-block; padding-right: 20px; vertical-align: middle;">
<img src="../../file/home/home-01.png" style="width: 60px">
</div>
<div style="display: inline-block; padding-left: 40px; vertical-align: middle;">
<div style="color: #455a64; font-size: 24px; padding-bottom: 5px">1988</div>
<div style="color: #99abb4;">营销额</div>
</div>
</el-card>
</el-col>
<el-col :span="6">
<el-card style="padding: 10px">
<div style="display: inline-block; padding-right: 20px; vertical-align: middle;">
<img src="../../file/home/home-02.png" style="width: 60px">
</div>
<div style="display: inline-block; padding-left: 40px; vertical-align: middle;">
<div style="color: #455a64; font-size: 24px; padding-bottom: 5px">1988</div>
<div style="color: #99abb4;">商品</div>
</div>
</el-card>
</el-col>
<el-col :span="6">
<el-card style="padding: 10px">
<div style="display: inline-block; padding-right: 20px; vertical-align: middle;">
<img src="../../file/home/home-03.png" style="width: 60px">
</div>
<div style="display: inline-block; padding-left: 40px; vertical-align: middle;">
<div style="color: #455a64; font-size: 24px; padding-bottom: 5px">1988</div>
<div style="color: #99abb4;">订单</div>
</div>
</el-card>
</el-col>
<el-col :span="6">
<el-card style="padding: 10px">
<div style="display: inline-block; padding-right: 20px; vertical-align: middle;">
<img src="../../file/home/home-04.png" style="width: 60px">
</div>
<div style="display: inline-block; padding-left: 40px; vertical-align: middle;">
<div style="color: #455a64; font-size: 24px; padding-bottom: 5px">1988</div>
<div style="color: #99abb4;">用户</div>
</div>
</el-card>
</el-col>
</el-row>
<el-row :gutter="10" style="padding: 5px 0">
<el-col :span="12">
<el-card>
<!-- 为ECharts准备一个具备大小(宽高)的Dom -->
<div id="main" style="width: 600px;height:400px; margin: 0 auto"></div>
</el-card>
</el-col>
<el-col :span="12">
<el-card>
<!-- 为ECharts准备一个具备大小(宽高)的Dom -->
<div id="map" style="width: 600px;height:400px; margin: 0 auto"></div>
</el-card>
</el-col>
</el-row>
</el-main>
</el-container>
</el-container>
</div>
<script src="../../js/echarts.min.js"></script>
<script src="../../js/china.js"></script>
<script src="../../js/jquery.min.js"></script>
<script src="../../js/vue.min.js"></script>
<script src="../../js/element.js"></script>
<script src="../../js/base.js"></script>
<script>
let pieOption = {
"title":{
"text":"商品销量统计"
},
"legend":{
"x":"left",
"y":"center",
"orient":"vertical",
"data":[
"服饰",
"电子产品",
"零食",
"体育用品"
]
},
"tooltip":{
"show":true
},
"xAxis":null,
"yAxis":null,
"series":[
{
"name":"用户比例",
"type":"pie",
"radius":"55%",
"data":[
{
"name":"服饰",
"value":589
},
{
"name":"电子产品",
"value":1874
},
{
"name":"零食",
"value":995
},
{
"name":"体育用品",
"value":249
}
]
}
]
}
let mapOption = {
title : {
text: '用户地域分布',
subtext: '',
left: 'center'
},
tooltip : {
trigger: 'item'
},
legend: {
orient: 'vertical',
left: 'left',
data:['用户']
},
visualMap: {
min: 0,
max: 2500,
left: 'left',
top: 'bottom',
text:['高','低'], // 文本,默认为数值文本
calculable : true
},
toolbox: {
show: true,
orient : 'vertical',
left: 'right',
top: 'center',
feature : {
mark : {show: true},
dataView : {show: true, readOnly: false},
restore : {show: true},
saveAsImage : {show: true}
}
},
series : [
{
name: '用户',
type: 'map',
mapType: 'china',
roam: false,
label: {
normal: {
show: false
},
emphasis: {
show: true
}
},
data:[
{name: '北京',value: Math.round(Math.random()*1000)},
{name: '天津',value: Math.round(Math.random()*1000)},
{name: '上海',value: Math.round(Math.random()*1000)},
{name: '重庆',value: Math.round(Math.random()*1000)},
{name: '河北',value: Math.round(Math.random()*1000)},
{name: '河南',value: Math.round(Math.random()*1000)},
{name: '云南',value: Math.round(Math.random()*1000)},
{name: '辽宁',value: Math.round(Math.random()*1000)},
{name: '黑龙江',value: Math.round(Math.random()*1000)},
{name: '湖南',value: Math.round(Math.random()*1000)},
{name: '安徽',value: Math.round(Math.random()*1000)},
{name: '山东',value: Math.round(Math.random()*1000)},
{name: '新疆',value: Math.round(Math.random()*1000)},
{name: '江苏',value: Math.round(Math.random()*1000)},
{name: '浙江',value: Math.round(Math.random()*1000)},
{name: '江西',value: Math.round(Math.random()*1000)},
{name: '湖北',value: Math.round(Math.random()*1000)},
{name: '广西',value: Math.round(Math.random()*1000)},
{name: '甘肃',value: Math.round(Math.random()*1000)},
{name: '山西',value: Math.round(Math.random()*1000)},
{name: '内蒙古',value: Math.round(Math.random()*1000)},
{name: '陕西',value: Math.round(Math.random()*1000)},
{name: '吉林',value: Math.round(Math.random()*1000)},
{name: '福建',value: Math.round(Math.random()*1000)},
{name: '贵州',value: Math.round(Math.random()*1000)},
{name: '广东',value: Math.round(Math.random()*1000)},
{name: '青海',value: Math.round(Math.random()*1000)},
{name: '西藏',value: Math.round(Math.random()*1000)},
{name: '四川',value: Math.round(Math.random()*1000)},
{name: '宁夏',value: Math.round(Math.random()*1000)},
{name: '海南',value: Math.round(Math.random()*1000)},
{name: '台湾',value: Math.round(Math.random()*1000)},
{name: '香港',value: Math.round(Math.random()*1000)},
{name: '澳门',value: Math.round(Math.random()*1000)}
]
}
]
};
new Vue({
el: "#wrapper",
data: {
user: {},
tableData: [],
pageNum: 1,
pageSize: 10,
total: 0,
dialogFormVisible: false,
entity: {},
isCollapse: false
},
mounted() {
this.user = sessionStorage.getItem("user") ? JSON.parse(sessionStorage.getItem("user")) : {};
this.loadEcharts();
},
methods: {
loadEcharts() {
// 基于准备好的dom,初始化echarts实例
let myChart = echarts.init(document.getElementById('main'));
// 使用刚指定的配置项和数据显示图表。
myChart.setOption(pieOption);
// 基于准备好的dom,初始化echarts实例
let mapChart = echarts.init(document.getElementById('map'));
// 使用刚指定的配置项和数据显示图表。
mapChart.setOption(mapOption);
},
handleCollapse() {
this.isCollapse = !this.isCollapse;
},
logout() {
$.get("/user/logout");
sessionStorage.removeItem("user");
location.href = "/page/end/login.html";
}
}
})
</script>
</body>
</html>
以上是关于Echarts动态地图实现的主要内容,如果未能解决你的问题,请参考以下文章