SQL调优带您涨薪资之show profile分析sql性能
Posted 栗子~~
tags:
篇首语:本文由小常识网(cha138.com)小编为大家整理,主要介绍了SQL调优带您涨薪资之show profile分析sql性能相关的知识,希望对你有一定的参考价值。
文章目录
前言
如果您觉得有用的话,记得给博主点个赞,评论,收藏一键三连啊,写作不易啊^ _ ^。
而且听说点赞的人每天的运气都不会太差,实在白嫖的话,那欢迎常来啊!!!
SQL调优带您涨薪资之show profile分析sql性能
注:Show profiles是5.0.37之后添加的,要想使用此功能,要确保版本在5.0.37之后
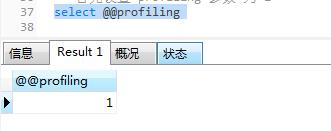
01 首先设置 profiling 参数 为 1
select @@profiling
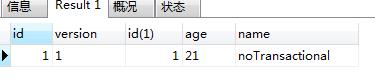
02实例:分析以下sql性能
SELECT * from test_version o left join test p on o.id = p.id and p.id in(‘1’);
表结构看上期博客:
干货实战详解-SQL调优之explian 分析低效SQL的执行计划并优化
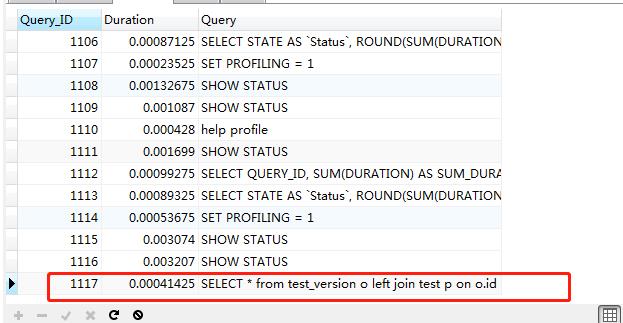
使用show profiles ;来分析sql性能情况:
SELECT * from test_version o left join test p on o.id = p.id and p.id in(‘1’);
show profiles ;
03 通过query_id查询当前线程各种情况
通过query_id查询当前线程,可以看到每个步骤的执行时间
show profile for query 1117;
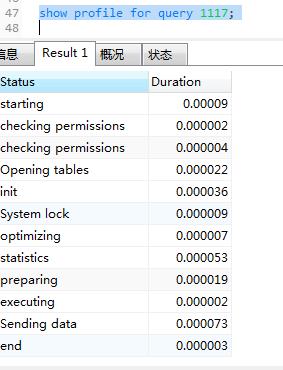
在获取最消耗时间的线程状态后也可进一步选择all、cpu等明细来查看在使用什么资源上消耗了较多时间。
04 通过query_id明细查看sql的资源消耗
获取 profile 帮助
执行 help profile;

拿出 description字段和example字段内容,通过使用说明来进行查定向查询
Syntax:
SHOW PROFILE [type [, type] ... ]
    [FOR QUERY n]
    [LIMIT row_count [OFFSET offset]]


type: {
    ALL
  | BLOCK IO
  | CONTEXT SWITCHES
  | CPU
  | IPC
  | MEMORY
  | PAGE FAULTS
  | SOURCE
  | SWAPS
}


The SHOW PROFILE and SHOW PROFILES statements display profiling
information that indicates resource usage for statements executed
during the course of the current session.


*Note*:


The SHOW PROFILE and SHOW PROFILES statements are deprecated and will
be removed in a future mysql release. Use the Performance Schema
instead; see
https://dev.mysql.com/doc/refman/5.7/en/performance-schema-query-profil
ing.html.


To control profiling, use the profiling session variable, which has a
default value of 0 (OFF). Enable profiling by setting profiling to 1 or
ON:


mysql> SET profiling = 1;


SHOW PROFILES displays a list of the most recent statements sent to the
server. The size of the list is controlled by the
profiling_history_size session variable, which has a default value of
15. The maximum value is 100. Setting the value to 0 has the practical
effect of disabling profiling.


All statements are profiled except SHOW PROFILE and SHOW PROFILES, so
you will find neither of those statements in the profile list.
Malformed statements are profiled. For example, SHOW PROFILING is an
illegal statement, and a syntax error occurs if you try to execute it,
but it will show up in the profiling list.


SHOW PROFILE displays detailed information about a single statement.
Without the FOR QUERY n clause, the output pertains to the most
recently executed statement. If FOR QUERY n is included, SHOW PROFILE
displays information for statement n. The values of n correspond to the
Query_ID values displayed by SHOW PROFILES.


The LIMIT row_count clause may be given to limit the output to
row_count rows. If LIMIT is given, OFFSET offset may be added to begin
the output offset rows into the full set of rows.


By default, SHOW PROFILE displays Status and Duration columns. The
Status values are like the State values displayed by SHOW PROCESSLIST,
although there might be some minor differences in interpretion for the
two statements for some status values (see
https://dev.mysql.com/doc/refman/5.7/en/thread-information.html).


Optional type values may be specified to display specific additional
types of information:


o ALL displays all information


o BLOCK IO displays counts for block input and output operations


o CONTEXT SWITCHES displays counts for voluntary and involuntary
  context switches


o CPU displays user and system CPU usage times


o IPC displays counts for messages sent and received


o MEMORY is not currently implemented


o PAGE FAULTS displays counts for major and minor page faults


o SOURCE displays the names of functions from the source code, together
  with the name and line number of the file in which the function
  occurs


o SWAPS displays swap counts


Profiling is enabled per session. When a session ends, its profiling
information is lost.


URL: https://dev.mysql.com/doc/refman/5.7/en/show-profile.html


mysql> SELECT @@profiling;
+-------------+
| @@profiling |
+-------------+
|           0 |
+-------------+
1 row in set (0.00 sec)


mysql> SET profiling = 1;
Query OK, 0 rows affected (0.00 sec)


mysql> DROP TABLE IF EXISTS t1;
Query OK, 0 rows affected, 1 warning (0.00 sec)


mysql> CREATE TABLE T1 (id INT);
Query OK, 0 rows affected (0.01 sec)


mysql> SHOW PROFILES;
+----------+----------+--------------------------+
| Query_ID | Duration | Query                    |
+----------+----------+--------------------------+
|        0 | 0.000088 | SET PROFILING = 1        |
|        1 | 0.000136 | DROP TABLE IF EXISTS t1  |
|        2 | 0.011947 | CREATE TABLE t1 (id INT) |
+----------+----------+--------------------------+
3 rows in set (0.00 sec)


mysql> SHOW PROFILE;
+----------------------+----------+
| Status               | Duration |
+----------------------+----------+
| checking permissions | 0.000040 |
| creating table       | 0.000056 |
| After create         | 0.011363 |
| query end            | 0.000375 |
| freeing items        | 0.000089 |
| logging slow query   | 0.000019 |
| cleaning up          | 0.000005 |
+----------------------+----------+
7 rows in set (0.00 sec)


mysql> SHOW PROFILE FOR QUERY 1;
+--------------------+----------+
| Status             | Duration |
+--------------------+----------+
| query end          | 0.000107 |
| freeing items      | 0.000008 |
| logging slow query | 0.000015 |
| cleaning up        | 0.000006 |
+--------------------+----------+
4 rows in set (0.00 sec)


mysql> SHOW PROFILE CPU FOR QUERY 2;
+----------------------+----------+----------+------------+
| Status               | Duration | CPU_user | CPU_system |
+----------------------+----------+----------+------------+
| checking permissions | 0.000040 | 0.000038 |   0.000002 |
| creating table       | 0.000056 | 0.000028 |   0.000028 |
| After create         | 0.011363 | 0.000217 |   0.001571 |
| query end            | 0.000375 | 0.000013 |   0.000028 |
| freeing items        | 0.000089 | 0.000010 |   0.000014 |
| logging slow query   | 0.000019 | 0.000009 |   0.000010 |
| cleaning up          | 0.000005 | 0.000003 |   0.000002 |
+----------------------+----------+----------+------------+
7 rows in set (0.00 sec)
以上是关于SQL调优带您涨薪资之show profile分析sql性能的主要内容,如果未能解决你的问题,请参考以下文章