监控 - Prometheus+Thanos的全局视图与无缝高可用
Posted 王万林 Ben
tags:
篇首语:本文由小常识网(cha138.com)小编为大家整理,主要介绍了监控 - Prometheus+Thanos的全局视图与无缝高可用相关的知识,希望对你有一定的参考价值。
监控 - Prometheus+Thanos的全局视图与无缝高可用
文章目录
前言
随着公司业务拓展,多数据中心将在多地域建设,给已有的Prometheus监控系统带来挑战——如何跨广域网监控多个地域的数据中心?本文将围绕该痛点,就Thanos能给我们带来全局视图与无缝高可用的视角,来进行演示。
一、Thanos是什么?
Thanos是一组组件,可以组成具有无限存储容量的高度可用的公制系统。可以将其无缝添加到现有Prometheus部署之上。
Thanos提供了全局查询视图,数据备份和历史数据访问作为其核心功能。这三个功能可以彼此独立运行。这使您可以准备好Thanos功能的子集以立即受益或测试,同时还使其可以灵活地在更复杂的环境中逐步采用。
二、步骤
1.启动初始的Prometheus服务器
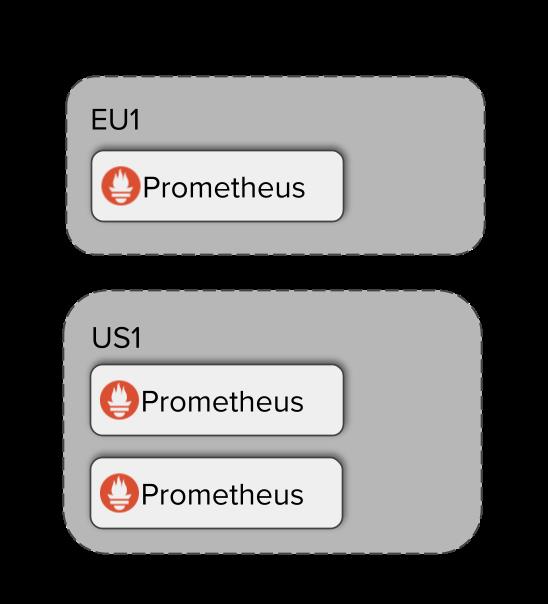
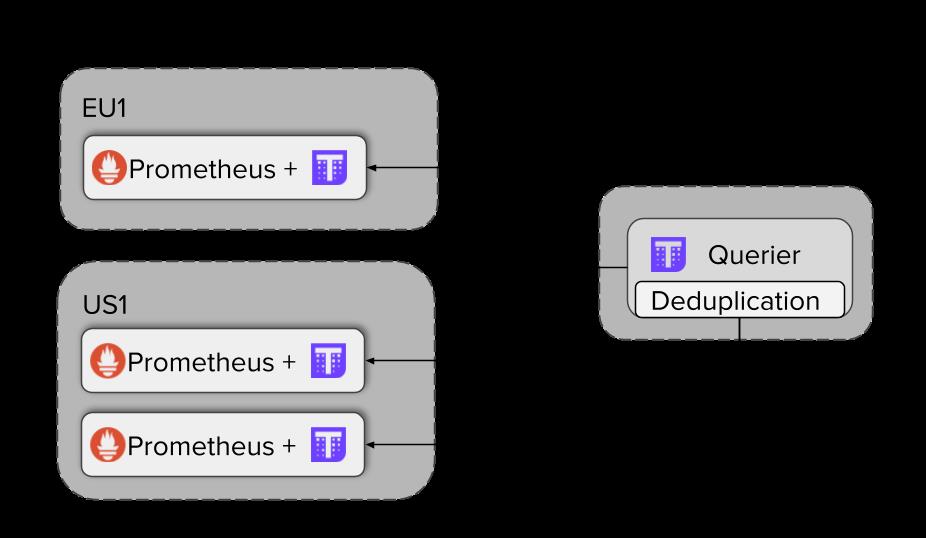
假设我们在英国的EU1集群有一个Prometheus服务器,在美国的US1集群有两个互为副本(抓取相同targets的)Prometheus服务器。如下图:
 编写配置文件。
需要注意的是,每个Prometheus实例都要有一个全局唯一的识别标签,因为它代表特定流数据而非常重要。在这些精准的外部标签中,压缩与降准采样可以执行,Querier会过滤其store APIs,进一步的分片选项,重复数据删除以及潜在的多租户功能。因为事后追溯编辑很困难,因此在规划编写时,必须要提供一批兼容的外部标签。
[root@host01 ~]# for i in `ls`; do echo '#' cat $i; cat $i; done
# cat prometheus0_eu1.yml
global:
  scrape_interval: 15s
  evaluation_interval: 15s
  external_labels:
    cluster: eu1
    replica: 0

scrape_configs:
  - job_name: 'prometheus'
    static_configs:
      - targets: ['127.0.0.1:9090']

# cat prometheus0_us1.yml
global:
  scrape_interval: 15s
  evaluation_interval: 15s
  external_labels:
    cluster: us1
    replica: 0

scrape_configs:
  - job_name: 'prometheus'
    static_configs:
      - targets: ['127.0.0.1:9091','127.0.0.1:9092']

# cat prometheus1_us1.yml
global:
  scrape_interval: 15s
  evaluation_interval: 15s
  external_labels:
    cluster: us1
    replica: 1

scrape_configs:
  - job_name: 'prometheus'
    static_configs:
      - targets: ['127.0.0.1:9091','127.0.0.1:9092']
启动Prometheus实例
请注意我们将传递额外的选项给Prometheus,
--web.enable-admin-api允许Thanos Sidecar从Prometheus获取如external labels等metadata--web.enable-lifecycle允许Thanos Sidecar去reload Prometheus配置文件与规则文件(如果有使用的话)
[root@host01 ~]# mkdir -p prometheus0_eu1_data prometheus0_us1_data prometheus1_us1_data #创建数据存储目录
[root@host01 ~]# docker run -d --net=host --rm \\
>     -v $(pwd)/prometheus0_eu1.yml:/etc/prometheus/prometheus.yml \\
>     -v $(pwd)/prometheus0_eu1_data:/prometheus \\
>     -u root \\
>     --name prometheus-0-eu1 \\
>     quay.io/prometheus/prometheus:v2.14.0 \\
>     --config.file=/etc/prometheus/prometheus.yml \\
>     --storage.tsdb.path=/prometheus \\
>     --web.listen-address=:9090 \\
>     --web.external-url=https://2886795290-9090-ollie02.environments.katacoda.com \\
>     --web.enable-lifecycle \\
>     --web.enable-admin-api && echo "Prometheus EU1 started!"
Unable to find image 'quay.io/prometheus/prometheus:v2.14.0' locally
v2.14.0: Pulling from prometheus/prometheus
8e674ad76dce: Pull complete
e77d2419d1c2: Pull complete
8674123643f1: Pull complete
21ee3b79b17a: Pull complete
d9073bbe10c3: Pull complete
585b5cbc27c1: Pull complete
0b174c1d55cf: Pull complete
a1b4e43b91a7: Pull complete
31ccb7962a7c: Pull complete
e247e238102a: Pull complete
6798557a5ee4: Pull complete
cbfcb065e0ae: Pull complete
Digest: sha256:907e20b3b0f8b0a76a33c088fe9827e8edc180e874bd2173c27089eade63d8b8
Status: Downloaded newer image for quay.io/prometheus/prometheus:v2.14.0
c16196b32a40769cbd1f04634fc9696ea1d727eec9f3a217151ec2269594ec17
Prometheus EU1 started!
[root@host01 ~]# docker run -d --net=host --rm \\
>     -v $(pwd)/prometheus0_us1.yml:/etc/prometheus/prometheus.yml \\
>     -v $(pwd)/prometheus0_us1_data:/prometheus \\
>     -u root \\
>     --name prometheus-0-us1 \\
>     quay.io/prometheus/prometheus:v2.14.0 \\
>     --config.file=/etc/prometheus/prometheus.yml \\
>     --storage.tsdb.path=/prometheus \\
>     --web.listen-address=:9091 \\
>     --web.external-url=https://2886795290-9091-ollie02.environments.katacoda.com \\
>     --web.enable-lifecycle \\
>     --web.enable-admin-api && echo "Prometheus 0 US1 started!"
85e6a2af59e228d674b34e9668462ab5a84dae323528cc8975c3e1e653183ffa
Prometheus 0 US1 started!
[root@host01 ~]# docker run -d --net=host --rm \\
>     -v $(pwd)/prometheus1_us1.yml:/etc/prometheus/prometheus.yml \\
>     -v $(pwd)/prometheus1_us1_data:/prometheus \\
>     -u root \\
>     --name prometheus-1-us1 \\
>     quay.io/prometheus/prometheus:v2.14.0 \\
>     --config.file=/etc/prometheus/prometheus.yml \\
>     --storage.tsdb.path=/prometheus \\
>     --web.listen-address=:9092 \\
>     --web.external-url=https://2886795290-9092-ollie02.environments.katacoda.com \\
>     --web.enable-lifecycle \\
>     --web.enable-admin-api && echo "Prometheus 1 US1 started!"
13a59b0c512889dad176563f5fad29959c2a3fa0275a81a886b960180b8b1b50
Prometheus 1 US1 started!
[root@host01 ~]#
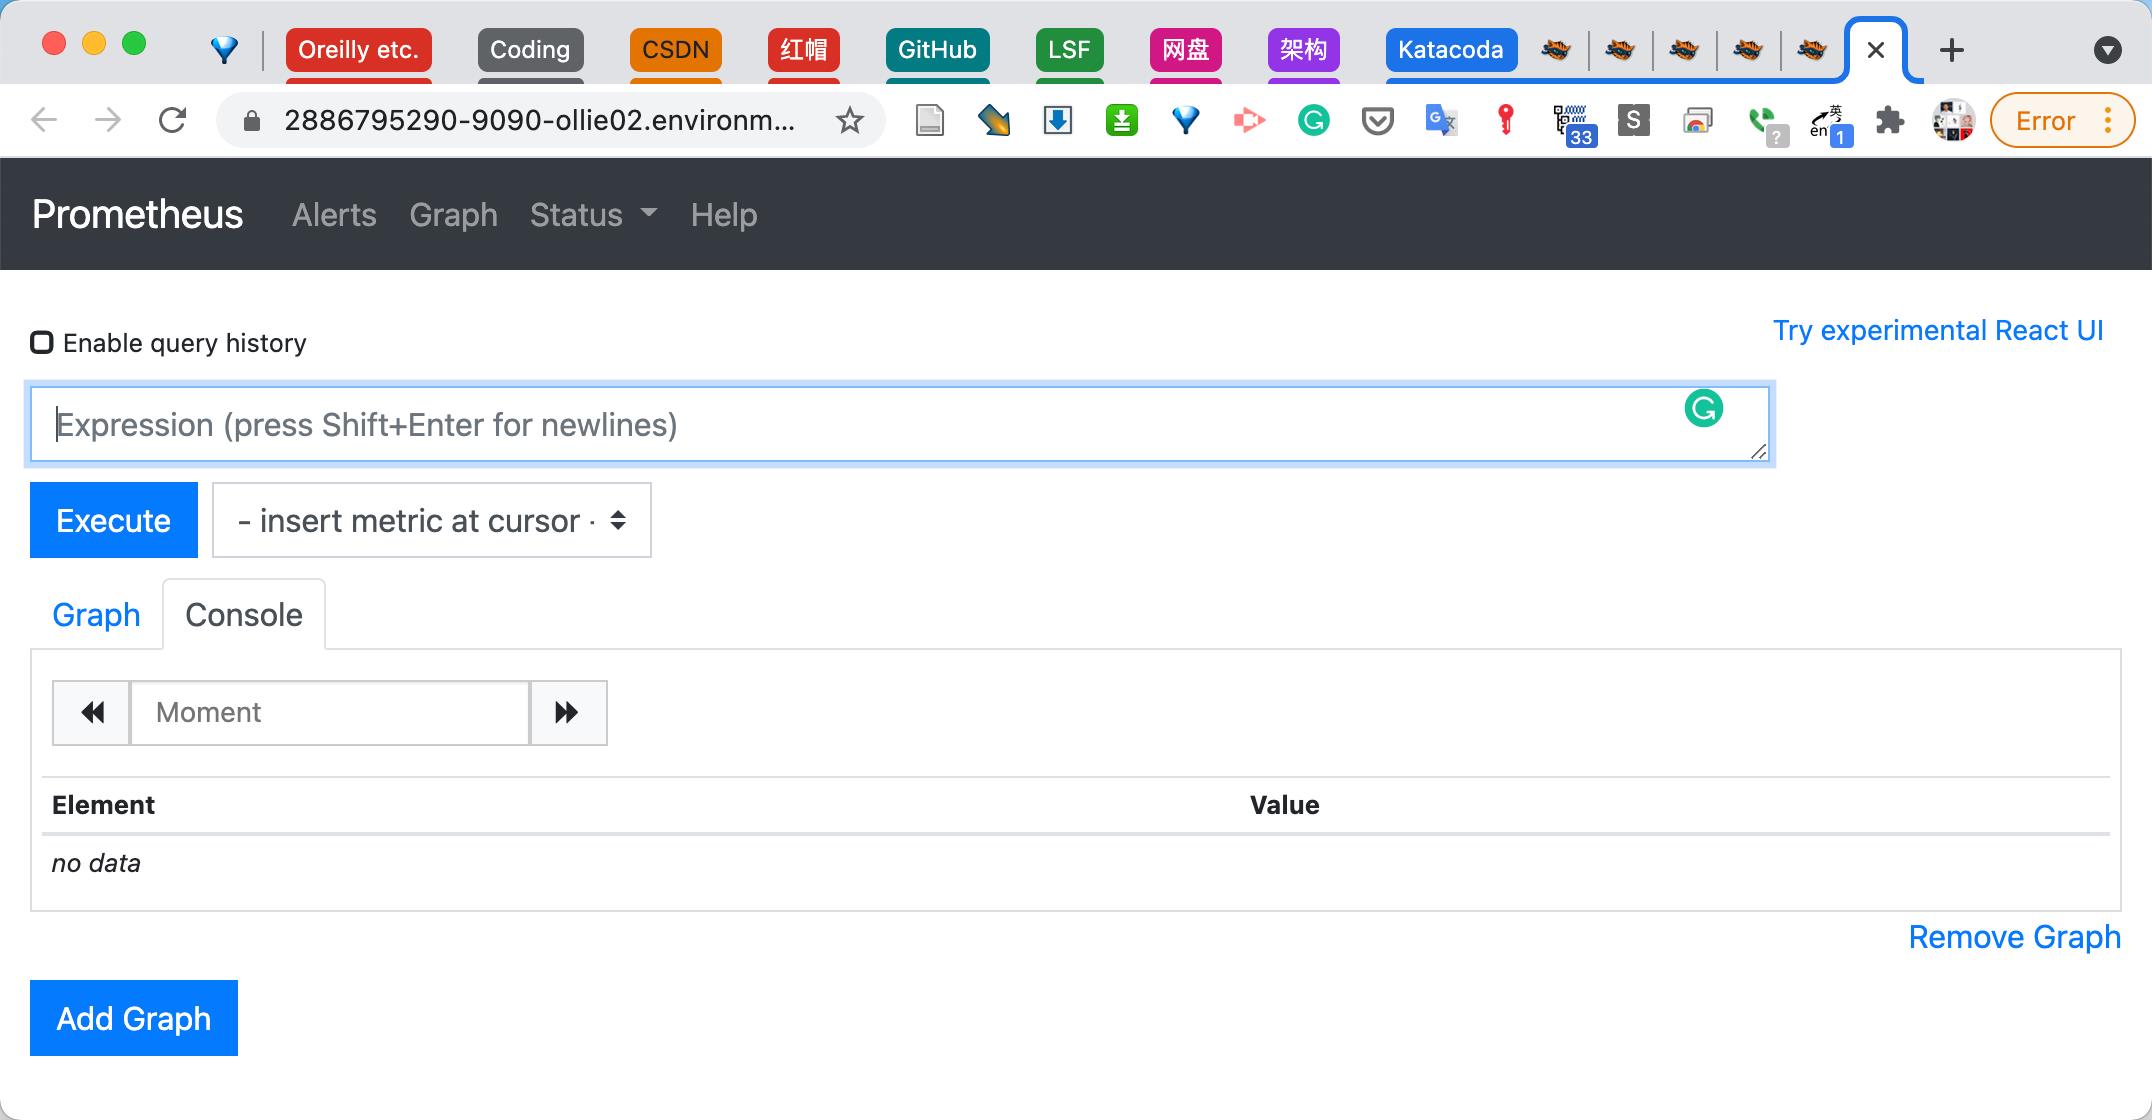
访问web页面,看其中一个Promethes实例
 Q:为什么需要多个Prometheus实例?
A:
- High Availability(多副本)
- 扩大消化(功能分片)
- 多集群/环境架构
在这些Prometheus实例中,总体上有多少metrics?查看prometheus_tsdb_head_series metric。
2.安装Thanos Sidecars
查看Thanos命令
[root@host01 ~]# docker run --rm quay.io/thanos/thanos:v0.20.0 --help
usage: thanos [<flags>] <command> [<args> ...]

A block storage based long-term storage for Prometheus.

Flags:
  -h, --help               Show context-sensitive help (also try --help-long and
                           --help-man).
      --log.format=logfmt  Log format to use. Possible options: logfmt or json.
      --log.level=info     Log filtering level.
      --tracing.config=<content>
                           Alternative to 'tracing.config-file' flag (mutually
                           exclusive). Content of YAML file with tracing
                           configuration. See format details:
                           https://thanos.io/tip/thanos/tracing.md/#configuration
      --tracing.config-file=<file-path>
                           Path to YAML file with tracing configuration. See
                           format details:
                           https://thanos.io/tip/thanos/tracing.md/#configuration
      --version            Show application version.

Commands:
  help [<command>...]
    Show help.

  sidecar [<flags>]
    Sidecar for Prometheus server.

  store [<flags>]
    Store node giving access to blocks in a bucket provider. Now supported GCS,
    S3, Azure, Swift, Tencent COS and Aliyun OSS.

  query [<flags>]
    Query node exposing PromQL enabled Query API with data retrieved from
    multiple store nodes.

  rule [<flags>]
    Ruler evaluating Prometheus rules against given Query nodes, exposing Store
    API and storing old blocks in bucket.

  compact [<flags>]
    Continuously compacts blocks in an object store bucket.

  tools bucket verify [<flags>]
    Verify all blocks in the bucket against specified issues. NOTE: Depending on
    issue this might take time and will need downloading all specified blocks to
    disk.

  tools bucket ls [<flags>]
    List all blocks in the bucket.

  tools bucket inspect [<flags>]
    Inspect all blocks in the bucket in detailed, table-like way.

  tools bucket web [<flags>]
    Web interface for remote storage bucket.

  tools bucket replicate [<flags>]
    Replicate data from one object storage to another. NOTE: Currently it works
    only with Thanos blocks (meta.json has to have Thanos metadata).

  tools bucket downsample [<flags>]
    Continuously downsamples blocks in an object store bucket.

  tools bucket cleanup [<flags>]
    Cleans up all blocks marked for deletion.

  tools bucket mark --id=ID --marker=MARKER --details=DETAILS
    Mark block for deletion or no-compact in a safe way. NOTE: If the compactor
    is currently running compacting same block, this operation would be
    potentially a noop.

  tools bucket rewrite --id=ID [<flags>]
    Rewrite chosen blocks in the bucket, while deleting or modifying series
    Resulted block has modified stats in meta.json. Additionally
    compaction.sources are altered to not confuse readers of meta.json. Instead
    thanos.rewrite section is added with useful info like old sources and
    deletion requests. NOTE: It's recommended to turn off compactor while doing
    this operation. If the compactor is running and touching exactly same block
    that is being rewritten, the resulted rewritten block might only cause
    overlap (mitigated by marking overlapping block manually for deletion) and
    the data you wanted to rewrite could already part of bigger block.

    Use FILESYSTEM type of bucket to rewrite block on disk (suitable for vanilla
    Prometheus) After rewrite, it's caller responsibility to delete or mark
    source block for deletion to avoid overlaps. WARNING: This procedure is
    *IRREVERSIBLE* after certain time (delete delay), so do backup your blocks
    first.

  tools rules-check --rules=RULES
    Check if the rule files are valid or not.

  receive [<flags>]
    Accept Prometheus remote write API requests and write to local tsdb.

  query-frontend [<flags>]
    Query frontend command implements a service deployed in front of queriers to
    improve query parallelization and caching.


[root@host01 ~]#
在本例中,我们关注
sidecar [<flags>]
    sidecar for Prometheus server
Sidecar就像名字说的那样,它与Prometheus一起部署,它有几个特性:
- 它将Prometheus metrics暴露为通用Thanos StoreAPI。Thanos StoreAPI是一个通用的gRPC API,允许Thanos组件从多种系统/后端获取metrics。
- 它可以将数据持久化
- 它有能力察觉配置文件与规则文件的变动,并告知Prometheus动态地reload
- 环境变量
- gzip压缩的可以选择解压缩
如下图,安装Thanos后的架构是这样的
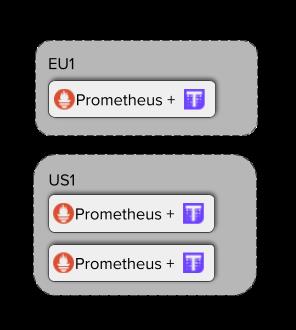
为每个Prometheus增加Thanos Sidecar
[root@host01 ~]# docker run -d --net=host --rm \\
>     -v $(pwd)/prometheus0_eu1.yml:/etc/prometheus/prometheus.yml \\
>     --name prometheus-0-sidecar-eu1 \\
>     -u root \\
>     quay.io/thanos/thanos:v0.20.0 \\
>     sidecar \\
>     --http-address 0.0.0.0:19090 \\
>     --grpc-address 0.0.0.0:19190 \\
>     --reloader.config-file /etc/prometheus/prometheus.yml \\
>     --prometheus.url http://127.0.0.1:9090 && echo "Started sidecar for Prometheus 0 EU1"
8452ee08e0dcf45209ddbbabba7cdf103396526ccf941cd16dd8d9a626d1019e
Started sidecar for Prometheus 0 EU1
[root@host01 ~]# docker run -d --net=host --rm \\
>     -v $(pwd)/prometheus0_us1.yml:/etc/prometheus/prometheus.yml \\
>     --name prometheus-0-sidecar-us1 \\
>     -u root \\
>     quay.io/thanos/thanos:v0.20.0 \\
>     sidecar \\
>     --http-address 0.0.0.0:19091 \\
>     --grpc-address 0.0.0.0:19191 \\
>     --reloader.config-file /etc/prometheus/prometheus.yml \\
>     --prometheus.url http://127.0.0.1:9091 && echo "Started sidecar for Prometheus 0 US1"
357919c489728c6704a51909710a293d8954bd275b7f61d0607d2732a01693f4
Started sidecar for Prometheus 0 US1
[root@host01 ~]# docker run -d --net=host --rm \\
>     -v $(pwd)/prometheus1_us1.yml:/etc/prometheus/prometheus.yml \\
>     --name prometheus-1-sidecar-us1 \\
>     -u root \\
>     quay.io/thanos/thanos:v0.20.0 \\
>     sidecar \\
>     --http-address 0.0.0.0:19092 \\
>     --grpc-address 0.0.0.0:19192 \\
>     --reloader.config-file /etc/prometheus/prometheus.yml \\
>     --prometheus.url http://127.0.0.1:9092 && echo "Started sidecar for Prometheus 1 US1"
9d6d873faa97ccd3a881041fd6c32a794ceed7389198197a9bd4df13d3b73047
Started sidecar for Prometheus 1 US1
[root@host01 ~]#
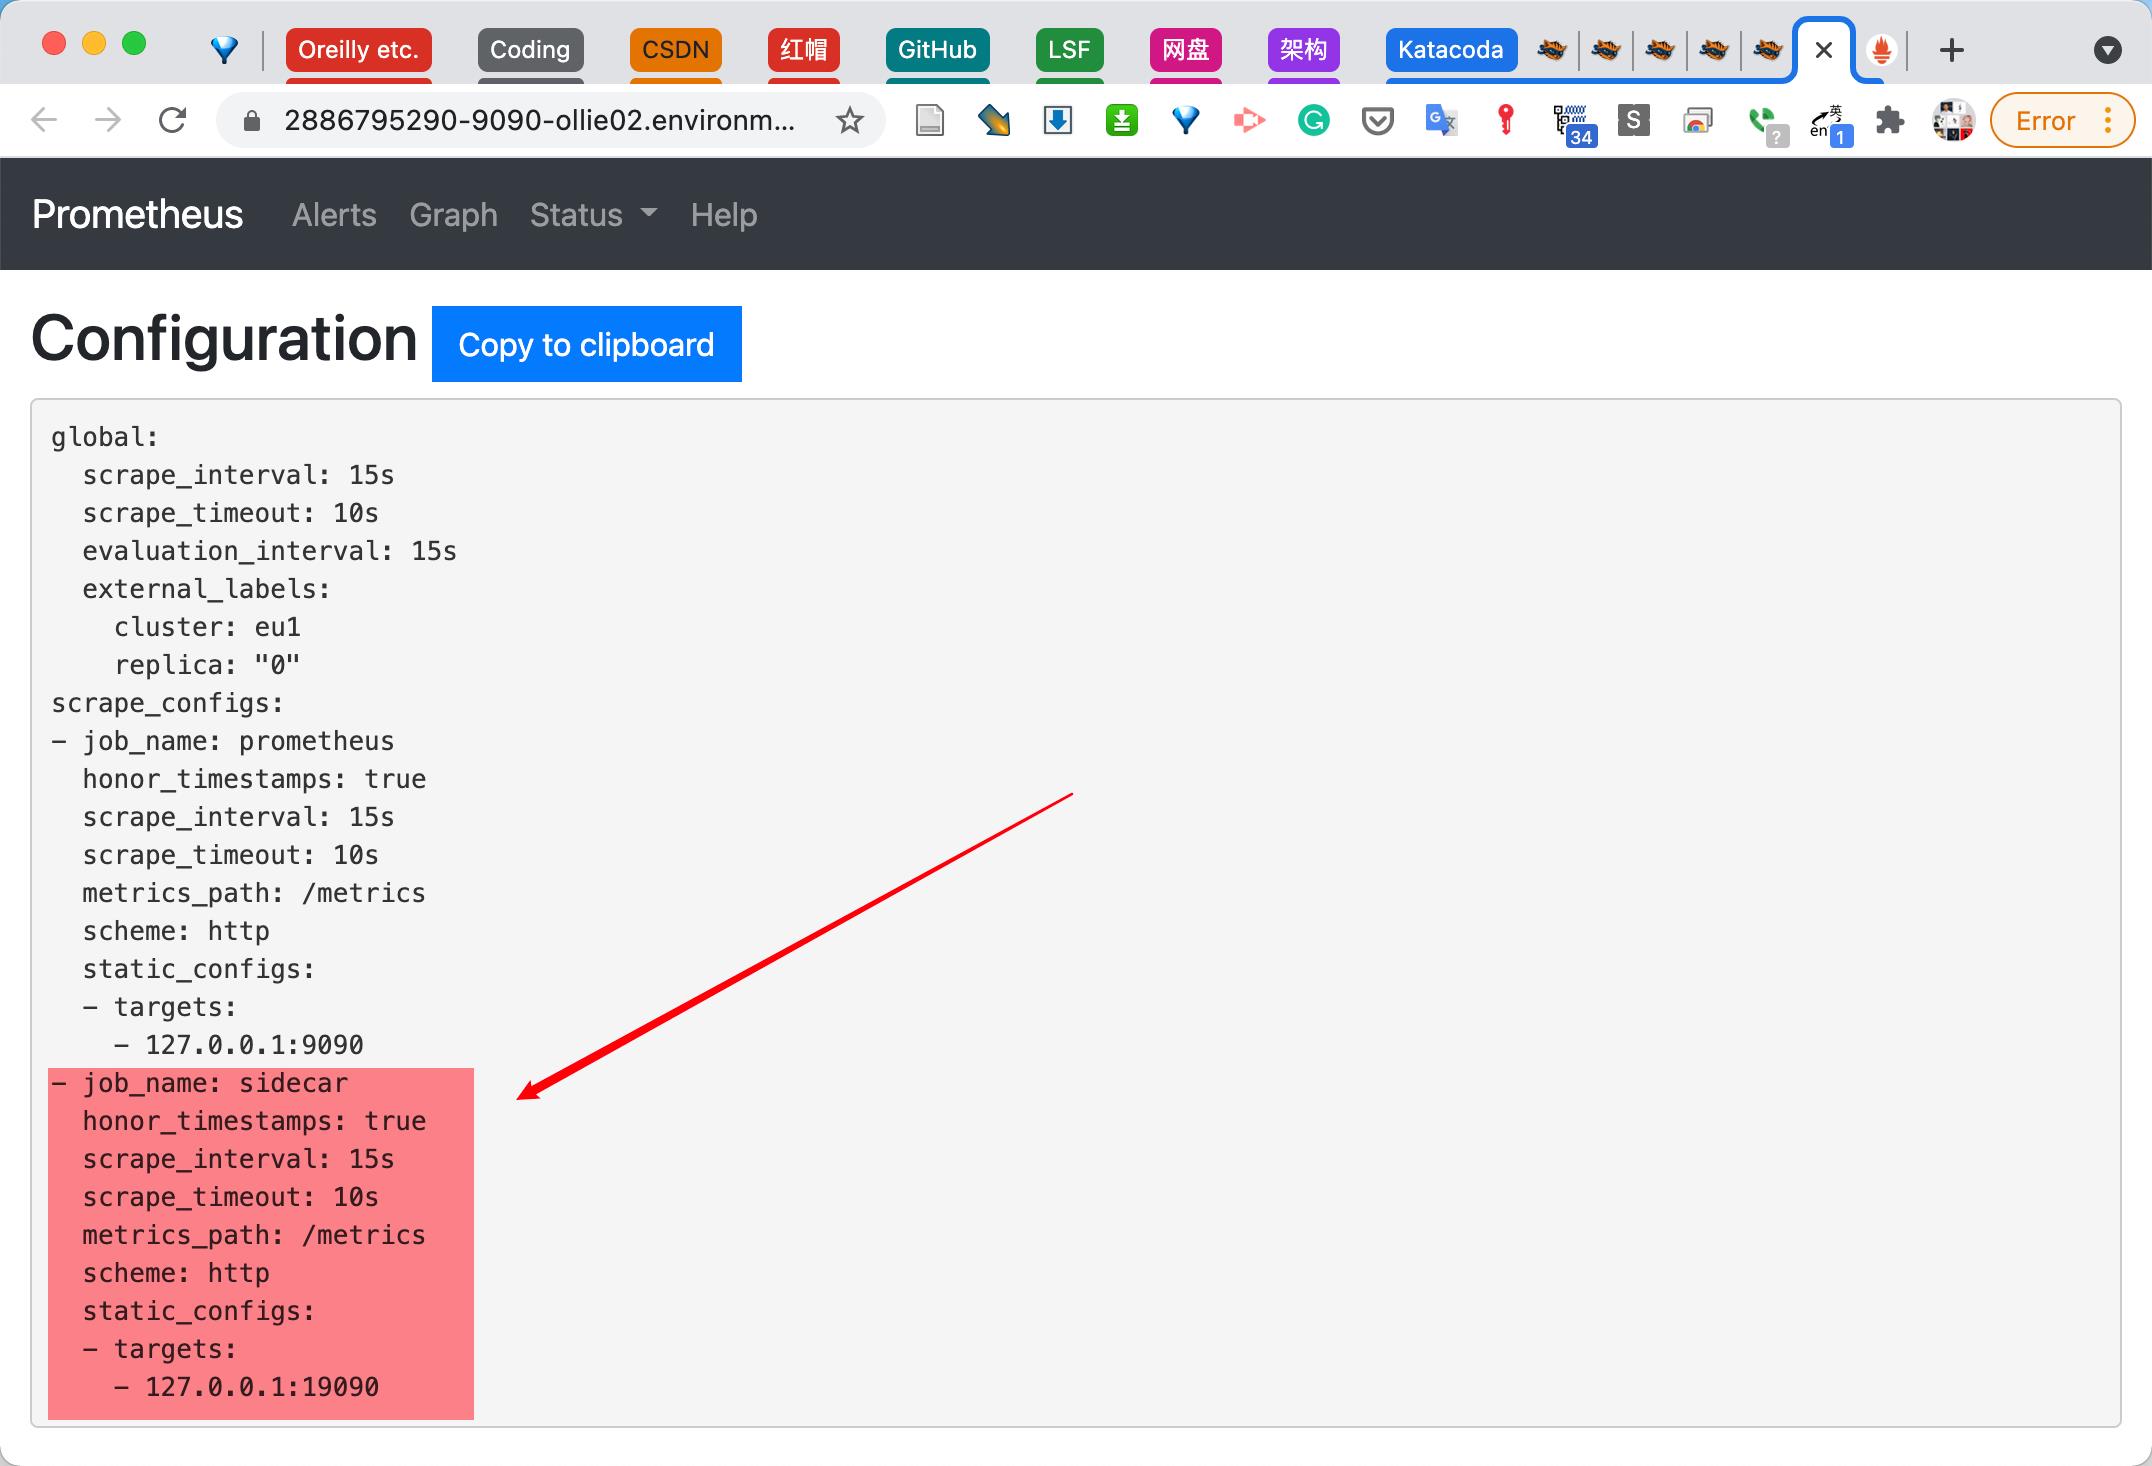
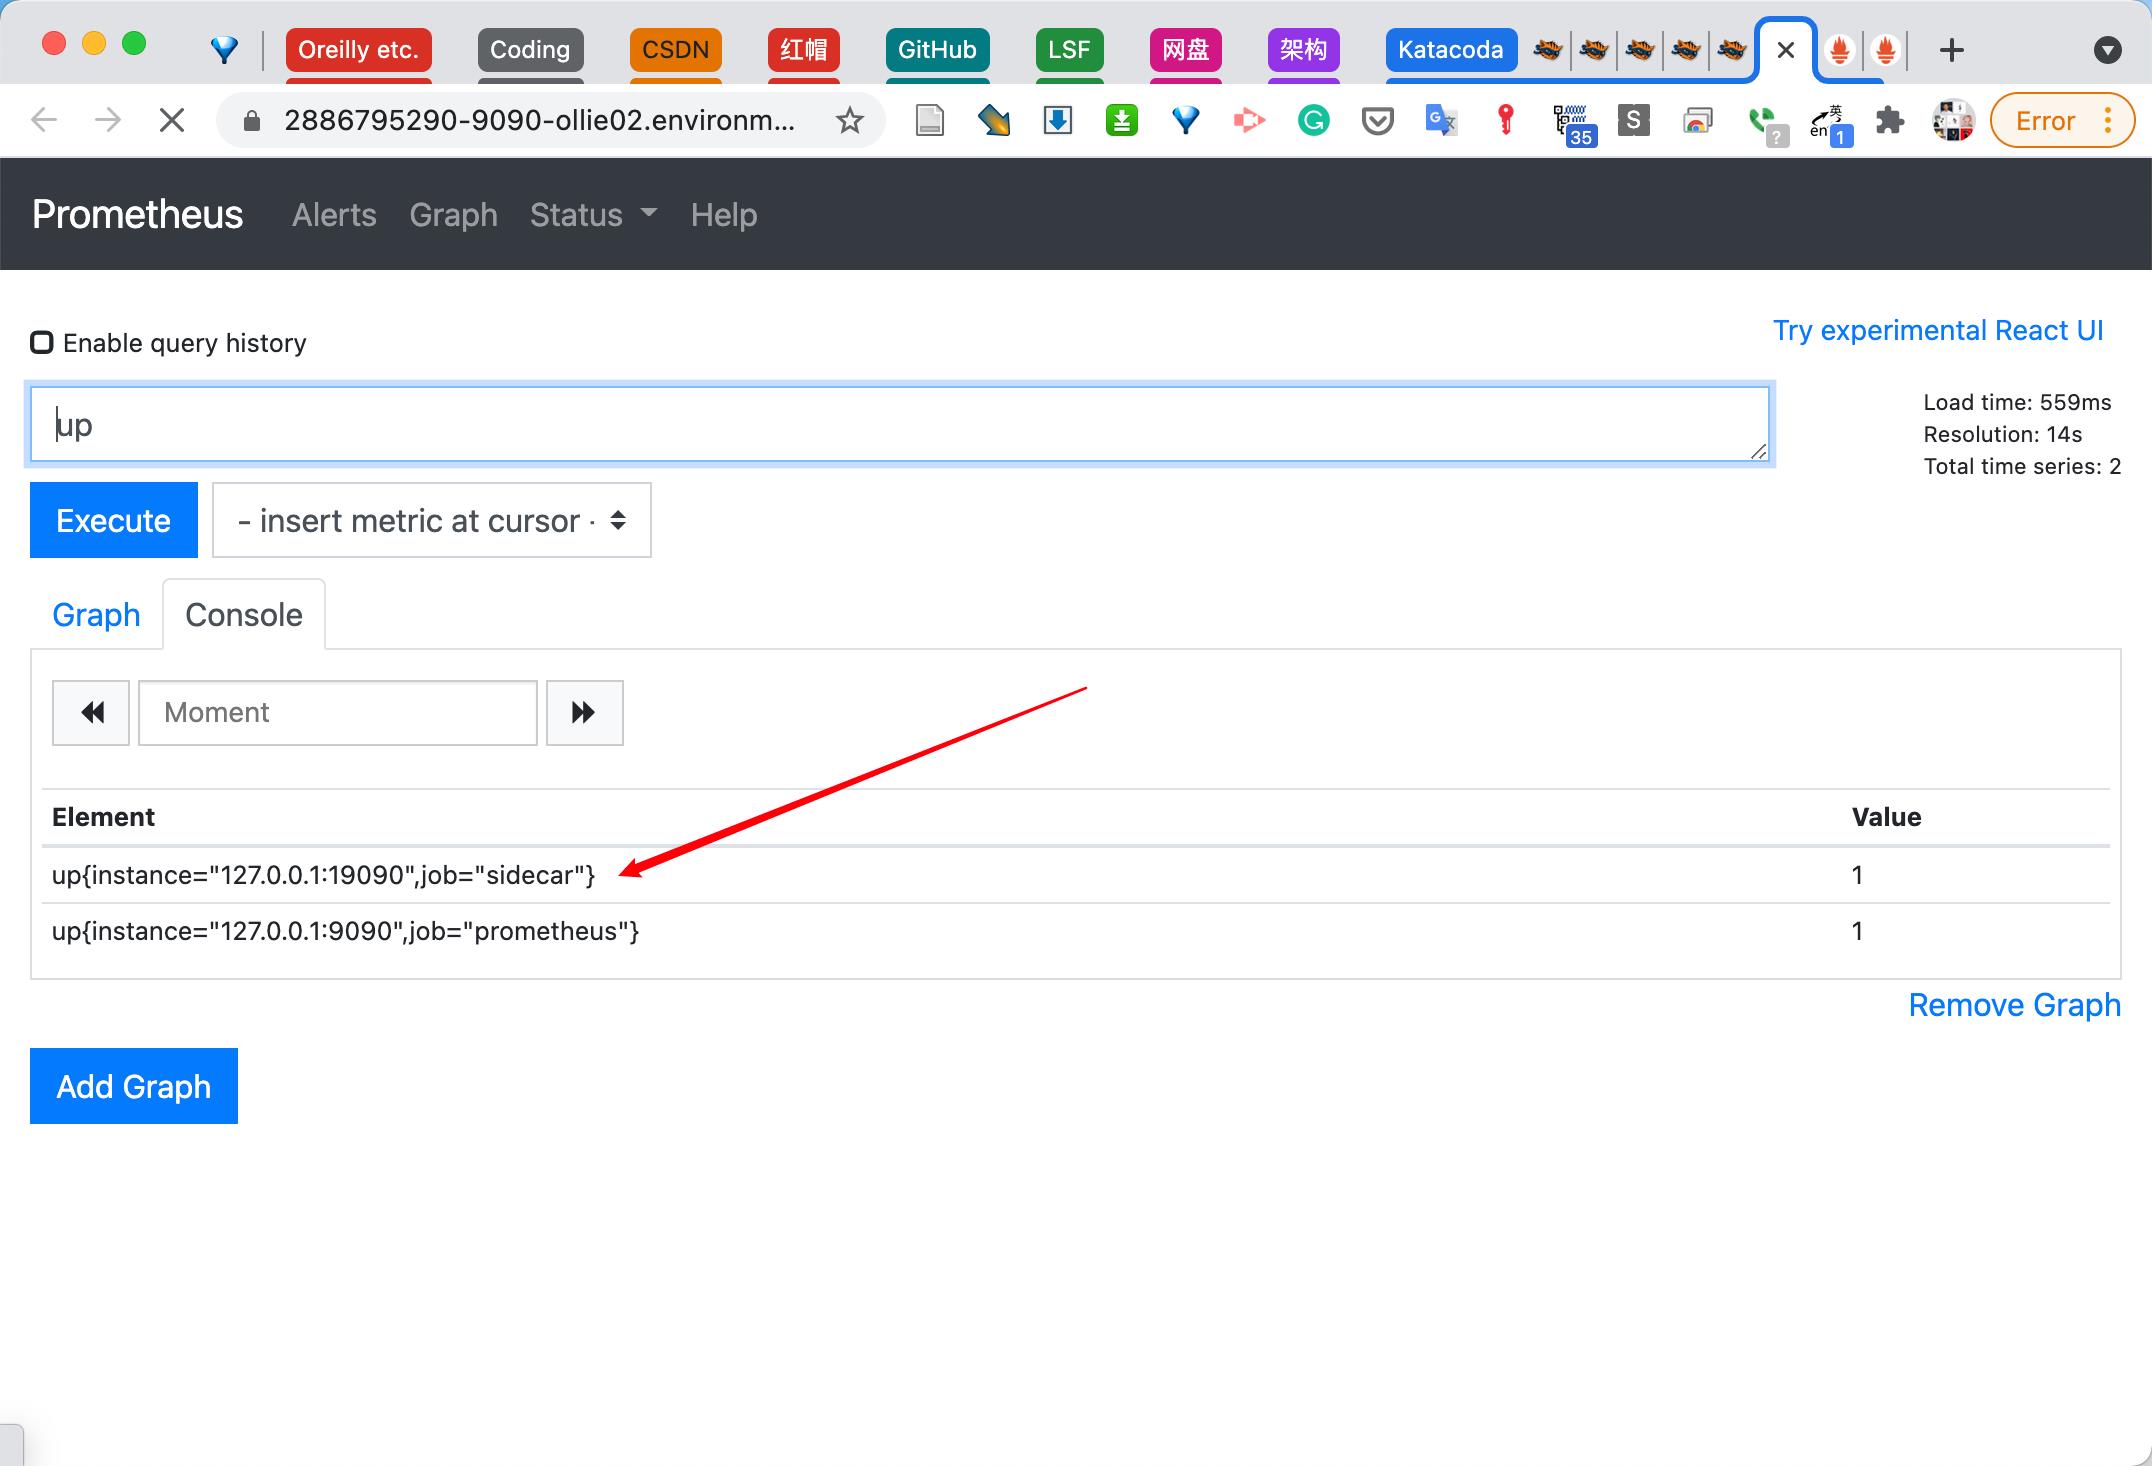
验证,我们可以通过修改配置文件,来看Prometheus是否会自动reload
[root@host01 ~]# for i in `ls *.yml`; do echo '#' cat $i; cat $i; done
# cat prometheus0_eu1.yml
global:
  scrape_interval: 15s
  evaluation_interval: 15s
  external_labels:
    cluster: eu1
    replica: 0

scrape_configs:
  - job_name: 'prometheus'
    static_configs:
      - targets: ['127.0.0.1:9090']
  - job_name: 'sidecar'
    static_configs:
      - targets: ['127.0.0.1:19090']
# cat prometheus0_us1.yml
global:
  scrape_interval: 15s
  evaluation_interval: 15s
  external_labels:
    cluster: us1
    replica: 0

scrape_configs:
  - job_name: 'prometheus'
    static_configs:
      - targets: ['127.0.0.1:9091','127.0.0.1:9092']
  - job_name: 'sidecar'
    static_configs:
      - targets: ['127.0.0.1:19091','127.0.0.1:19092']
# cat prometheus1_us1.yml
global:
  scrape_interval: 15s
  evaluation_interval: 15s
  external_labels:
    cluster: us1
    replica: 1

scrape_configs:
  - job_name: 'prometheus'
    static_configs:
      - targets: ['127.0.0.1:9091','127.0.0.1:9092']
  - job_name: 'sidecar'
    static_configs:
      - targets: ['127.0.0.1:19091','127.0.0.1:19092']
[root@host01 ~]#
观察其中一个实例的web
3.添加Thanos Querier
前面的步骤我们有了3个Prometheus + Thanos Sidecar实例。本步骤我们将安装一个Thanos Querier,从一个地方通过所有的sidecars进行查询所有的metrics。如下图
[root@host01 ~]# docker run -d --net=host --rm \\
>     --name querier \\
>     quay.io/thanos/thanos:v0.20.0 \\
>     query \\
>     --http-address 0.0.0.0:29090 \\
>     --query.replica-label replica \\
>     --store 127.0.0.1:19190 \\
>     --store 127.0.0.1:19191 \\
>     --store 127.0.0.1:19192 && echo "Started Thanos Querier"
1d2b5bd0825533324f272750b664e7704f4cf984249104ce2e5ab27c93a7b20f
Started Thanos Querier
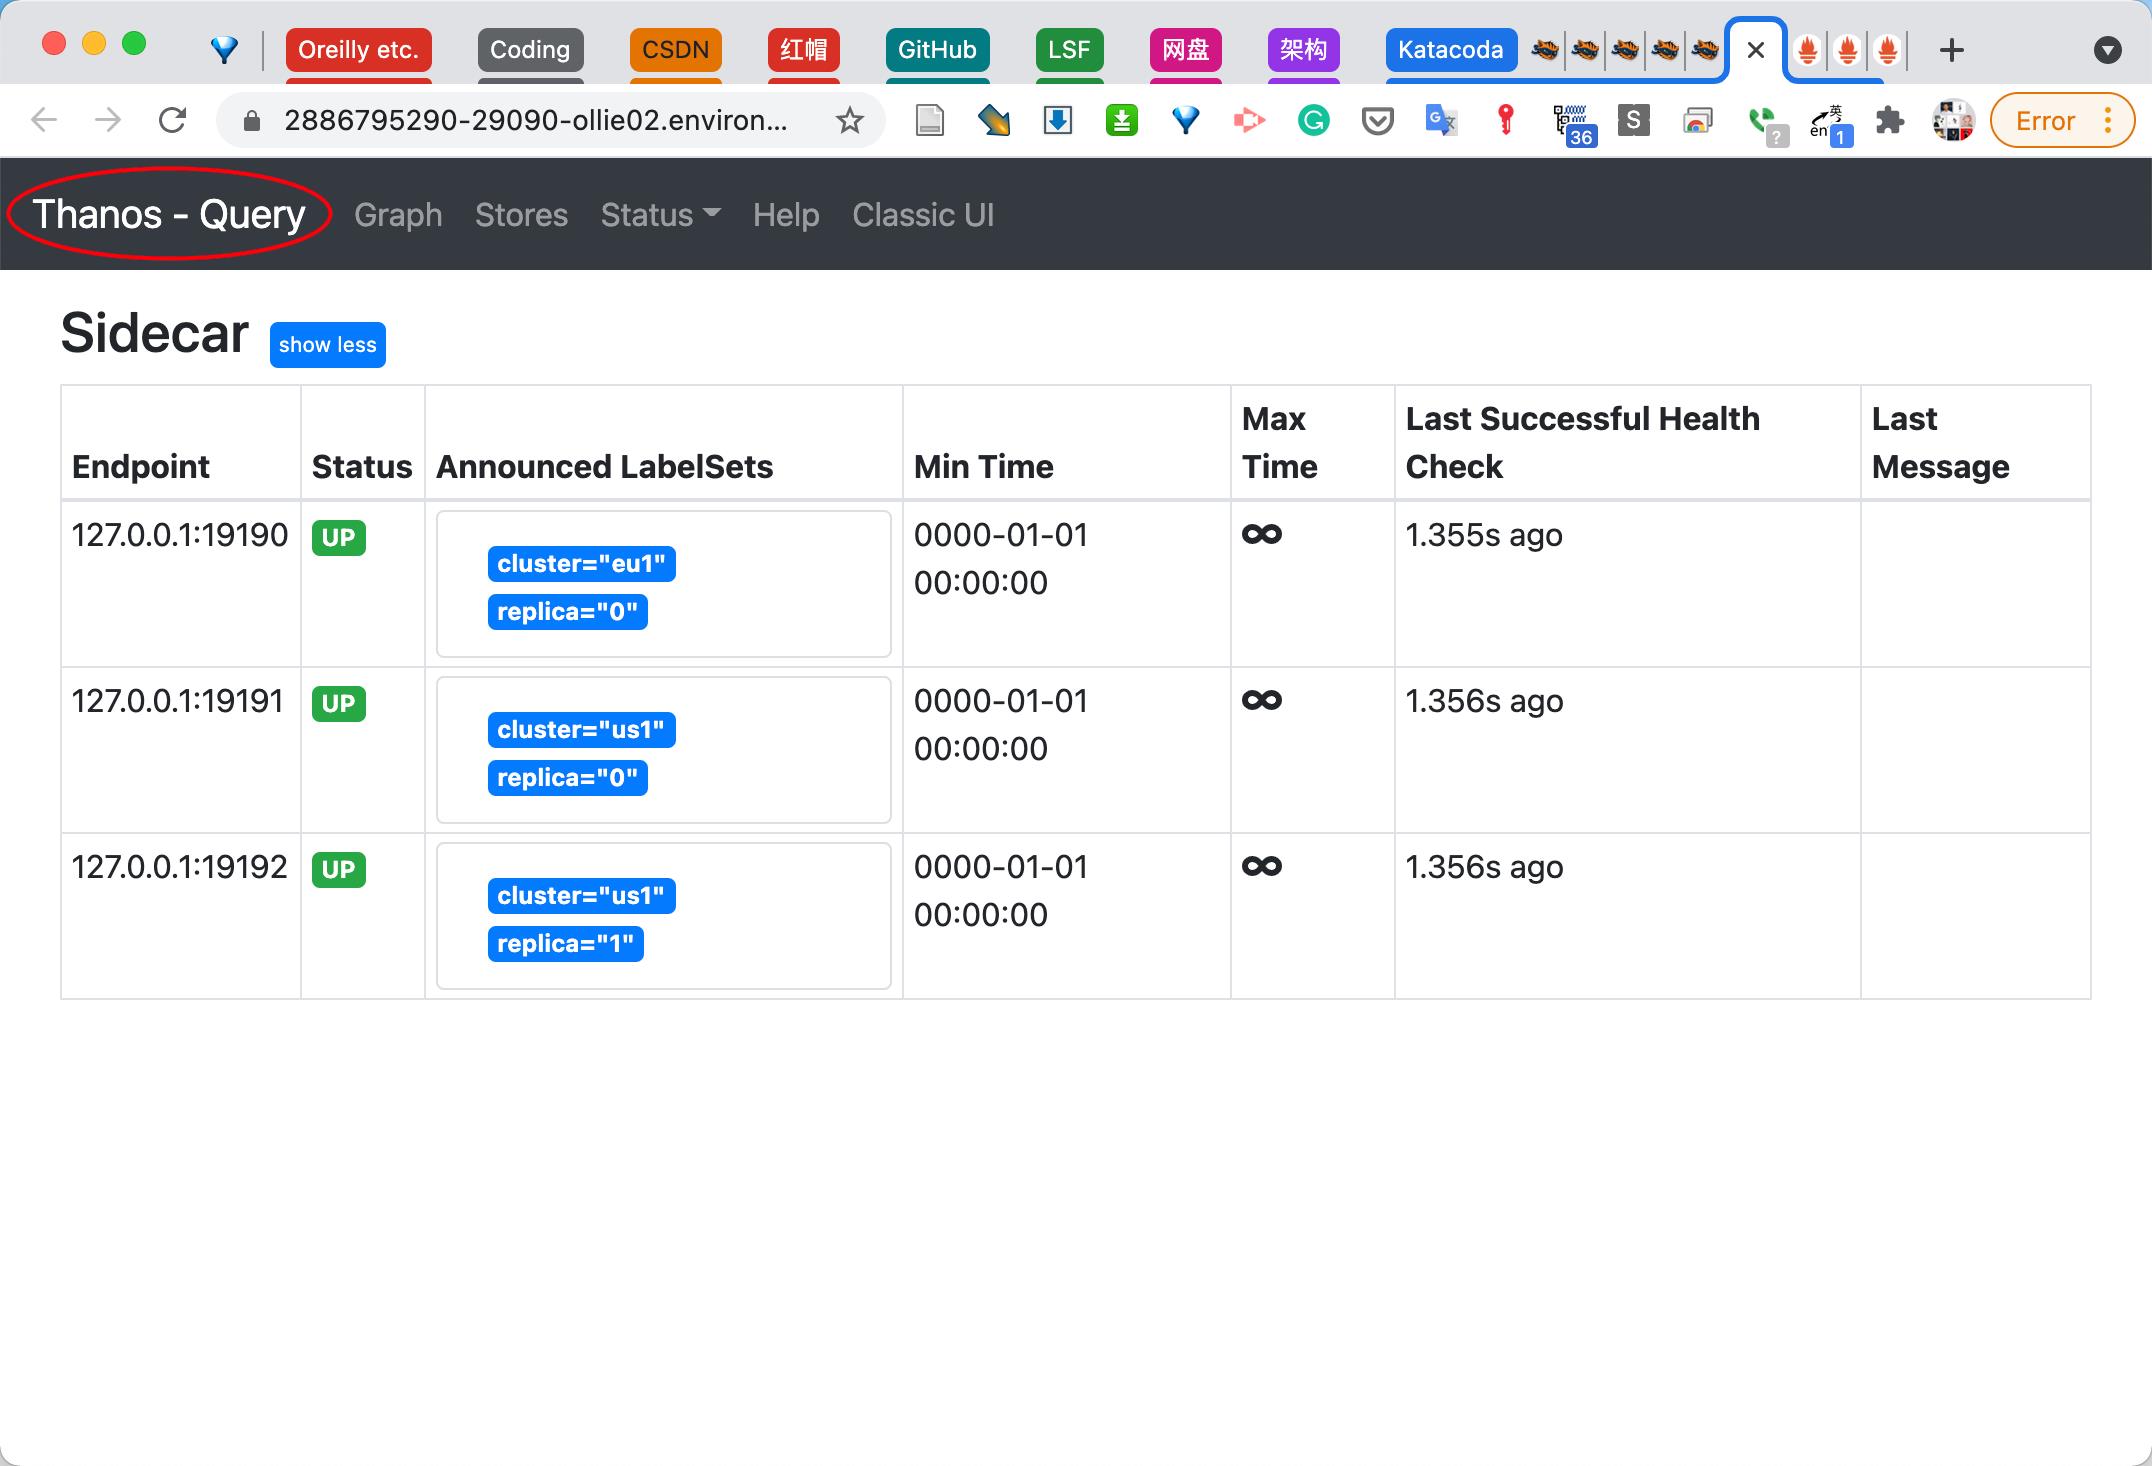
查看Thanos Querier网页
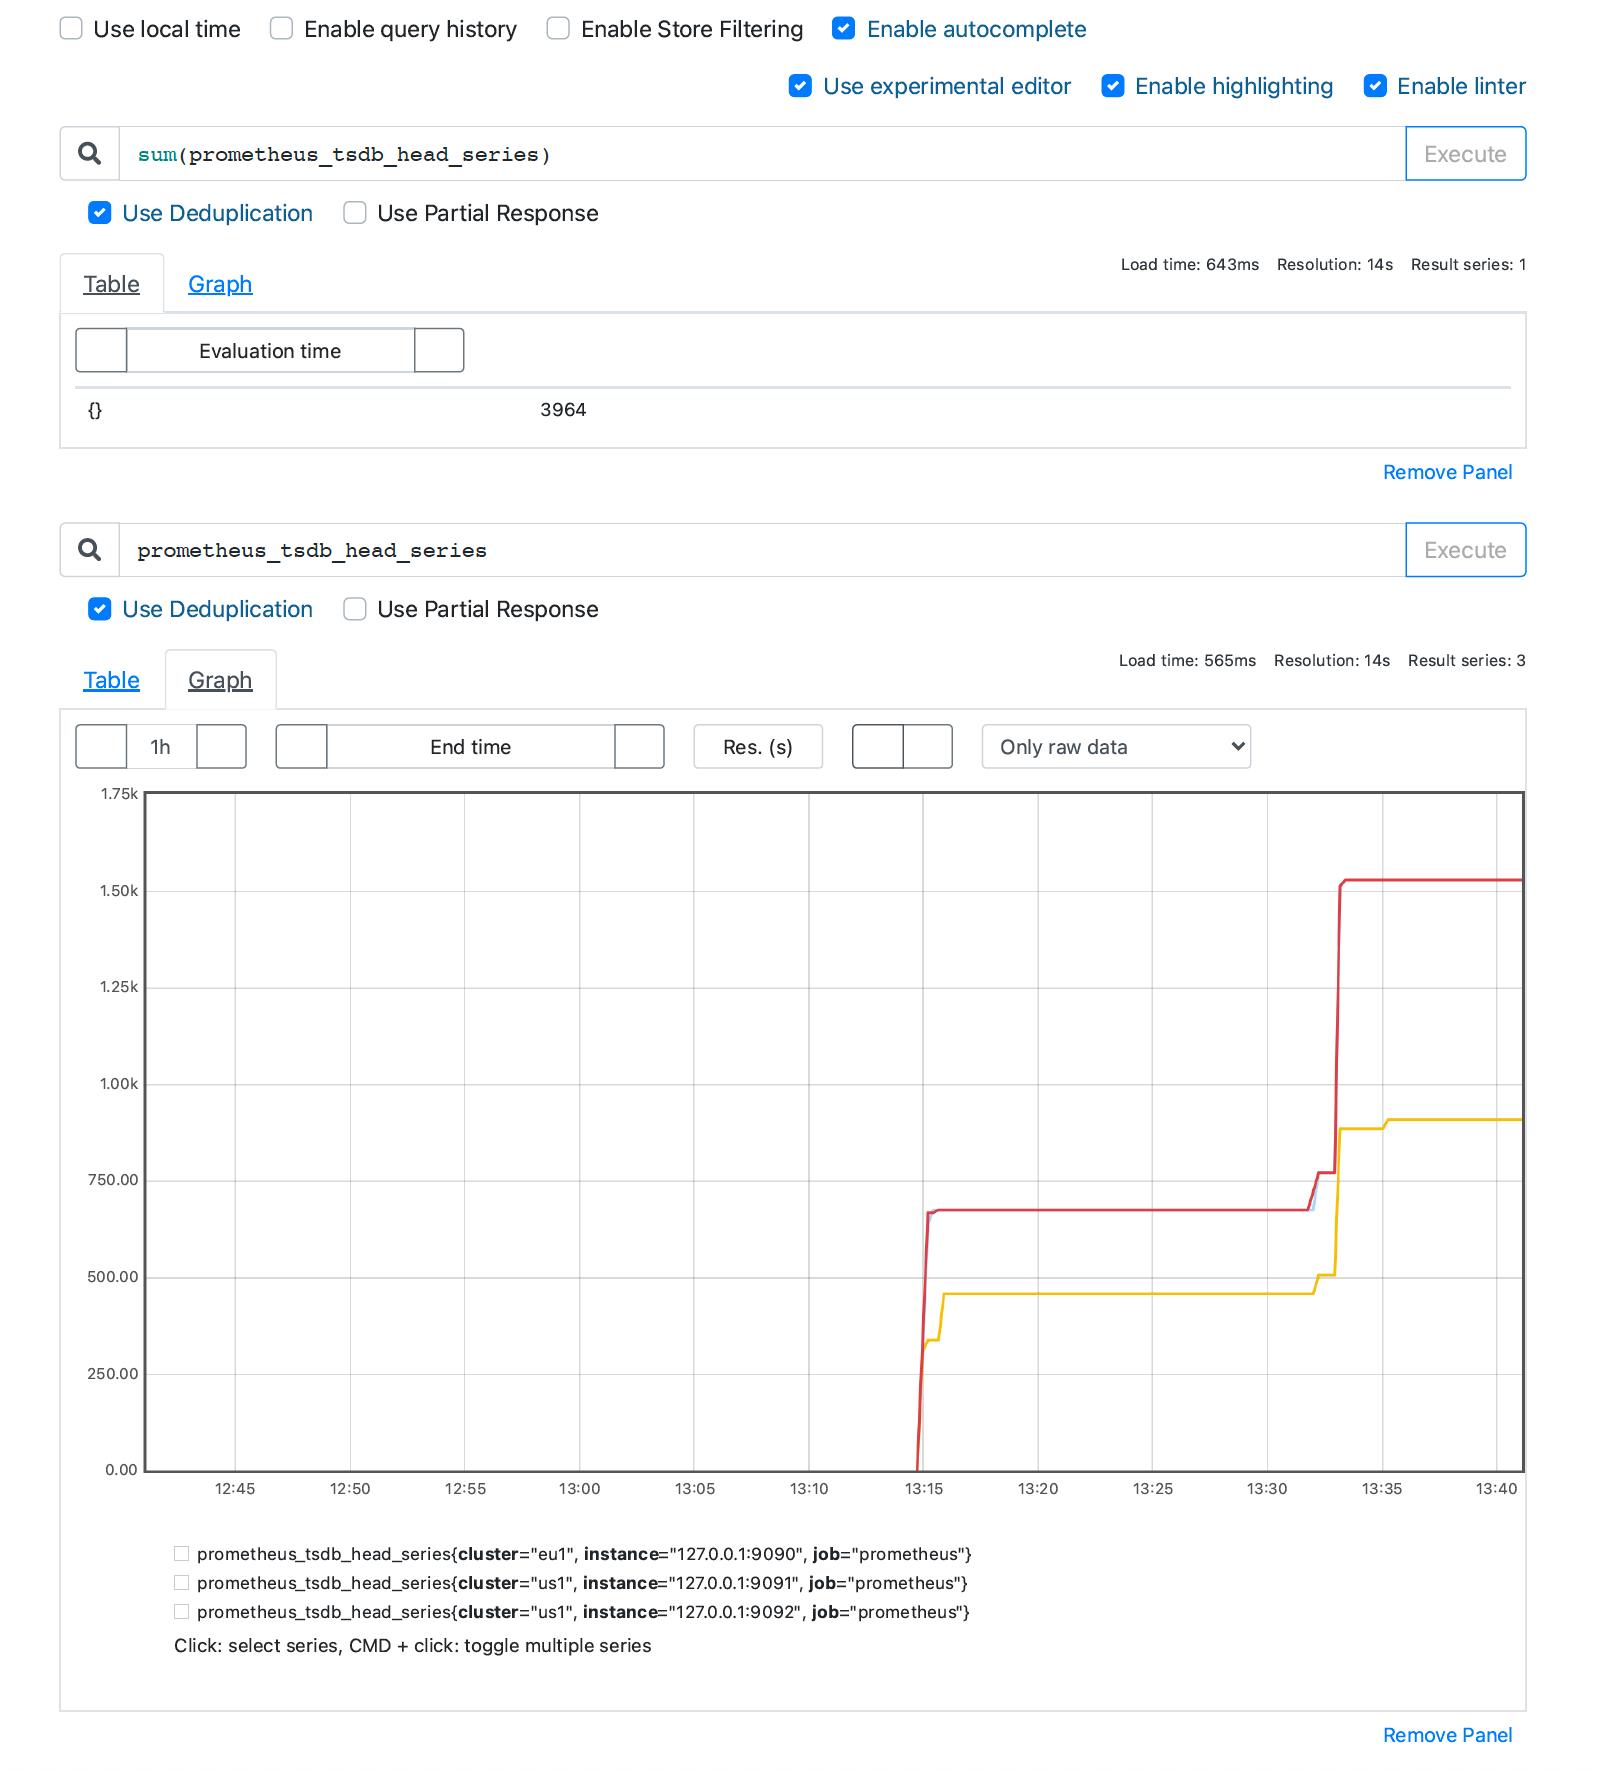
 查看sum(prometheus_tsdb_head_series)与prometheus_tsdb_head_series,可以看到是(对副本进行)去重了的。
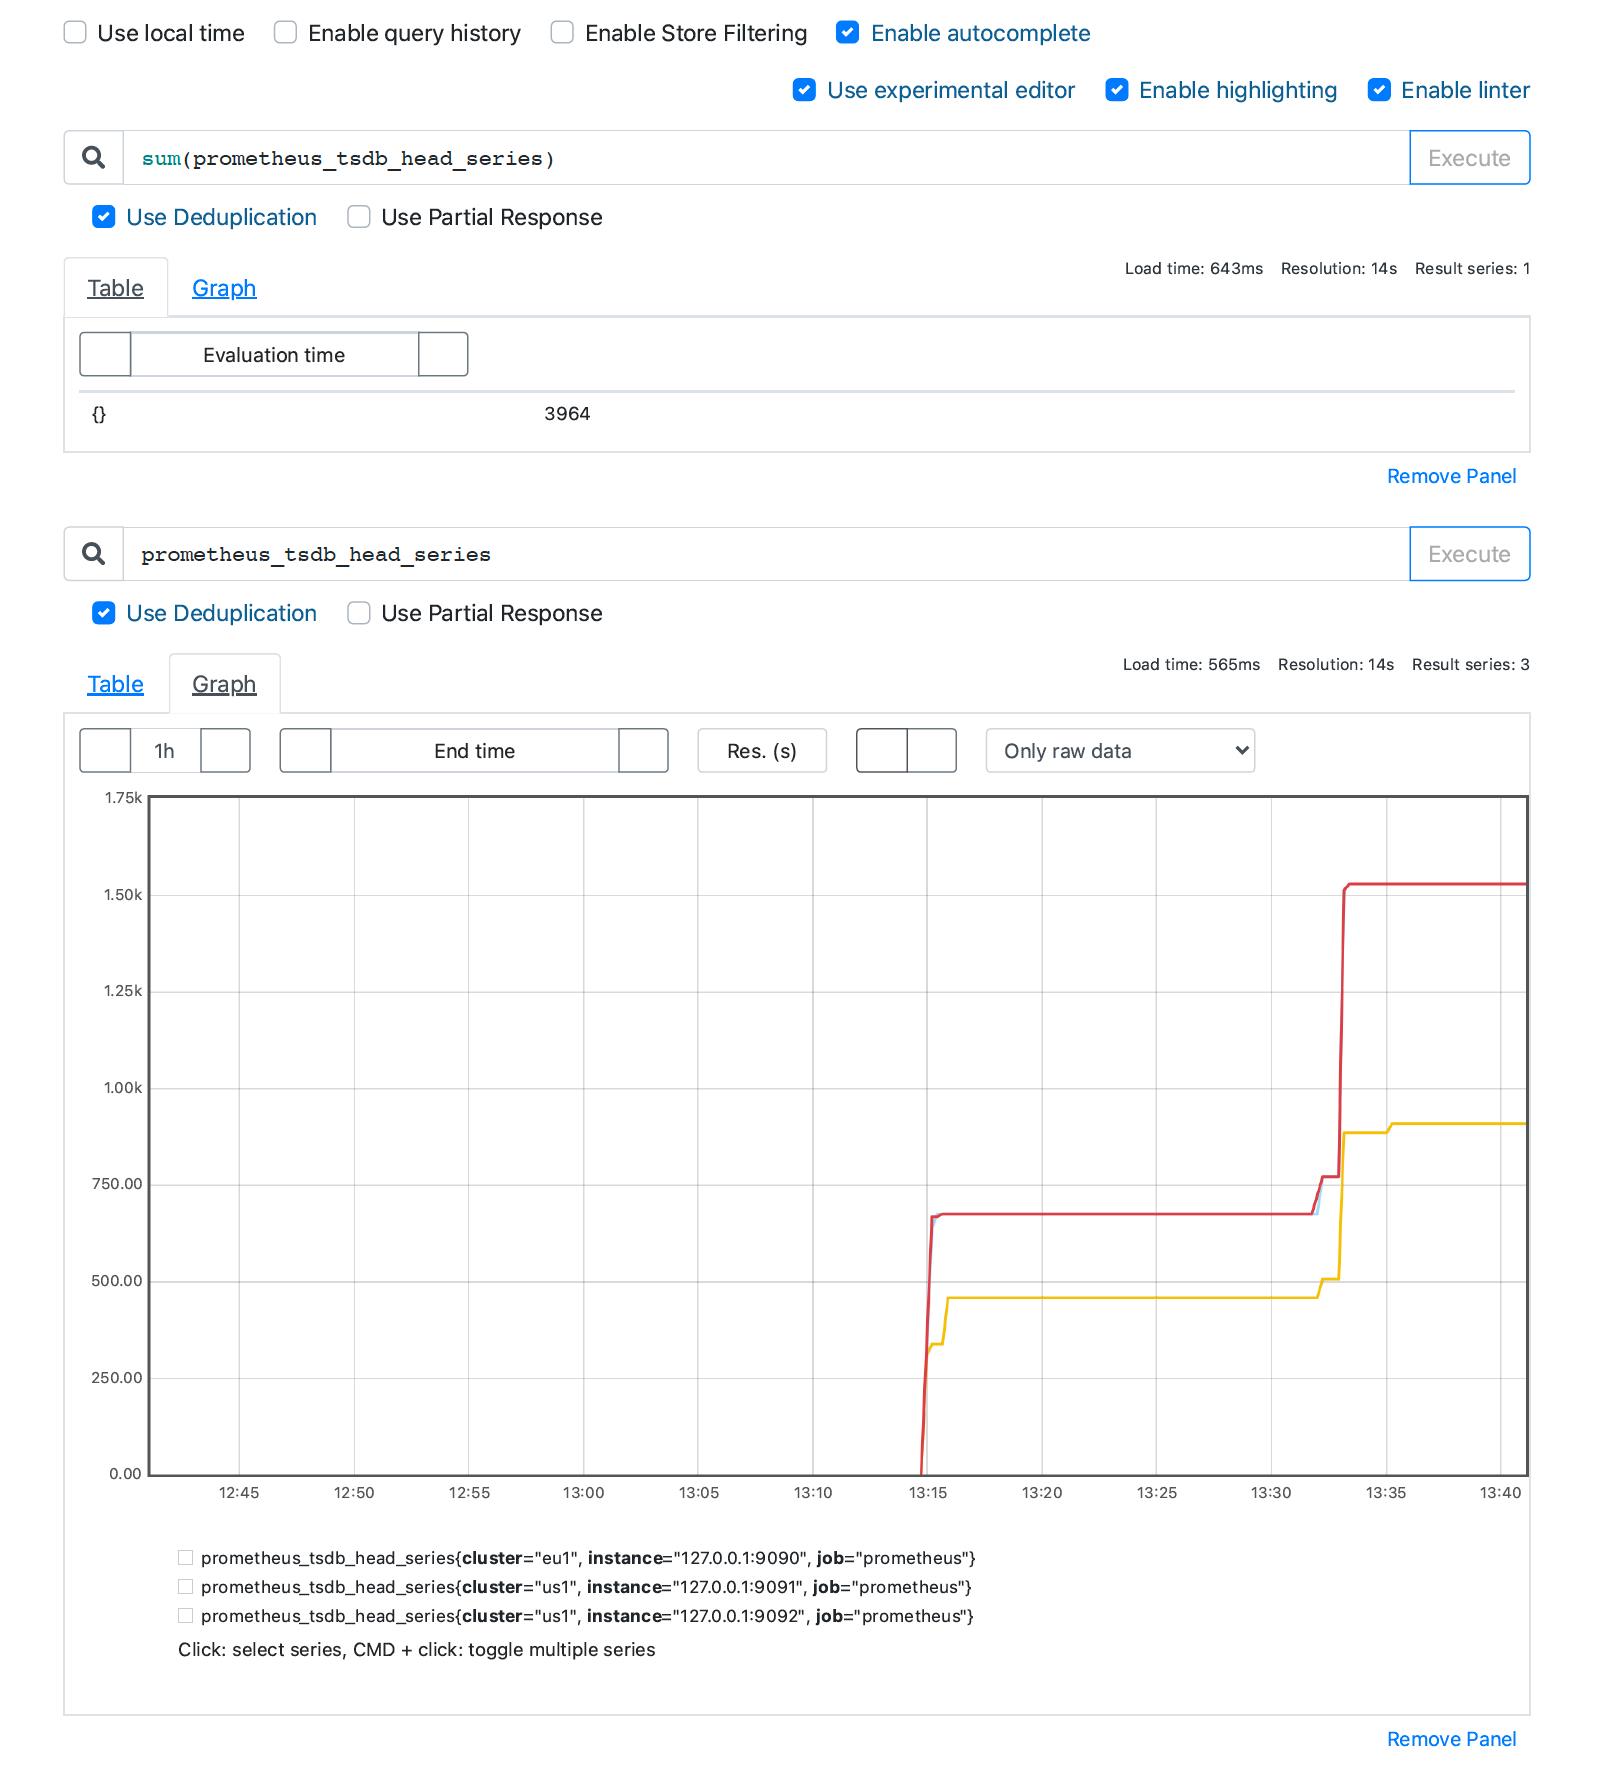 我们将Use Deduplication勾选去掉,可以看到未去重的数据
 去重是根据Global Label来去重的,还记得我们上面的配置文件如何编写的吗?
[root@host01 ~]# cat prometheus0_us1.yml | grep -A 2 external_labels
  external_labels:
    cluster: us1
    replica: 0
[root@host01 ~]# cat prometheus1_us1.yml | grep -A 2 external_labels
  external_labels:
    cluster: us1
    replica: 1
总结
以上就是Thanos与Prometheus的配合——Thanos Sidecar与Prometheus服务器配合部署,Thanos Querier(连接所有Sidecar)进行单点查询。非常有用!
以上是关于监控 - Prometheus+Thanos的全局视图与无缝高可用的主要内容,如果未能解决你的问题,请参考以下文章