手把手教你做出数据可视化项目页面布局
Posted diviner_s
tags:
篇首语:本文由小常识网(cha138.com)小编为大家整理,主要介绍了手把手教你做出数据可视化项目页面布局相关的知识,希望对你有一定的参考价值。
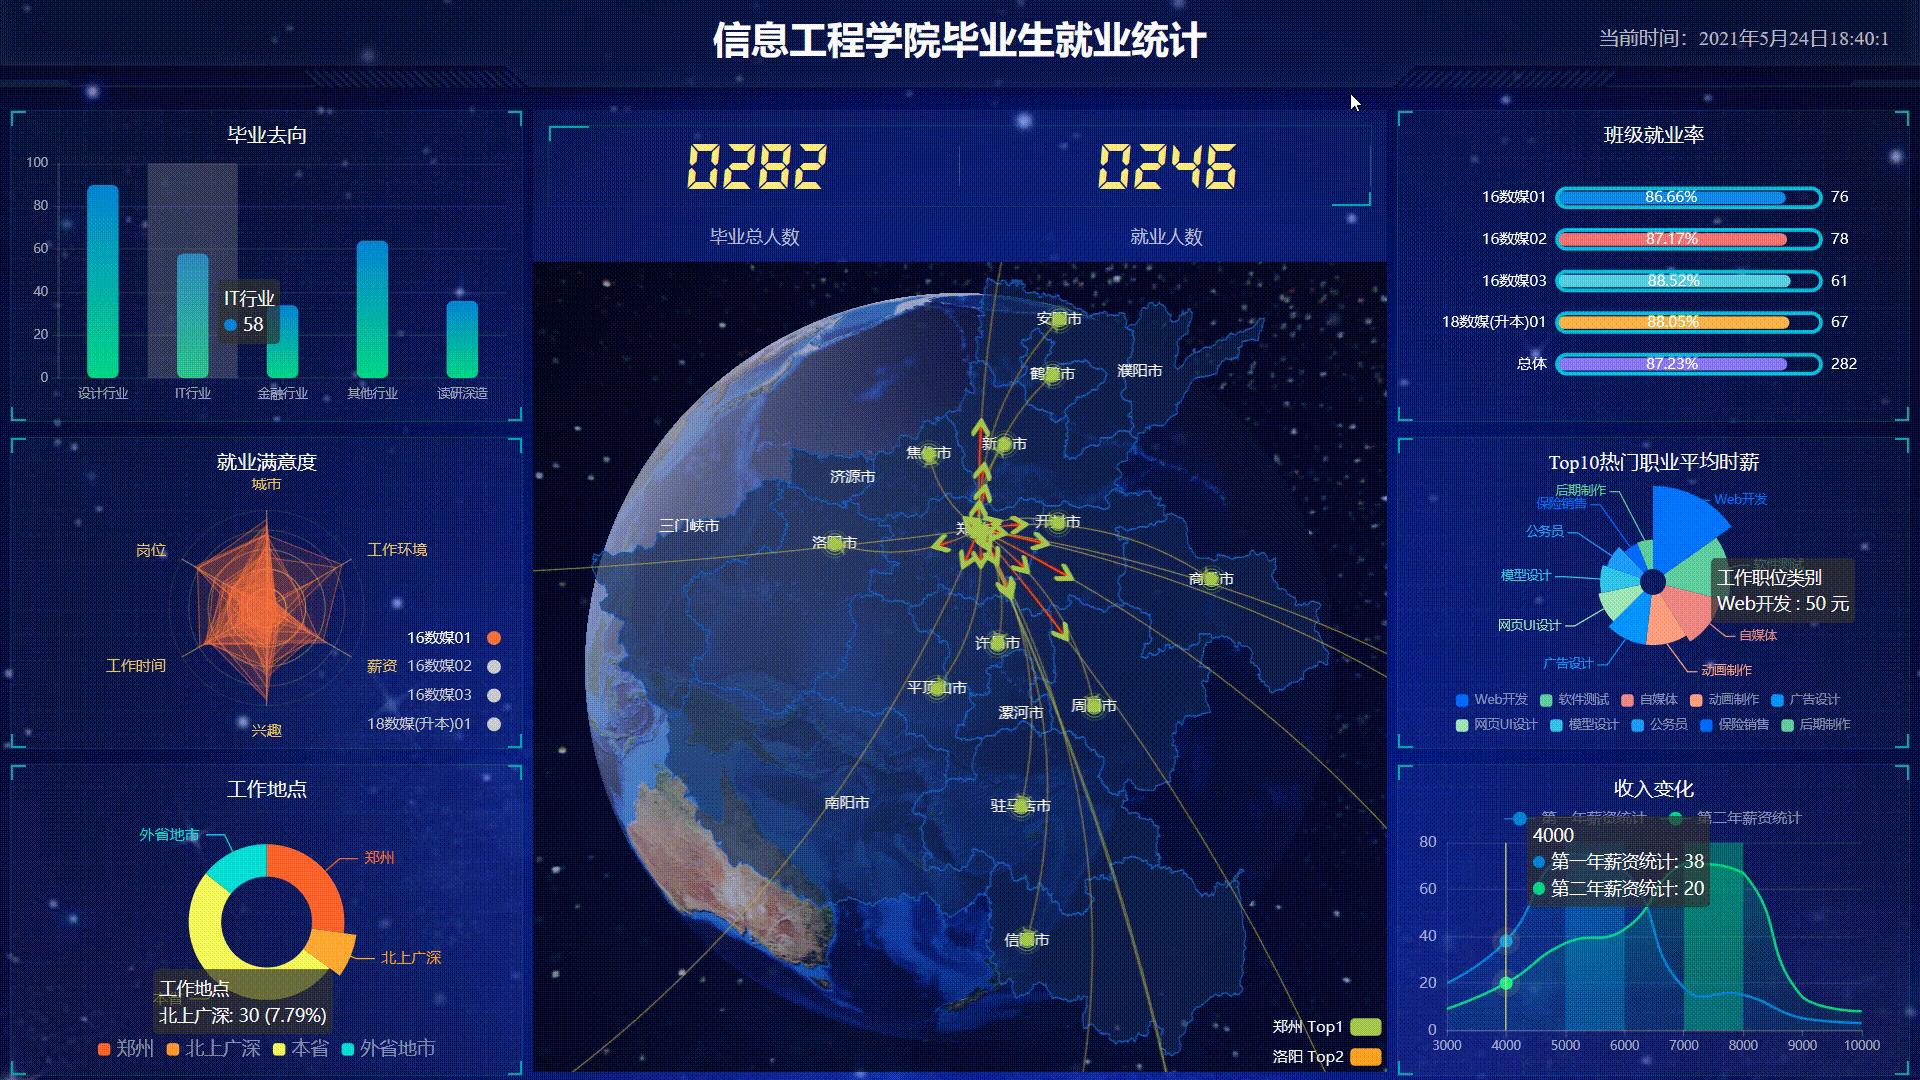
项目最终效果图:
此篇博客为自己学习pink老师的课后完成的项目的总结与记录,仅供交流参考。版权所有,转载请标注原作者!
使用echarts技术做的可视图,此外其项目包含 的技术有html、css、js、jquerry、ajax、websocket、koa等。
此项目将前后端分离。
界面布局
界面采用css3的Flex布局
为了使代码更为整洁,我们将布局全部放在css中。
在index.html中引用index.css文件

基础设置body
- 在css中background属性设置背景图
- line-height属性表示行高,设置为1.15
- 溢出隐藏
overflow:hidden

header布局
- 布局格式设置为相对位置
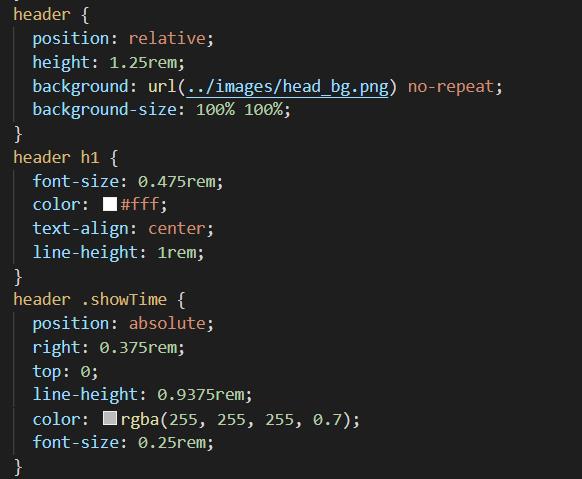
- 高度为100px
- 背景图,在容器内显示
- 缩放比例为 100%
- h1 标题部分 白色 38像素 居中显示 行高为 80像素
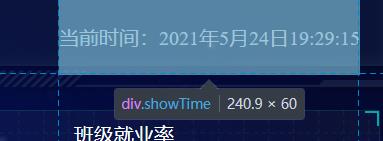
- 时间模块 showTime 定位右侧 right 为 30px 行高为 75px 文字颜色为:rgba(255, 255, 255, 0.7) 而文字大小为 20像素
得到图为所示:


获取当前时间代码:
<script>
      var t = null;
      t = setTimeout(time, 1000); //开始运行
      function time() {
        clearTimeout(t); //清除定时器
        dt = new Date();
        var y = dt.getFullYear();
        var mt = dt.getMonth() + 1;
        var day = dt.getDate();
        var h = dt.getHours(); //获取时
        var m = dt.getMinutes(); //获取分
        var s = dt.getSeconds(); //获取秒
        document.querySelector(".showTime").innerHTML =
          "当前时间:" + y + "年" + mt + "月" + day + "日" + h + ":" + m + ":" + s;
        t = setTimeout(time, 1000); //设定定时器,循环运行
      }
</script>
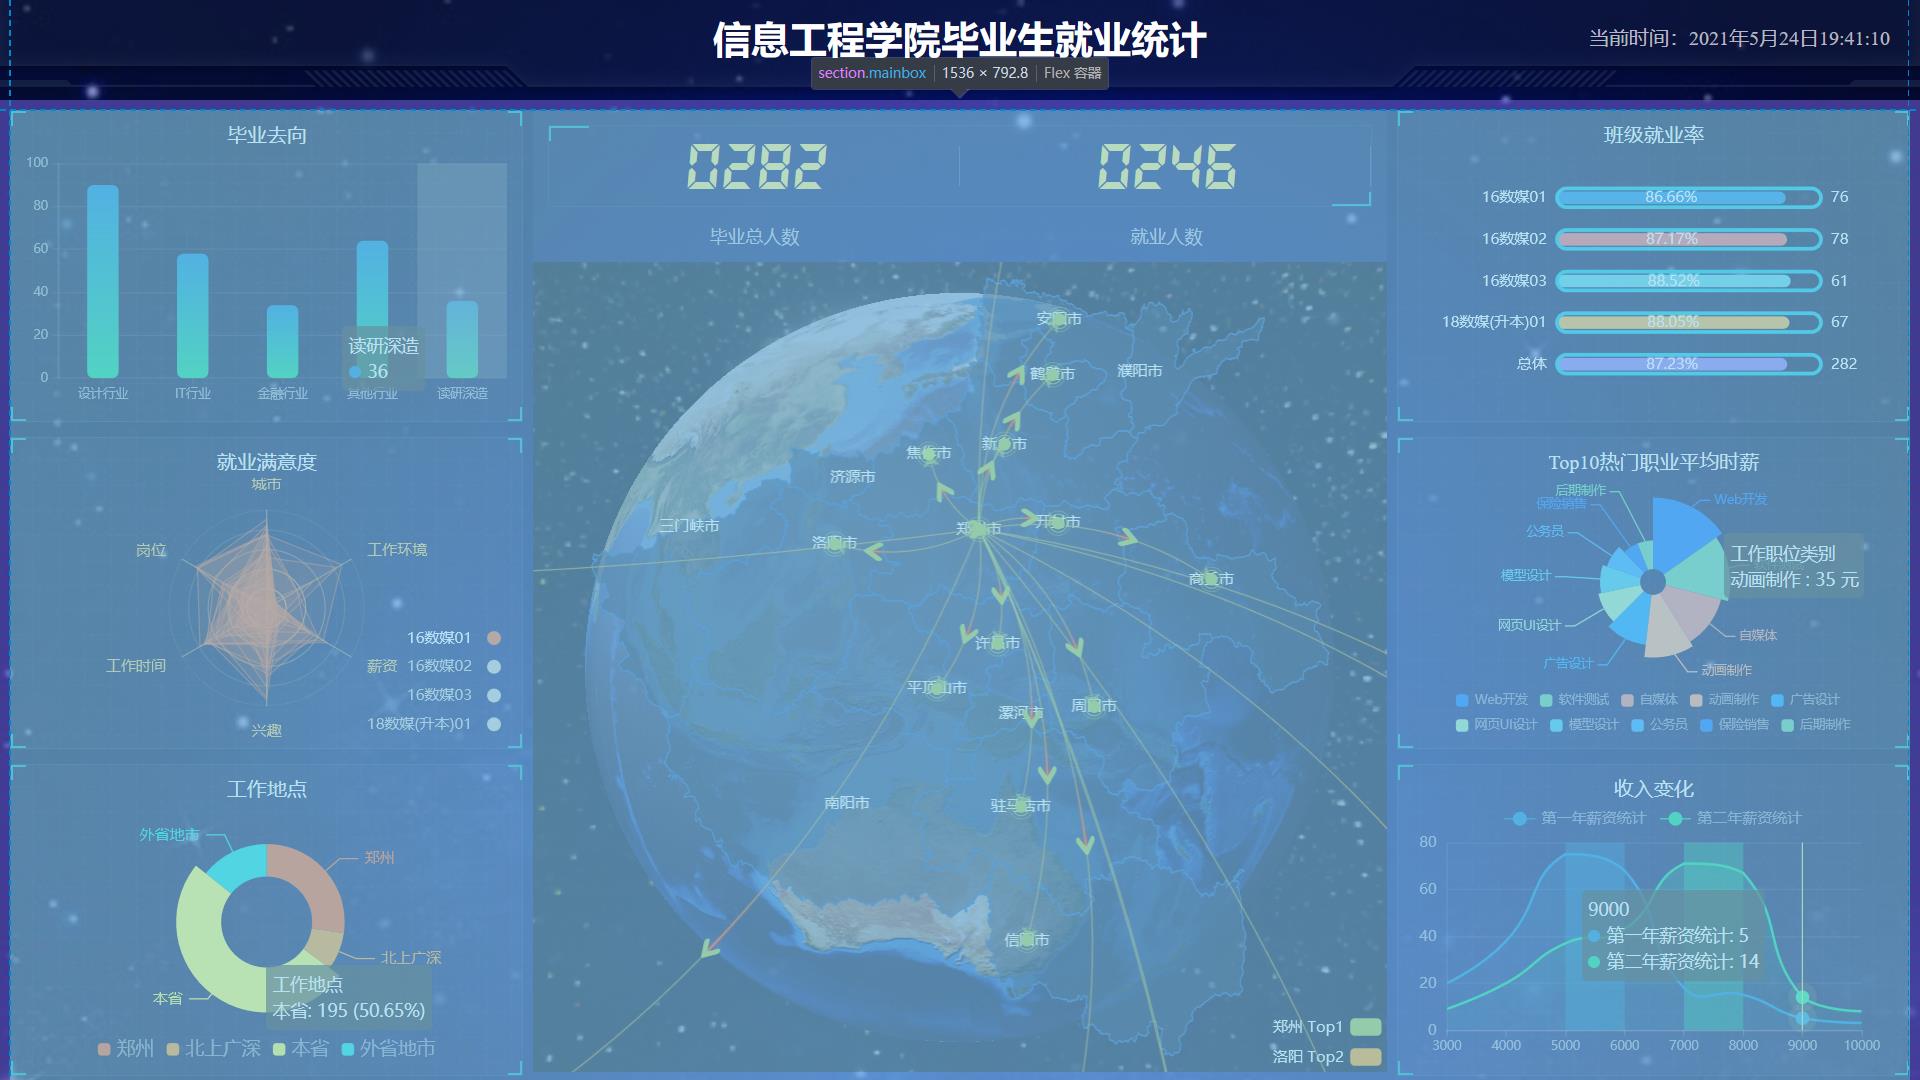
mainbox 主题设置
-
设置一个内边距距上下左右10px
-
column列容器,分为三列:占比:3:5:3
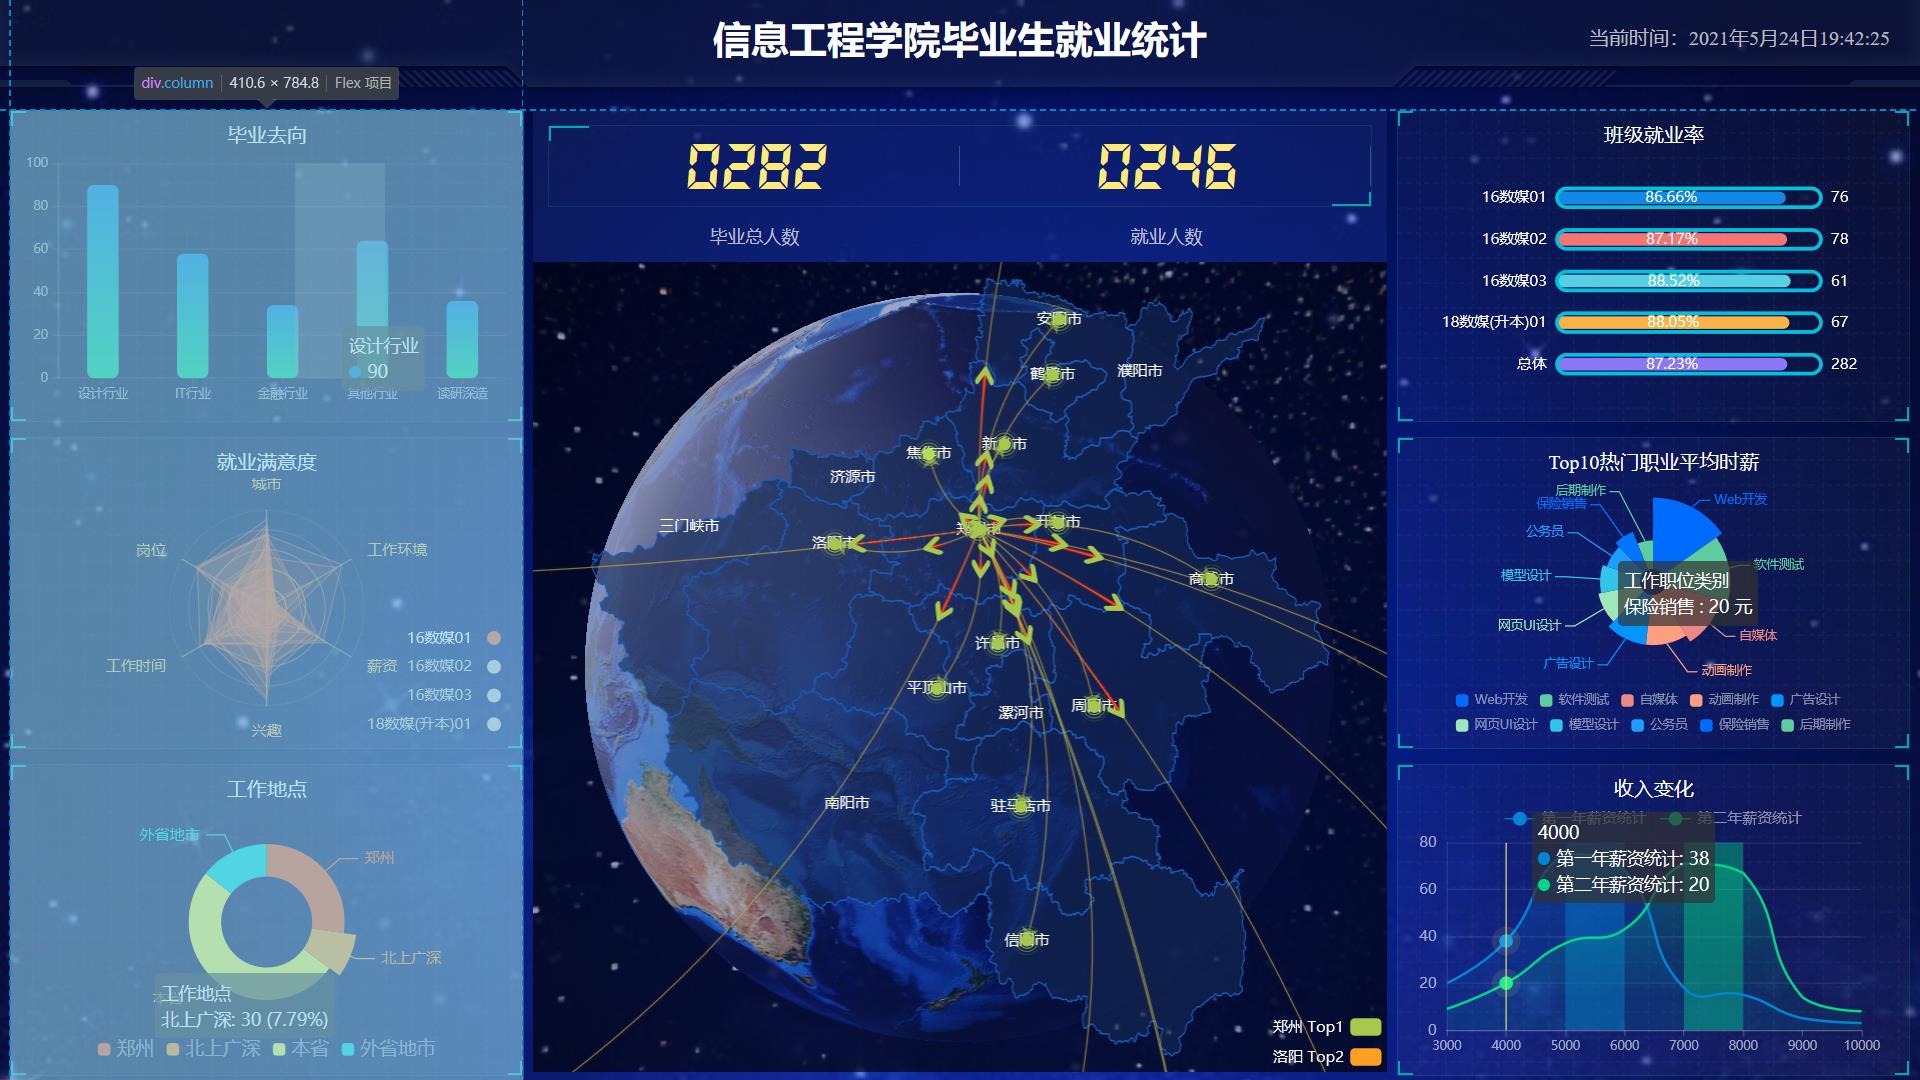
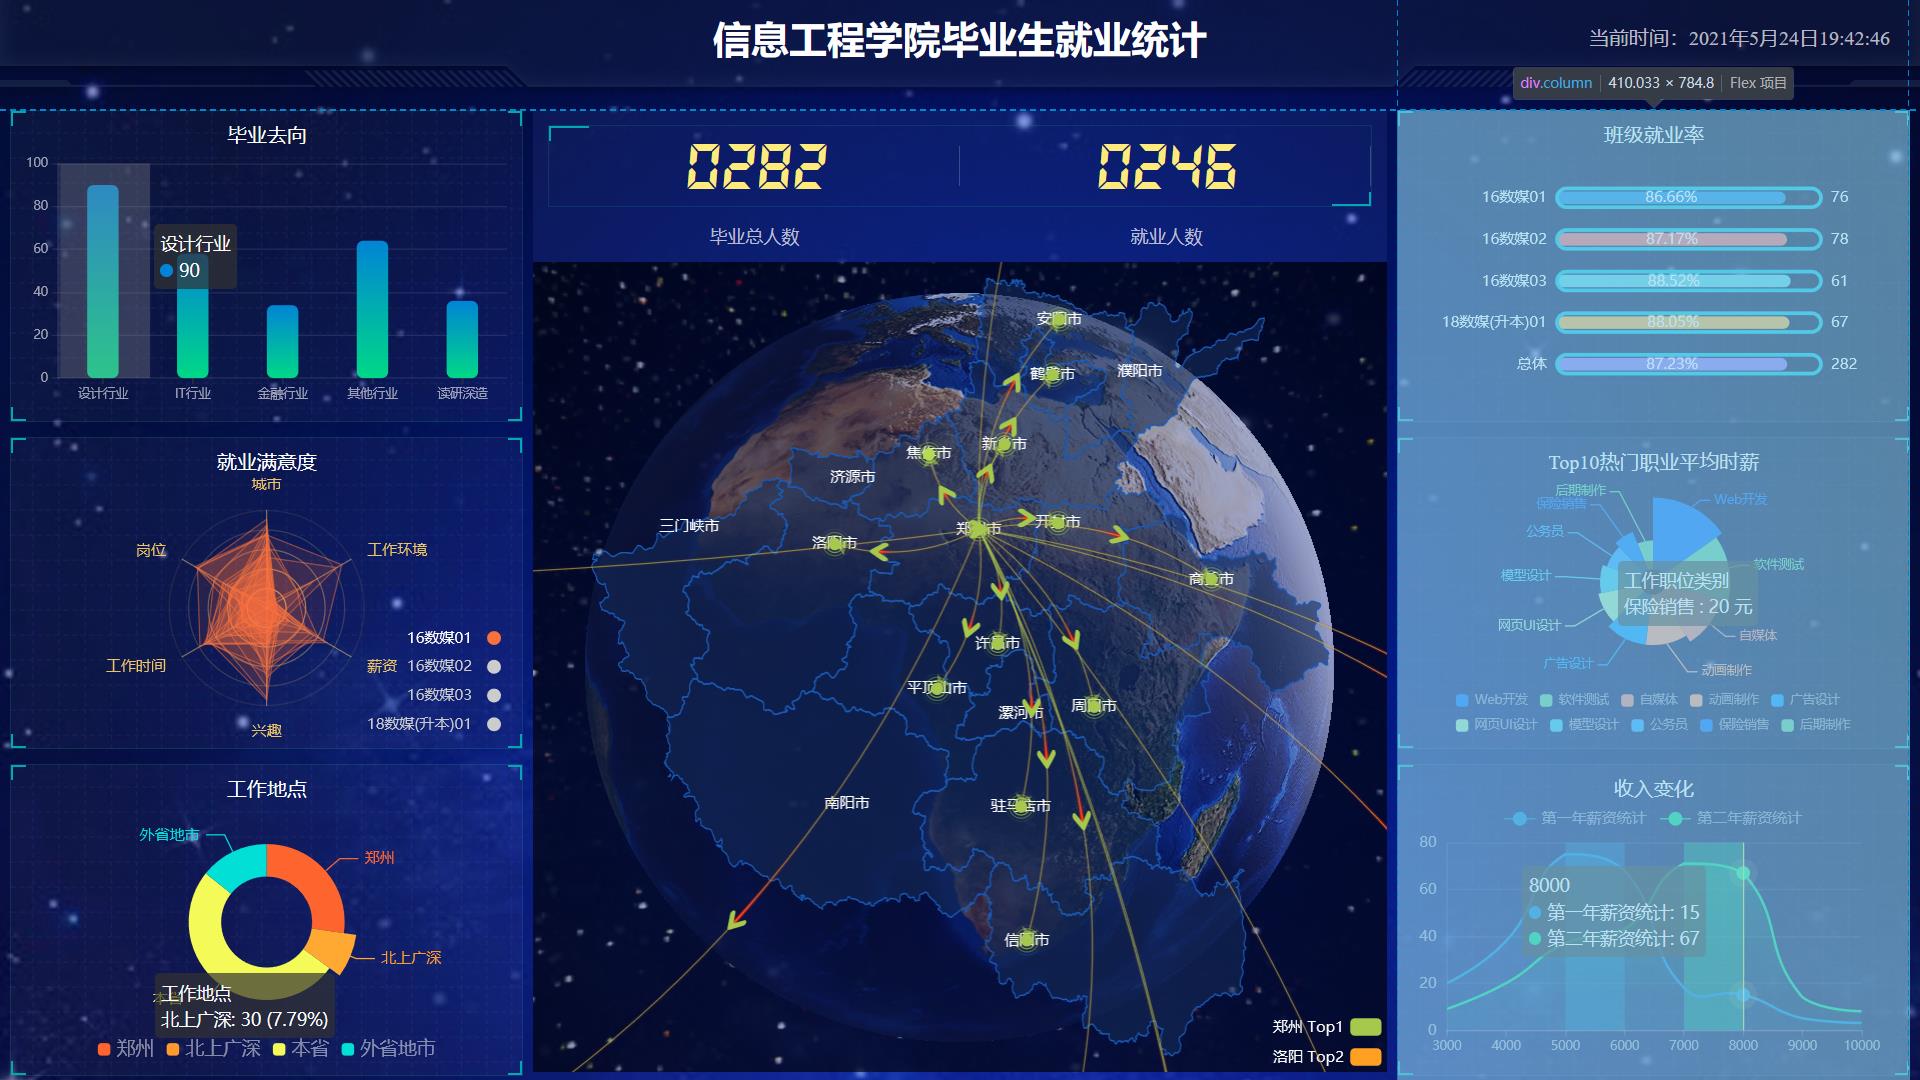
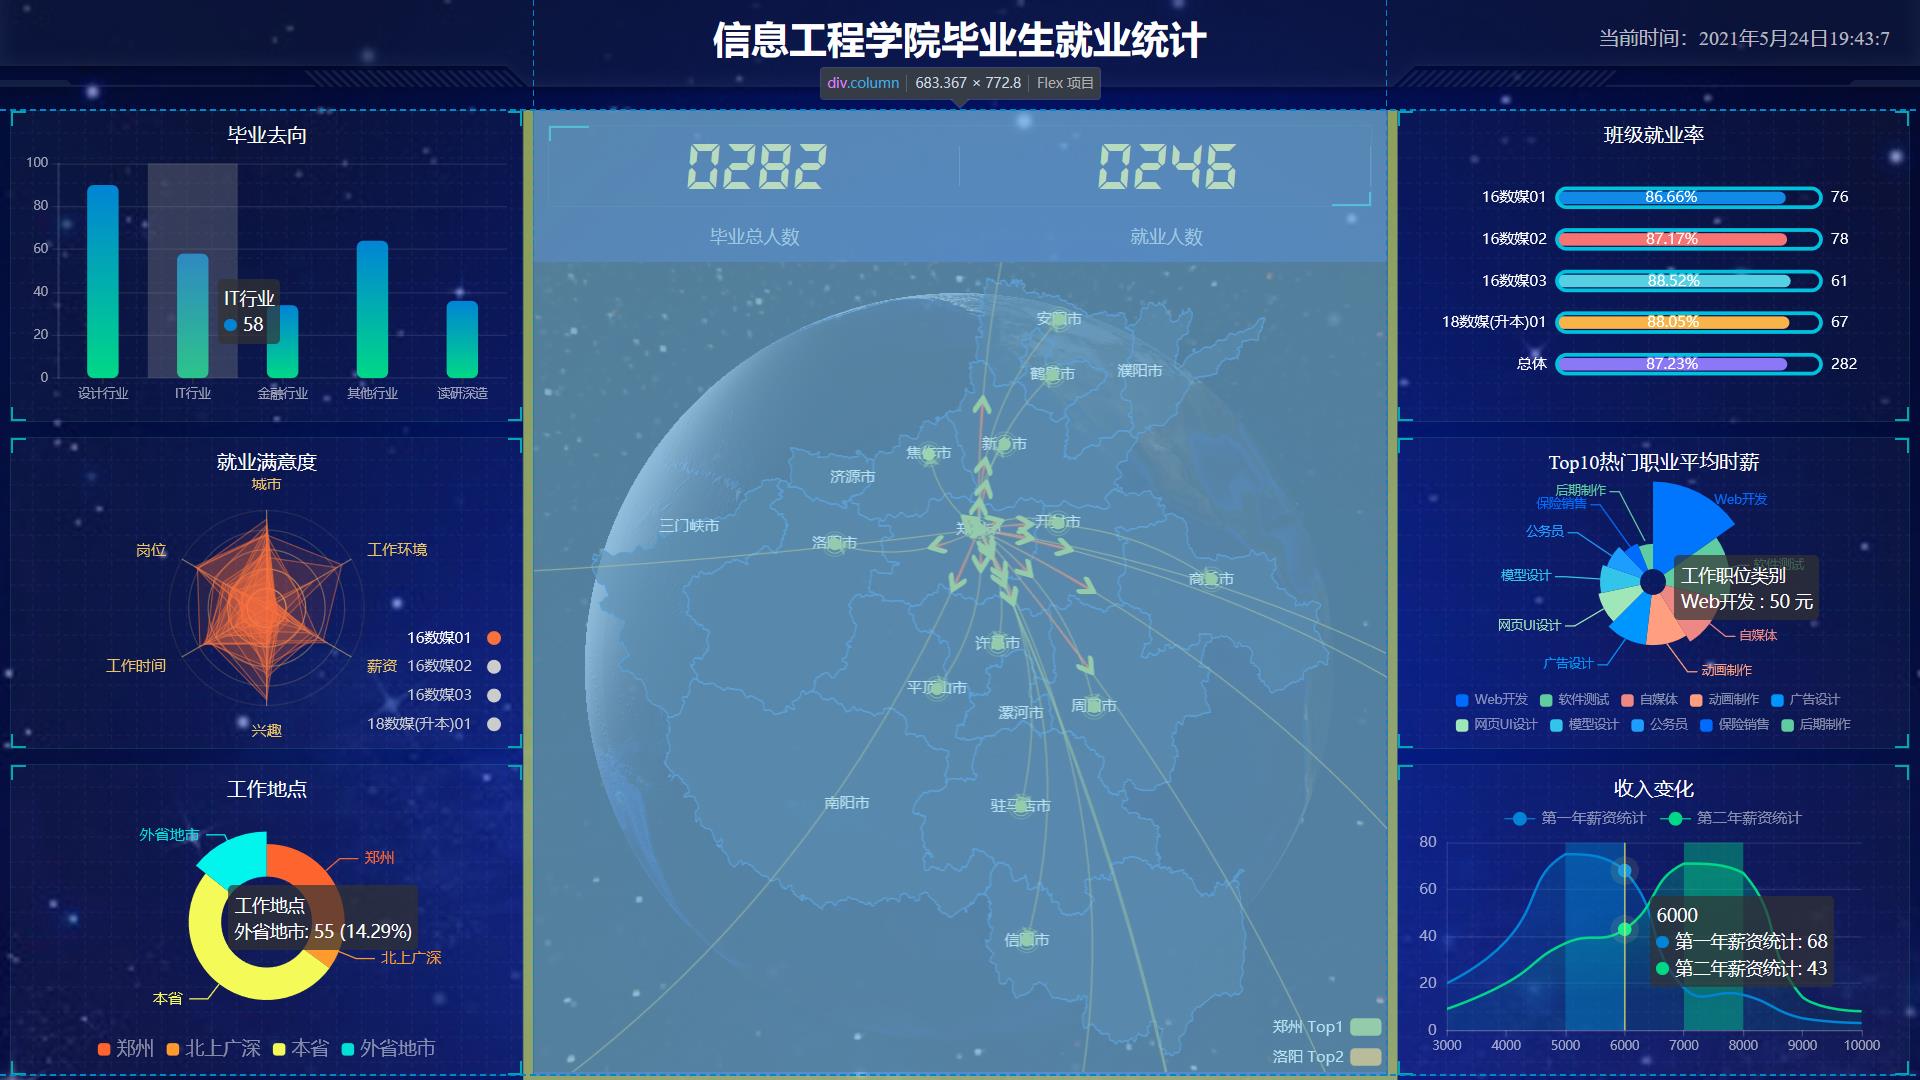
CSS代码:body{ } .mainbox { display: flex; min-width: 1024px;/*最小宽度*/ max-width: 1920px;/*最大宽度*/ margin: 0 auto; padding: 0.125rem 0.125rem 0; } .mainbox .column { flex: 3; } .mainbox .column:nth-child(2) { flex: 5; margin: 0 0.125rem 0.1875rem; overflow: hidden; }
mainbox面板模板
-
高度为 310px
-
border边框属性:border-width border-style border-color
-
即:1px solid(实线) rgba(25, 186, 139, 0.17)
-
加入line.jpg 背景图片

-
padding为 上为 0 左右 15px 下为 40px
-
下外边距是 15px
-
利用panel 盒子 before 和after 制作上面两个角 大小为 10px 线条为 2px solid #02a6b5
-
新加一个盒子before 和after 制作下侧两个角 宽度高度为 10px
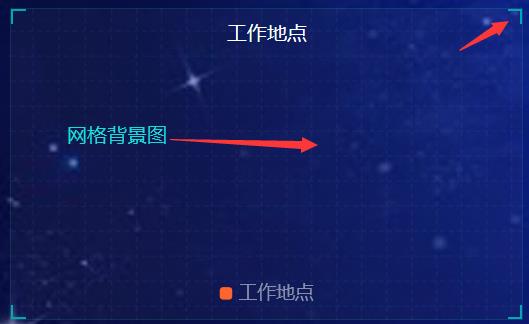
CSS代码:
.mainbox .panel {
  position: relative;
  height: 3.9rem;
  padding: 0 0.1875rem 0.5rem;
  border: 1px solid rgba(25, 186, 139, 0.17);
  margin-bottom: 0.1875rem;
  background: url(../images/line.png) rgba(255, 255, 255, 0.03);
}
/* 左上角转角 */
.mainbox .panel::before {
  position: absolute;
  top: 0;
  left: 0;
  width: 10px;
  height: 10px;
  border-left: 2px solid #02a6b5;
  border-top: 2px solid #02a6b5;
  content: "";
}
/* 右上角转角 */
.mainbox .panel::after {
  position: absolute;
  top: 0;
  right: 0;
  width: 10px;
  height: 10px;
  border-right: 2px solid #02a6b5;
  border-top: 2px solid #02a6b5;
  content: "";
}
/* panel下方盒子 */
.mainbox .panel .panel-footer {
  position: absolute;
  bottom: 0;
  left: 0;
  width: 100%;
}
/* 左下角转角 */
.mainbox .panel .panel-footer::before {
  position: absolute;
  left: 0;
  bottom: 0;
  width: 10px;
  height: 10px;
  border-left: 2px solid #02a6b5;
  border-bottom: 2px solid #02a6b5;
  content: "";
}
/* 右下角转角 */
.mainbox .panel .panel-footer::after {
  position: absolute;
  bottom: 0;
  right: 0;
  width: 10px;
  height: 10px;
  border-right: 2px solid #02a6b5;
  border-bottom: 2px solid #02a6b5;
  content: "";
}
panel内部块模板布局
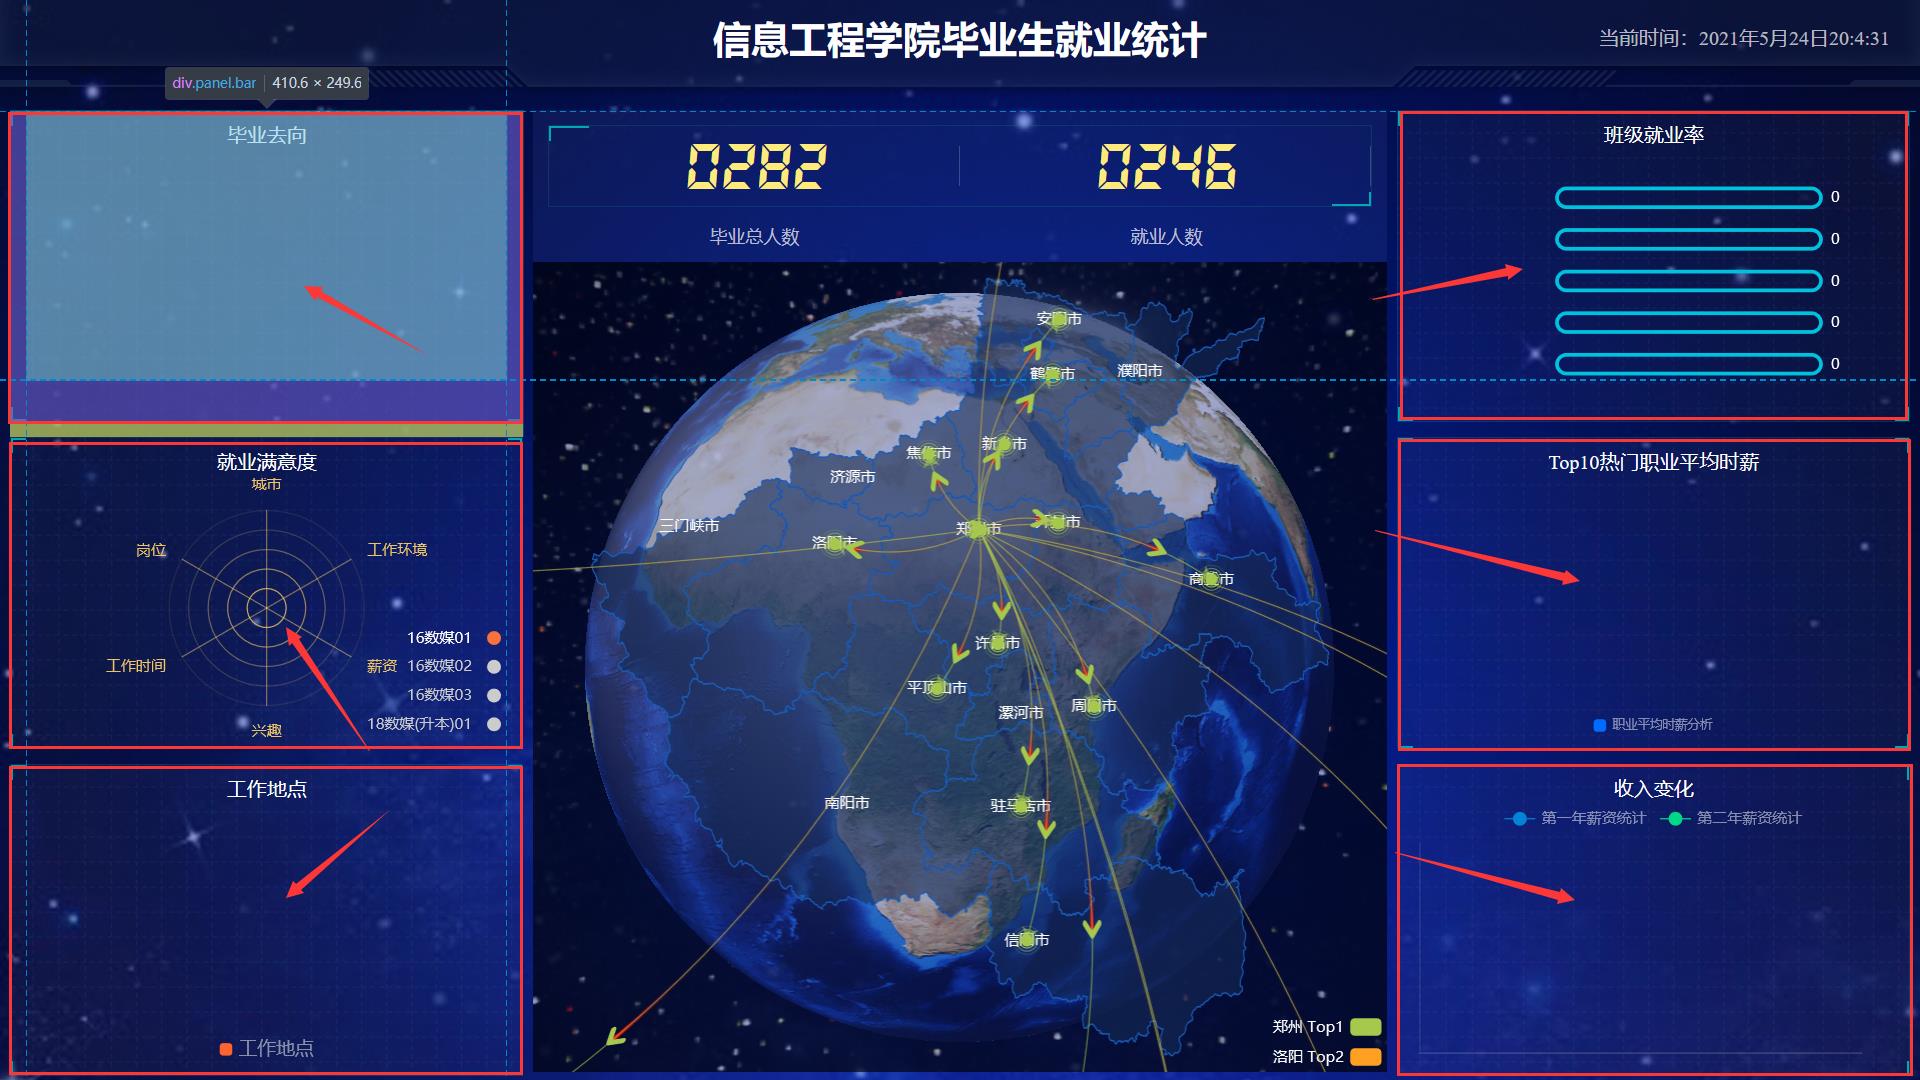
六块布局均一样。因此套用一个模板。
-
标题模块 h2 高度为 48px 文字颜色为白色 文字大小为 20px
-
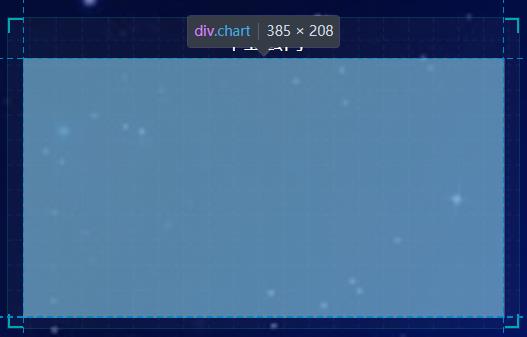
图标内容模块 chart 高度 240px
-
以上可以作为panel公共样式部分
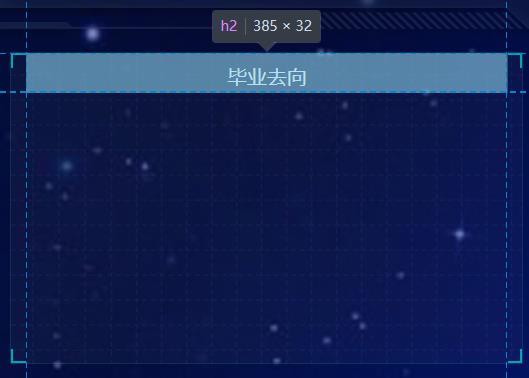
/* panel盒子内h2标题设置 */
.mainbox .panel h2 {
  height: 0.5rem;
  color: #fff;
  line-height: 0.6rem;
  text-align: center;
  font-size: 0.25rem;
  font-weight: 400;
}
/* chart模板设置 */
.mainbox .panel .chart {
  height: 3.25rem;
}
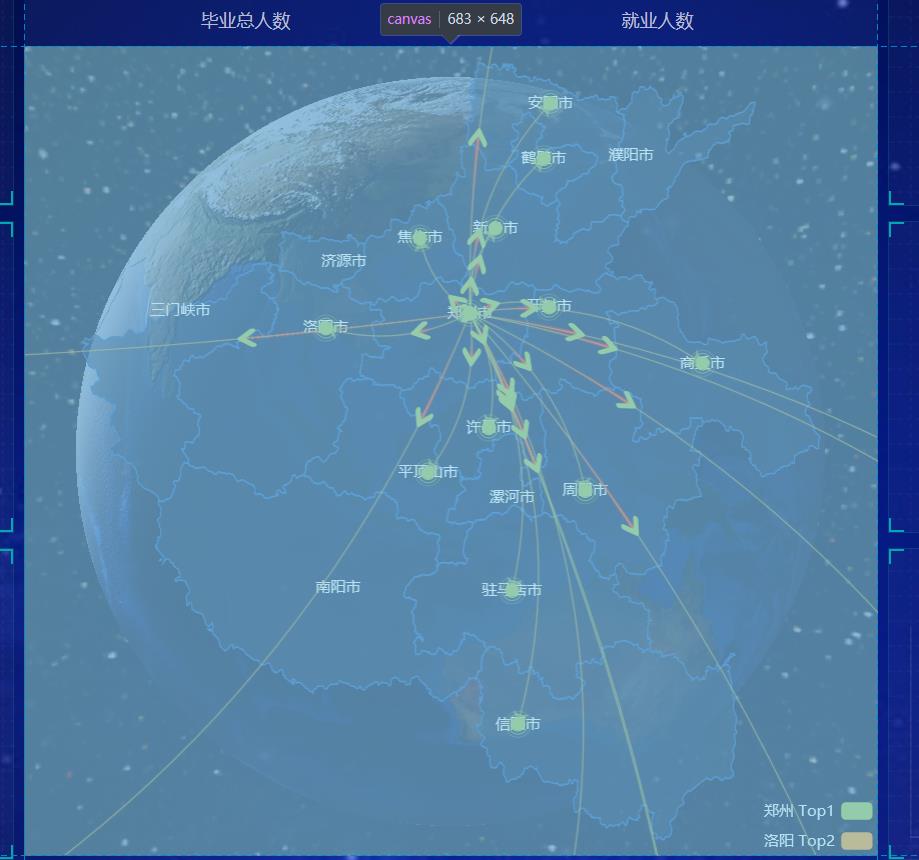
中央布局
-
上面是no 数字模块

-
下面是map 地图模块
no模块布局

 /* 数字模块 no  背景颜色rgba(101, 132, 226, 0.1)  内边距15px */
.no {
  background: rgba(101, 132, 226, 0.1);
  padding: 0.1875rem;
}
/* no边框设置 */
.no .no-hd {
  position: relative;
  border: 1px solid rgba(25, 186, 139, 0.17);
}
/* 左上转角配置 */
.no .no-hd::before {
  position: absolute;
  top: 0;
  left: 0;
  content: "";
  width: 30px;
  height: 10px;
  border-top: 2px solid #02a6b5;
  border-left: 2px solid #02a6b5;
}
/*  右下转角配置 */
.no .no-hd::after {
  position: absolute;
  bottom: 0;
  right: 0;
  content: "";
  width: 30px;
  height: 10px;
  border-right: 2px solid #02a6b5;
  border-bottom: 2px solid #02a6b5;
}
/*  no模块header部分 */
.no .no-hd ul {
  display: flex;
}
/* ul标签配置 li标签配置 */
.no .no-hd ul li {
  position: relative;
  flex: 1;
  line-height: 1rem;
  font-size: 0.875rem;
  color: #ffeb7b;
  text-align: center;
  font-family: "electronicFont";
}
/* 小竖线 */
.no .no-hd ul li::after {
  content: "";
  position: absolute;
  top: 25%;
  right: 0;
  height: 50%;
  width: 1px;
  background: rgba(255, 255, 255, 0.2);
}
/* no模板下半部分 */
.no .no-bd ul {
  display: flex;
}
/* ul标签配置 li标签配置 */
.no .no-bd ul li {
  flex: 1;
  text-align: center;
  color: rgba(255, 255, 255, 0.7);
  font-size: 0.225rem;
  height: 0.5rem;
  line-height: 0.5rem;
  padding-top: 0.125rem;
}
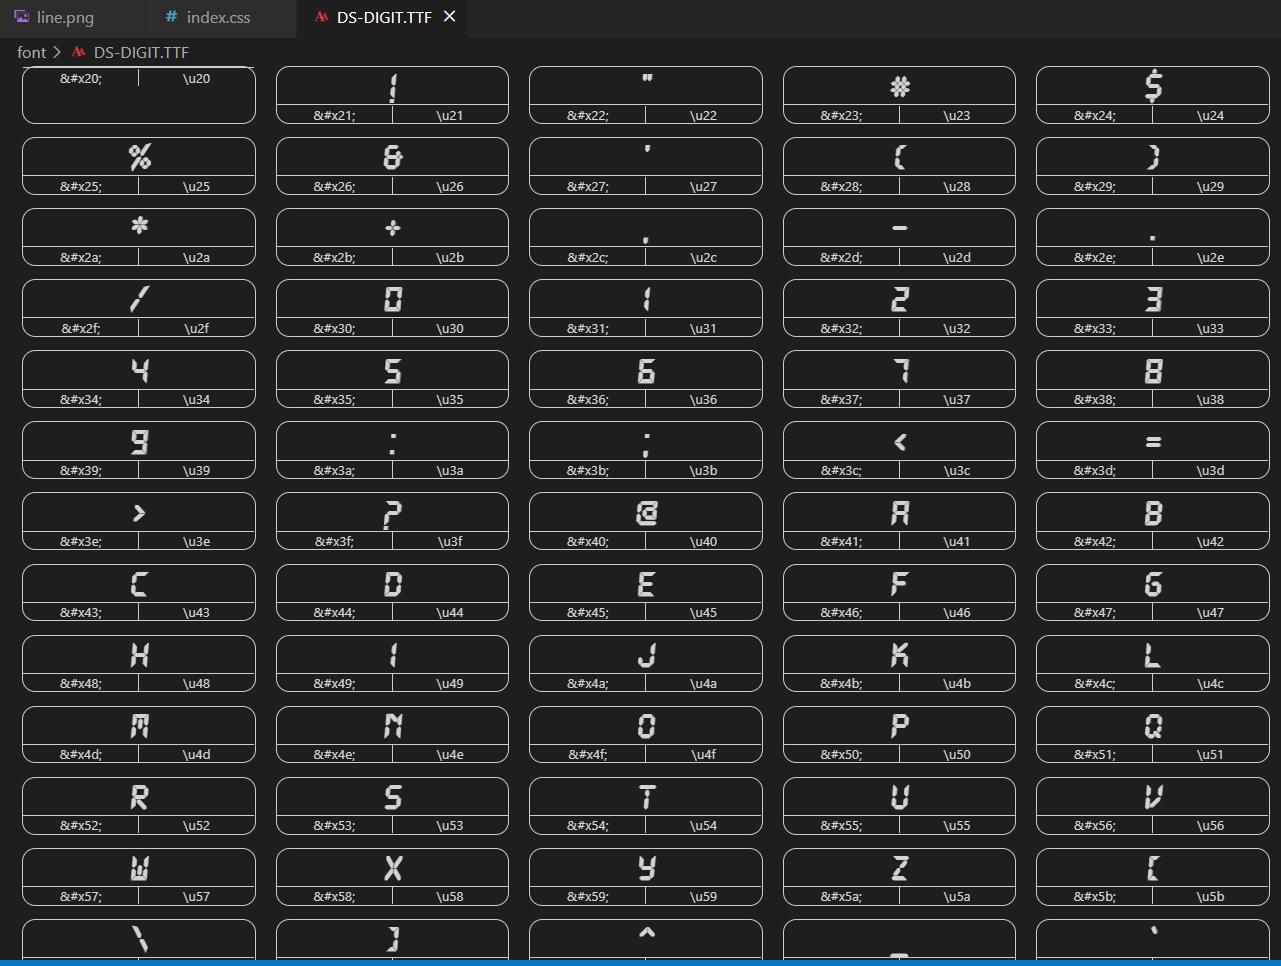
字体配置:
/* 声明字体*/
@font-face {
  font-family: electronicFont;
  src: url(../font/DS-DIGIT.TTF);
}
map模块布局
地图模块制作:
- 地图模块高度为 810px 里面包含2个盒子 chart 放图表模块 球体盒子 旋转1 旋转2
- 球体图片模块 map1 大小为 518px 要加背景图片 因为要缩放100% 定位到最中央 透明度 .3
.map {
  position: relative;
  height: 10.125rem;
}
.map .map1 {
  position: absolute;
  top: 50%;
  left: 50%;
  transform: translate(-50%, -50%);
  height: 10.125rem;
  width: 100%;
  opacity: 0.65; /*透明度*/
  background-size: 100% 100%;
}
/* 放置图标模块 */
.map .chart {
  position: relative;
  top: 0;
  left: 0;
  width: 100%;
  height: 10.125rem;
}
屏幕约束
/* 约束屏幕尺寸 */
@media screen and (max-width: 1024px) {
  html {
    font-size: 42px !important;
  }
}
@media screen and (min-width: 1920px) {
  html {
    font-size: 80px !important;
  }
}
布局html代码
index.html
<!DOCTYPE html>
<html lang="en">
<head>
<meta charset="UTF-8" />
<meta name="viewport" content="width=device-width, initial-scale=1.0" />
<title>数据可视化</title>
<link rel="stylesheet" href="css/index.css" />
</head>
<body>
<!-- 头部的盒子 -->
<header onclick="window.location.href= 'index.html';return false">
<h1>信息工程学院毕业生就业统计</h1>
<div class="showTime"></div>
<script>
var t = null;
t = setTimeout(time, 1000); //开始运行
function time() {
clearTimeout(t); //清除定时器
dt = new Date();
var y = dt.getFullYear();
var mt = dt.getMonth() + 1;
var day = dt.getDate();
var h = dt.getHours(); //获取时
var m = dt.getMinutes(); //获取分
var s = dt.getSeconds(); //获取秒
document.querySelector(".showTime").innerHTML =
"当前时间:" + y + "年" + mt + "月" + day + "日" + h + ":" + m + ":" + s;
t = setTimeout(time, 1000); //设定定时器,循环运行
}
</script>
</header>
<!-- 页面主体部分 -->
<section class="mainbox">
<div class="column">
<!-- 列标签 -->
<div class="panel bar">
<!--柱状图-->
<h2>毕业去向</h2>
<div class="chart"></div>
<div class="panel-footer"></div>
</div>
<div class="panel radar">
<!--雷达图-->
<h2>就业满意度</h2>
<div class="chart"></div>
<div class="panel-footer"></div>
</div>
<div class="panel pie">
<!--扇形图-->
<h2>工作地点</h2>
<div class="chart">图表</div>
<div class="panel-footer"></div>
</div>
</div>
<div class="column">
<!-- no模块制作 -->
<div class="no">
<div class="no-hd">
<ul>
<li>0282</li>
<li>0246</li>
</ul>
</div>
<div class="no-bd">
<ul>
<li>毕业总人数</li>
<li>就业人数</li>
</ul>
</div>
</div>
<!-- 地图模块 -->
<div class="map">
<div class="map1" id="globe3D"></div>
<div class="chart"></div>
</div>
</div>
<div class="column">
<div class="panel bar2">
<h2>班级就业率</h2>
<div class="chart">图表</div>
<div class="panel-footer"></div>
</div>
<div class="panel pie2">
<h2>Top10热门职业平均时薪</h2>
<div class="chart">图表</div>
<div class="panel-footer"></div>
</div>
<div class="panel line">
<!--雷达图-->
<h2>收入变化</h2>
<div class="chart"></div
