scipy.signal.find_peaks(峰值检测)
Posted 月疯
tags:
篇首语:本文由小常识网(cha138.com)小编为大家整理,主要介绍了scipy.signal.find_peaks(峰值检测)相关的知识,希望对你有一定的参考价值。
函数用法:
scipy.signal.find_peaks(x, height=None, threshold=None, distance=None, prominence=None, width=None, wlen=None, rel_height=0.5, plateau_size=None)
解释:输入
x: 带有峰值的信号序列
height: 低于指定height的信号都不考虑
threshold: 其与相邻样本的垂直距离
distance: 相邻峰之间的最小水平距离, 先移除较小的峰,直到所有剩余峰的条件都满足为止。
prominence: 个人理解是突起程度,详见peak_prominences
width: 波峰的宽度,详见peak_widths
plateau_size: 保证峰对应的平顶数目大于给定值
返回值:
peaks: x对应的峰值的索引
properties:
height--> ‘peak_heights’
threshold-->‘left_thresholds’, ‘right_thresholds’
prominence-->‘prominences’, ‘right_bases’, ‘left_bases’
width-->‘width_heights’, ‘left_ips’, ‘right_ips’
plateau_size-->‘plateau_sizes’, left_edges’, ‘right_edges’
小列子01:
import matplotlib.pyplot as plt
from scipy.misc import electrocardiogram
from scipy.signal import find_peaks
import numpy as np
x = electrocardiogram()[2000:4000]
peaks, _ = find_peaks(x, height=0)
plt.plot(x)
plt.plot(peaks, x[peaks], "x")
plt.plot(np.zeros_like(x), "--", color="gray")
plt.show()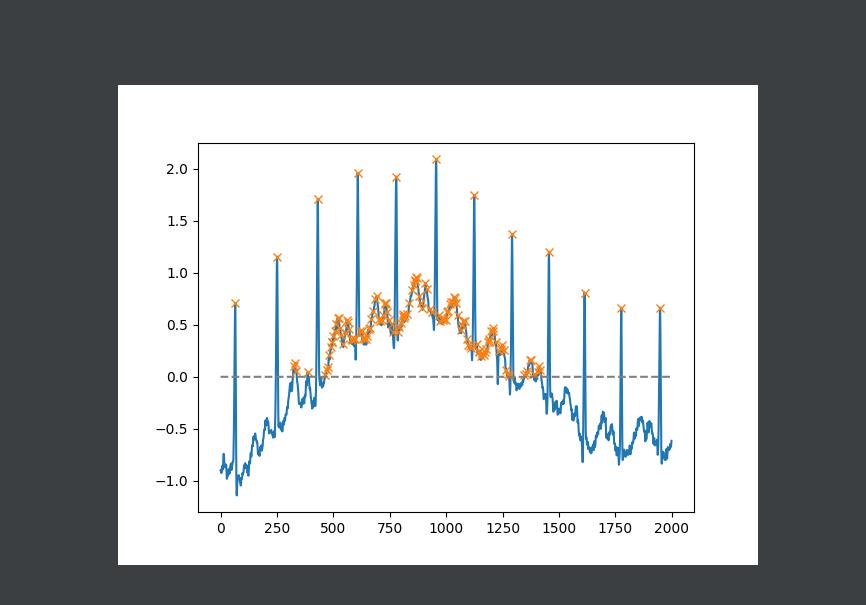
小列子02:
import matplotlib.pyplot as plt
from scipy.misc import electrocardiogram
from scipy.signal import find_peaks
import numpy as np
#选择大于0的
# x = electrocardiogram()[2000:4000]
# peaks, _ = find_peaks(x, height=0)
# plt.plot(x)
# plt.plot(peaks, x[peaks], "x")
# plt.plot(np.zeros_like(x), "--", color="gray")
# plt.show()

#小于0一下的
x = electrocardiogram()[2000:4000]
border = np.sin(np.linspace(0, 3 * np.pi, x.size))
peaks, _ = find_peaks(x, height=(-border, border))
plt.plot(x)
plt.plot(-border, "--", color="gray")
plt.plot(border, ":", color="gray")
plt.plot(peaks, x[peaks], "x")
plt.show()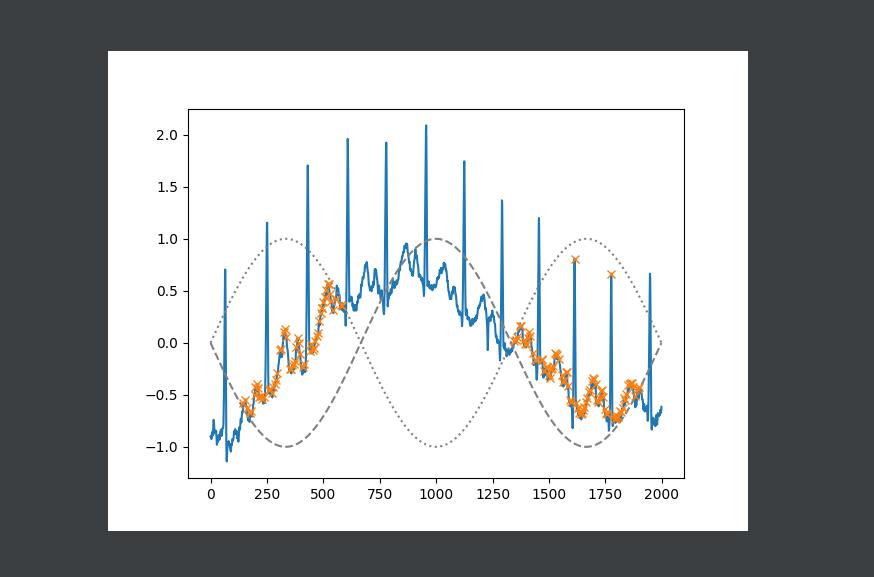
小列子03:
import matplotlib.pyplot as plt
from scipy.misc import electrocardiogram
from scipy.signal import find_peaks
import numpy as np

#我们可以通过要求至少150个样本的距离来轻松选择心电图(ECG)中QRS络合物的位置
x = electrocardiogram()[2000:4000]
peaks, _ = find_peaks(x, distance=150)
plt.plot(x)
plt.plot(peaks, x[peaks], "x")
plt.show()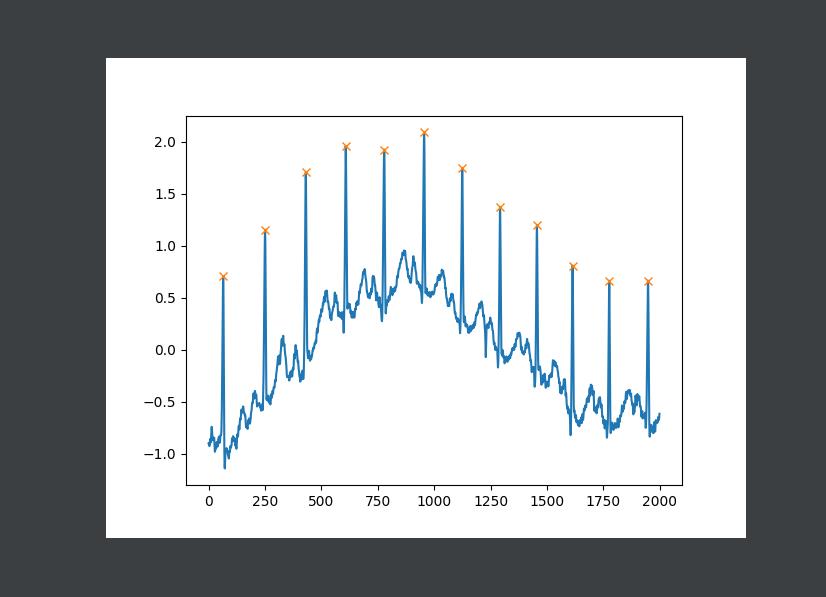
小列子04:
import matplotlib.pyplot as plt
from scipy.misc import electrocardiogram
from scipy.signal import find_peaks
import numpy as np

#通过将允许的突出限制为0.6
x = electrocardiogram()[2000:4000]
peaks, properties = find_peaks(x, prominence=(None, 0.6))
plt.plot(x)
plt.plot(peaks, x[peaks], "x")
plt.show()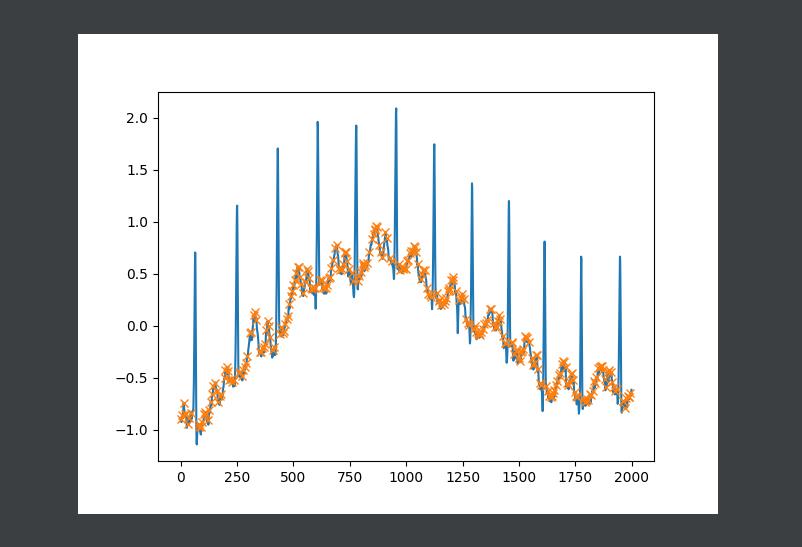
小列子05:
import matplotlib.pyplot as plt
from scipy.misc import electrocardiogram
from scipy.signal import find_peaks
import numpy as np

#要仅选择非典型心跳,我们将两个条件结合起来:最小突出1和至少20个样本的宽度。
x = electrocardiogram()[17000:18000]
peaks, properties = find_peaks(x, prominence=1, width=20)

plt.plot(x)
plt.plot(peaks, x[peaks], "x")
plt.vlines(x=peaks, ymin=x[peaks] - properties["prominences"],
           ymax = x[peaks], color = "C1")
plt.hlines(y=properties["width_heights"], xmin=properties["left_ips"],
          xmax=properties["right_ips"], color = "C1")
plt.show()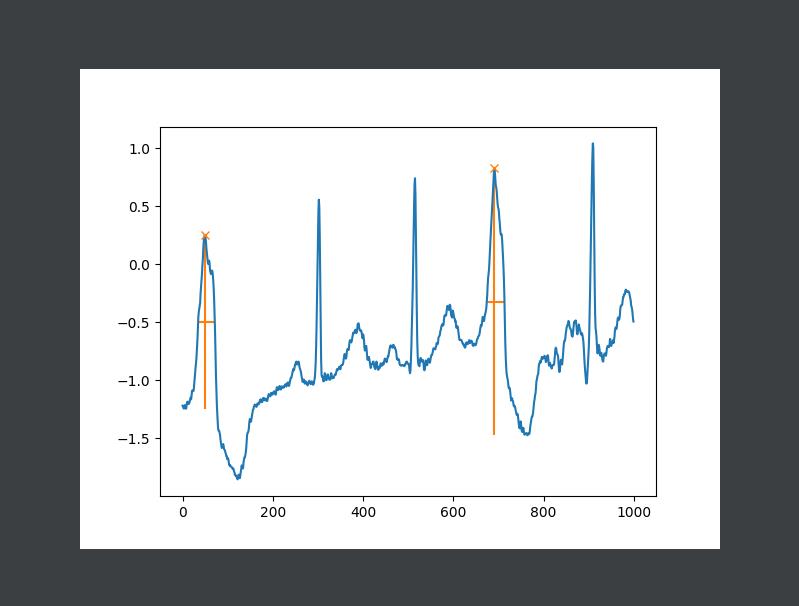
以上是关于scipy.signal.find_peaks(峰值检测)的主要内容,如果未能解决你的问题,请参考以下文章