可视化实验九:利用Python绘制直方图饼图
Posted @阿证1024
tags:
篇首语:本文由小常识网(cha138.com)小编为大家整理,主要介绍了可视化实验九:利用Python绘制直方图饼图相关的知识,希望对你有一定的参考价值。
实验目的:
- 掌握Python中直方图、饼图绘图函数的使用及展示图形的意义
- 利用上述绘图函数实现数据可视化
实验内容:
- 练习python中直方图、饼图绘图函数的用法,掌握相关参数的概念
- 根据步骤一绘图函数要求,处理实验数据
- 根据步骤二得到的实验数据,绘制直方图、饼图
- 练习如何通过调整参数使图片呈现不同效果,例如颜色、图例位置、背景网格、坐标轴刻度和标记等
实验过程(附结果截图):
1. 练习python中直方图、饼图绘图函数的用法,掌握相关参数的概念
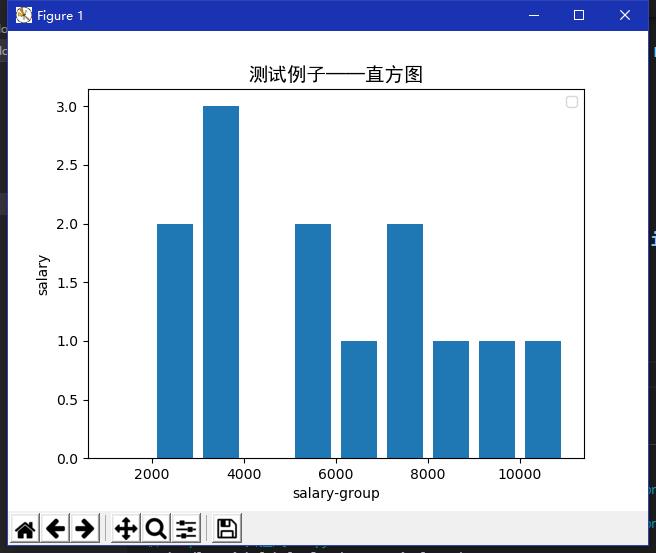
(1)绘制直方图
import matplotlib.pyplot as plt
from matplotlib.font_manager import FontProperties
font = FontProperties(fname=r"C:\\Windows\\Fonts\\simhei.ttf", size=14)

salary = [2500, 3300, 2700, 5600, 6700, 5400, 3100, 3500, 7600, 7800,
          8700, 9800, 10400]

group = [1000, 2000, 3000, 4000, 5000, 6000, 7000, 8000, 9000, 10000, 11000]


plt.hist(salary, group, histtype='bar', rwidth=0.8)

plt.legend()

plt.xlabel('salary-group')
plt.ylabel('salary')

plt.title('测试例子——直方图', FontProperties=font)

plt.show()
(2)绘制饼图
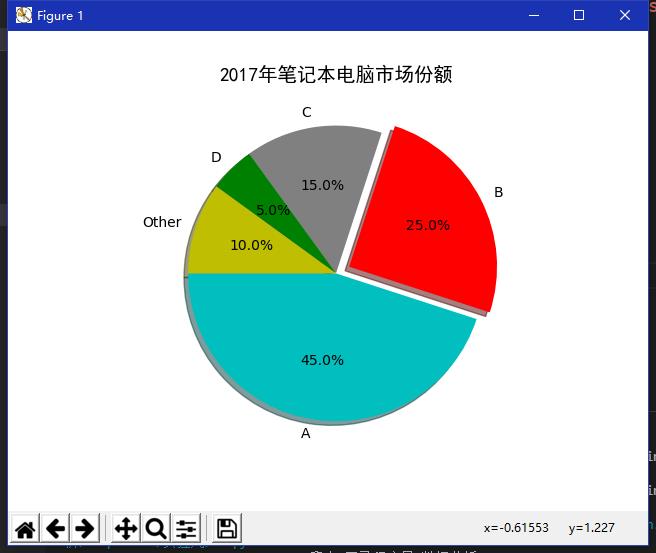
import matplotlib as mpl
import matplotlib.pyplot as plt
from matplotlib.font_manager import FontProperties

font = FontProperties(fname=r"C:\\Windows\\Fonts\\simhei.ttf", size=14)

# 生成数据
labels = ['A', 'B', 'C', 'D', 'Other']
share = [0.45, 0.25, 0.15, 0.05, 0.10]

# 设置分裂属性
explode = [0, 0.1, 0, 0, 0]

# 分裂饼图
plt.pie(share, explode=explode,
        labels=labels, autopct='%3.1f%%',
        startangle=180, shadow=True,
        colors=['c', 'r', 'gray', 'g', 'y'])

# 标题
plt.title('2017年笔记本电脑市场份额', FontProperties=font)

plt.show()
2. 根据步骤一绘图函数要求,处理实验数据
(1)处理后的实验数据
data = [np.random.randint(0, n, n) for n in [3000, 4000, 5000]]
labels = ['3K', '4K', '5K']
3. 根据步骤二得到的实验数据,绘制直方图、饼图
(1)绘制直方图
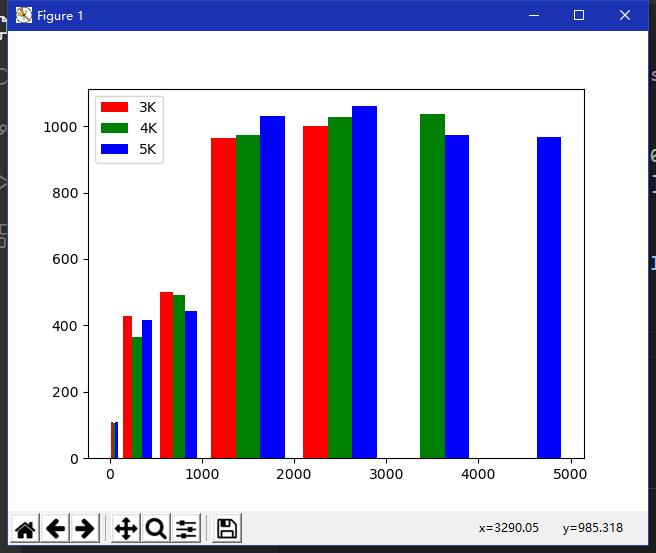
import matplotlib.pyplot as plt
import numpy as np

data = [np.random.randint(0, n, n) for n in [3000, 4000, 5000]]
labels = ['3K', '4K', '5K']
bins = [0, 100, 500, 1000, 2000, 3000, 4000, 5000]

plt.hist(data, bins=bins, label=labels,color=['r','g','b'])
plt.legend()

plt.show()
(2)绘制饼图
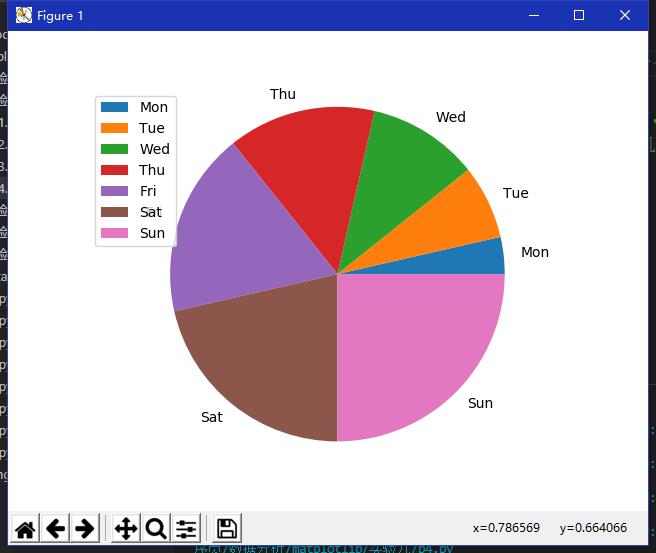
import matplotlib.pyplot as plt
import numpy as np

labels = ['Mon', 'Tue', 'Wed', 'Thu', 'Fri', 'Sat', 'Sun']

# data = np.random.rand(7) * 100
data = [1, 2, 3, 4, 5, 6, 7]  # data和labels的索引会对应,占比是data[i]/sum(data)

# 1.2f指的小数保留两位
plt.pie(data, labels=labels, autopct='%1.2f%%')  # 第一个参数是占比,第二个各自的标签,第三个是显示精度

plt.axis('equal')  # 让图看起来是圆的,不然就扁了
plt.legend()  # 左上角的那个图例,随机的,可以自己换位置

plt.show()
4. 练习如何通过调整参数使图片呈现不同效果,例如颜色、图例位置、背景网格、坐标轴刻度和标记等
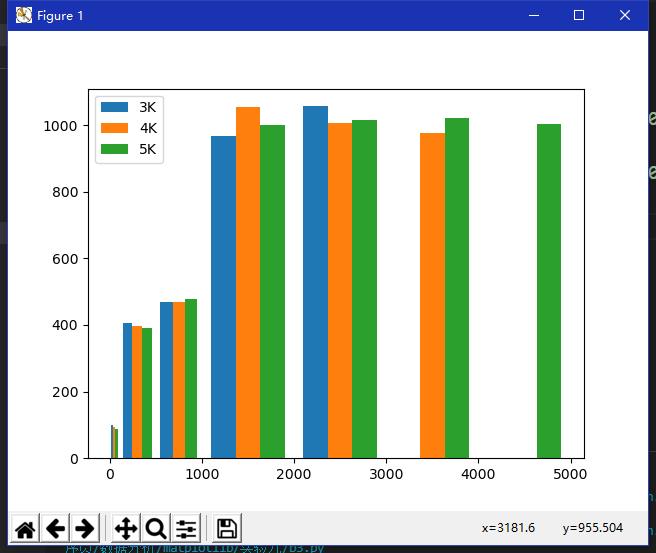
(1)绘制直方图
import matplotlib.pyplot as plt
import numpy as np

data = [np.random.randint(0, n, n) for n in [3000, 4000, 5000]]
labels = ['3K', '4K', '5K']
bins = [0, 100, 500, 1000, 2000, 3000, 4000, 5000]

plt.hist(data, bins=bins, label=labels)
plt.legend()

plt.show()
(2)绘制饼图
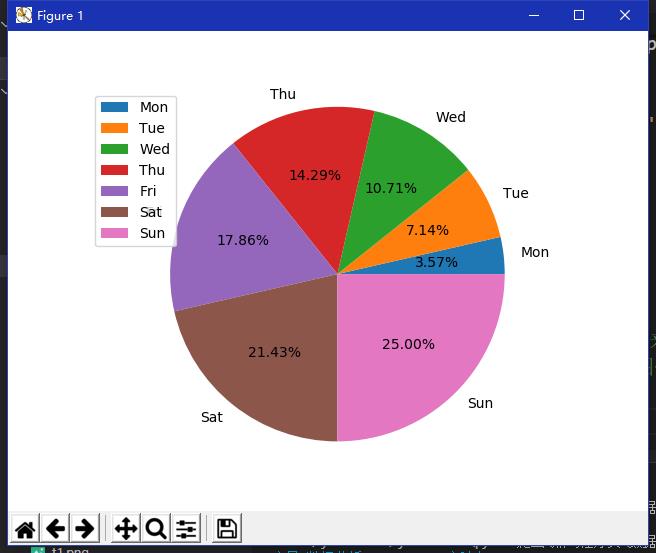
import matplotlib.pyplot as plt
import numpy as np

labels = ['Mon', 'Tue', 'Wed', 'Thu', 'Fri', 'Sat', 'Sun']

# data = np.random.rand(7) * 100
data = [1, 2, 3, 4, 5, 6, 7]  # data和labels的索引会对应,占比是data[i]/sum(data)

# 1.2f指的小数保留两位
plt.pie(data, labels=labels, autopct='%1.2f%%')  # 第一个参数是占比,第二个各自的标签,第三个是显示精度

plt.axis('equal')  # 让图看起来是圆的,不然就扁了
plt.legend()  # 左上角的那个图例,随机的,可以自己换位置

plt.show()
实验小结自己写写就行了,本实验仅供参考。
以上是关于可视化实验九:利用Python绘制直方图饼图的主要内容,如果未能解决你的问题,请参考以下文章