时间序列平稳性分析
Posted hellobigorange
tags:
篇首语:本文由小常识网(cha138.com)小编为大家整理,主要介绍了时间序列平稳性分析相关的知识,希望对你有一定的参考价值。
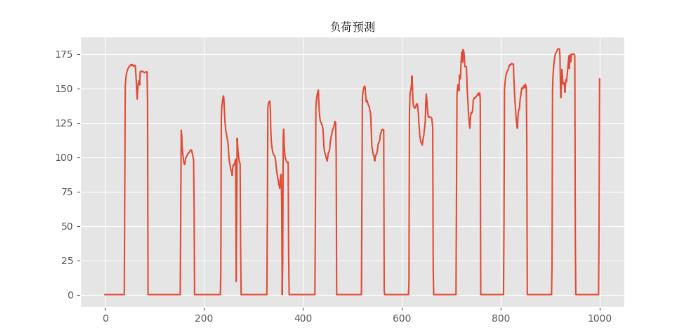
原始的负荷时间序列曲线
一、ADF检验
在使用很多时间序列模型的时候,如 ARMA、ARIMA,都会要求时间序列是平稳的,所以一般在研究一段时间序列的时候,第一步都需要进行平稳性检验,除了用肉眼检测的方法,另外比较常用的严格的统计检验方法就是ADF检验,也叫做单位根检验。
1、ADF检验原理
ADF检验就是判断序列是否存在单位根:如果序列平稳,就不存在单位根;否则,就会存在单位根。
所以,ADF检验的 H0 假设就是存在单位根,如果得到的显著性检验统计量小于三个置信度(10%,5%,1%),则对应有(90%,95,99%)的把握来拒绝原假设。
2、ADF的python实现
ADF检验可以通过python中的 statsmodels 模块,导入adfuller函数
# -*- coding: utf-8 -*-
# @Time : 2021/5/19 15:13
# @Author : Orange
# @File : Stationarity.py

from statsmodels.tsa.stattools import *


# 时间序列平稳性检验,ADF检验
result = adfuller(P_data)
print(result)
(-9.087535016007157, 3.9034351012238036e-15, 3, 2973, {‘1%’: -3.432551464895929, ‘5%’: -2.8625126635320393, ‘10%’: -2.567287774919901}, 24322.072376998112)
看到 t-statistic 的值 -9.087 要小于-3.4325,所以有99%的可能性拒绝原假设。因此序列是平稳的。
二、肉眼观察
这种方式比较主观,但也写出来看看
自相关图和偏相关图
# -*- coding: utf-8 -*-
# @Time : 2021/5/19 15:13
# @Author : Orange
# @File : Stationarity.py

from statsmodels.tsa.stattools import *
from P_predict.data_processing import P_data
import matplotlib.pyplot as plt
import numpy as np
from matplotlib.font_manager import FontProperties

font = FontProperties(fname=r'C:\\Windows\\Fonts\\simsun.ttc', size=12)

# 时间序列平稳性检验,ADF检验
result = adfuller(P_data)

plt.figure(figsize=(10, 5))

Y = P_data[:1000]
X = np.arange(len(Y))

plt.figure(figsize=(10, 5))
plt.style.use('ggplot')
# 自相关图(自相关系数由1变为0最好)
plt.stem(acf(P_data))
plt.title(u'自相关图', fontproperties=font)

plt.figure(figsize=(10, 5))
plt.style.use('ggplot')
# 偏自相关图(自相关系数由1变为0最好)
plt.stem(pacf(P_data))
plt.title(u'偏自相关图', fontproperties=font)
plt.show()
print(result)
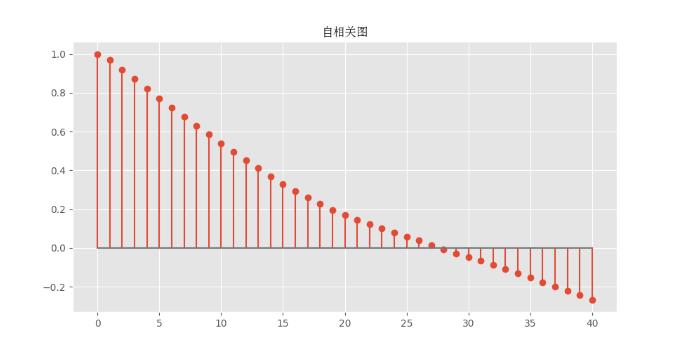
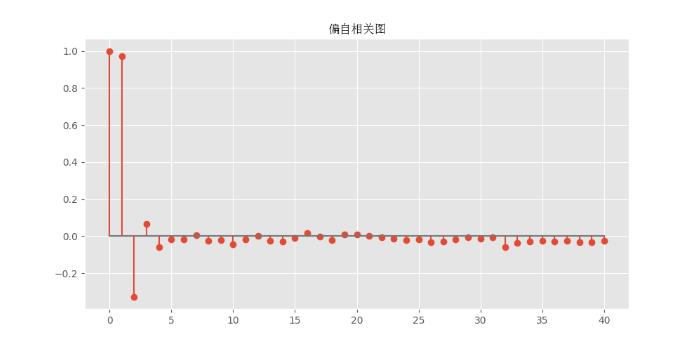
可以看到,0阶自相关系数和0阶偏自相关系数都恒为1。在下面两幅图中,自相关系数和偏自相关系数迅速由1减小到0附近,之后随着阶数ll的上升在0轴上下小幅波动,这基本上是符合平稳性的要求的。
以上是关于时间序列平稳性分析的主要内容,如果未能解决你的问题,请参考以下文章