zabbix自定义监控
Posted rmㅤ-rf *
tags:
篇首语:本文由小常识网(cha138.com)小编为大家整理,主要介绍了zabbix自定义监控相关的知识,希望对你有一定的参考价值。
zabbix自定义监控
开启自定义监控功能
在zabbix客户端上将zabbix_agent.conf文件中将自定义监控的功能打开
[root@client /]# vim /usr/local/etc/zabbix_agentd.conf
UnsafeUserParameters=1		//0表示此功能关闭1表示此功能打开
在两台被监控的主机上创建脚本存放目录
[root@client ~]# mkdir /scripts
自定义监控进程
编写判断进程是否开启的脚本
[root@client ~]# vim /scripts/check_process.sh
#!/bin/bash
process_status=$(ps -elf | grep -Ev "grep|$0" | grep -c $1)
if  [ $process_status != 0 ];then
        echo '1'
else
        echo '0'
fi
给脚本加执行权限
[root@client ~]# chmod +x /scripts/check_process.sh
测试zabbix用户是否能使用此脚本
[root@client ~]# ss -anlt
State   Recv-Q  Send-Q   Local Address:Port    Peer Address:Port  Process
LISTEN  0       128            0.0.0.0:9000         0.0.0.0:*
LISTEN  0       128            0.0.0.0:80           0.0.0.0:*
LISTEN  0       128            0.0.0.0:22           0.0.0.0:*
LISTEN  0       128            0.0.0.0:10050        0.0.0.0:*
LISTEN  0       80                   *:3306               *:*
LISTEN  0       128               [::]:22              [::]:*
[root@client ~]# su - zabbix -s /bin/bash
[zabbix@client root]$ /scripts/check_process.sh httpd
1
[root@client ~]# systemctl stop httpd
[root@client ~]# ss -anlt
State   Recv-Q  Send-Q   Local Address:Port    Peer Address:Port  Process
LISTEN  0       128            0.0.0.0:22           0.0.0.0:*
LISTEN  0       128            0.0.0.0:10050        0.0.0.0:*
LISTEN  0       80                   *:3306               *:*
LISTEN  0       128               [::]:22              [::]:*
[zabbix@client root]$ /scripts/check_process.sh httpd
0
在zabbix客户端端写入此条自定义监控并且在服务端测试是否可用
客户端:
[root@client ~]# vim /usr/local/etc/zabbix_agentd.conf
……
UserParameter=check_process[*],/bin/bash /scripts/check_process.sh $1
……
[root@client ~]# pkill zabbix
[root@client ~]# zabbix_agentd
[root@client ~]# ss -anlt
State   Recv-Q  Send-Q   Local Address:Port    Peer Address:Port  Process
LISTEN  0       128            0.0.0.0:22           0.0.0.0:*
LISTEN  0       128            0.0.0.0:10050        0.0.0.0:*
LISTEN  0       80                   *:3306               *:*
LISTEN  0       128               [::]:22              [::]:*
服务端:
[root@zabbix ~]# zabbix_get -s 192.168.247.211 -k check_process['httpd']
0
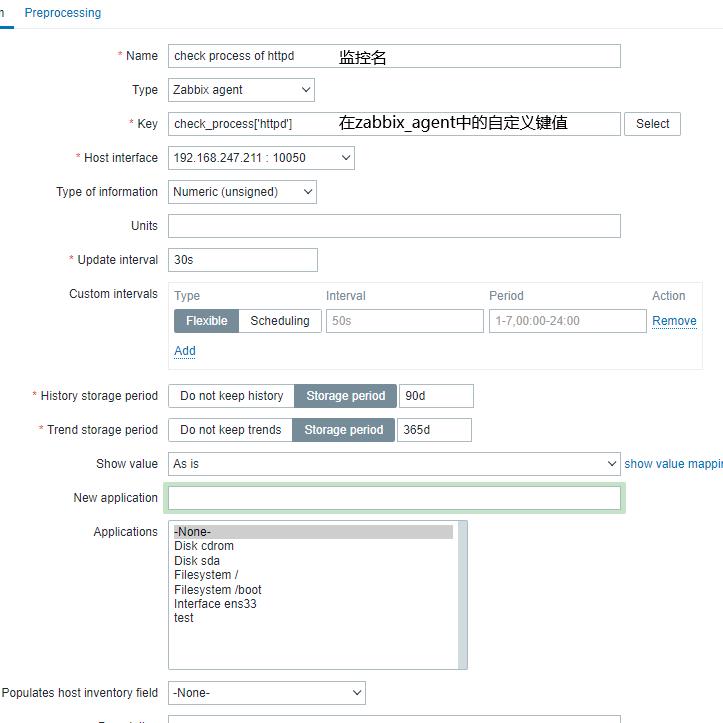
在zabbix页面上创建监控项
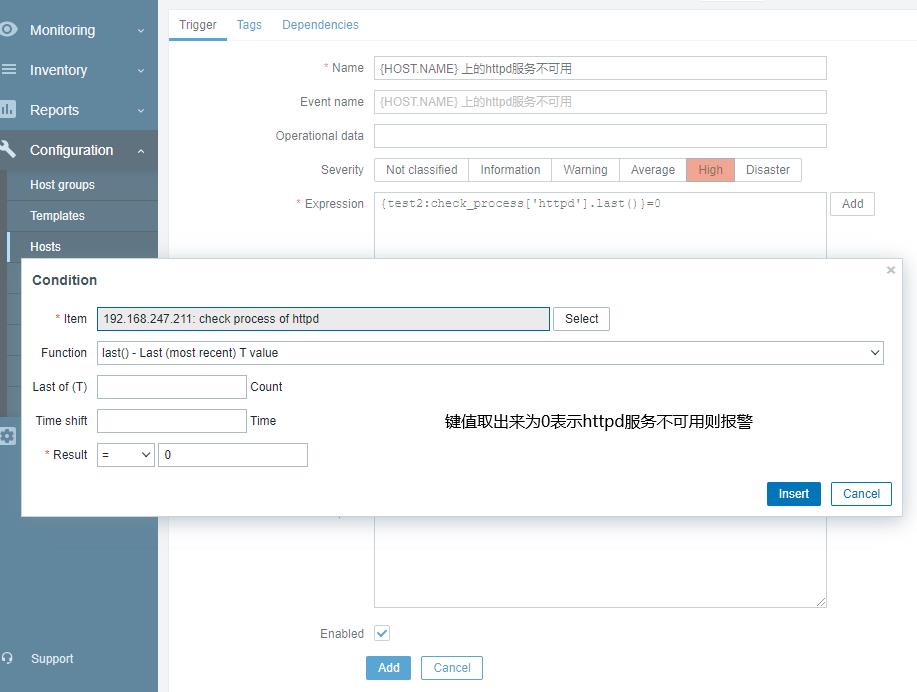
创建触发器
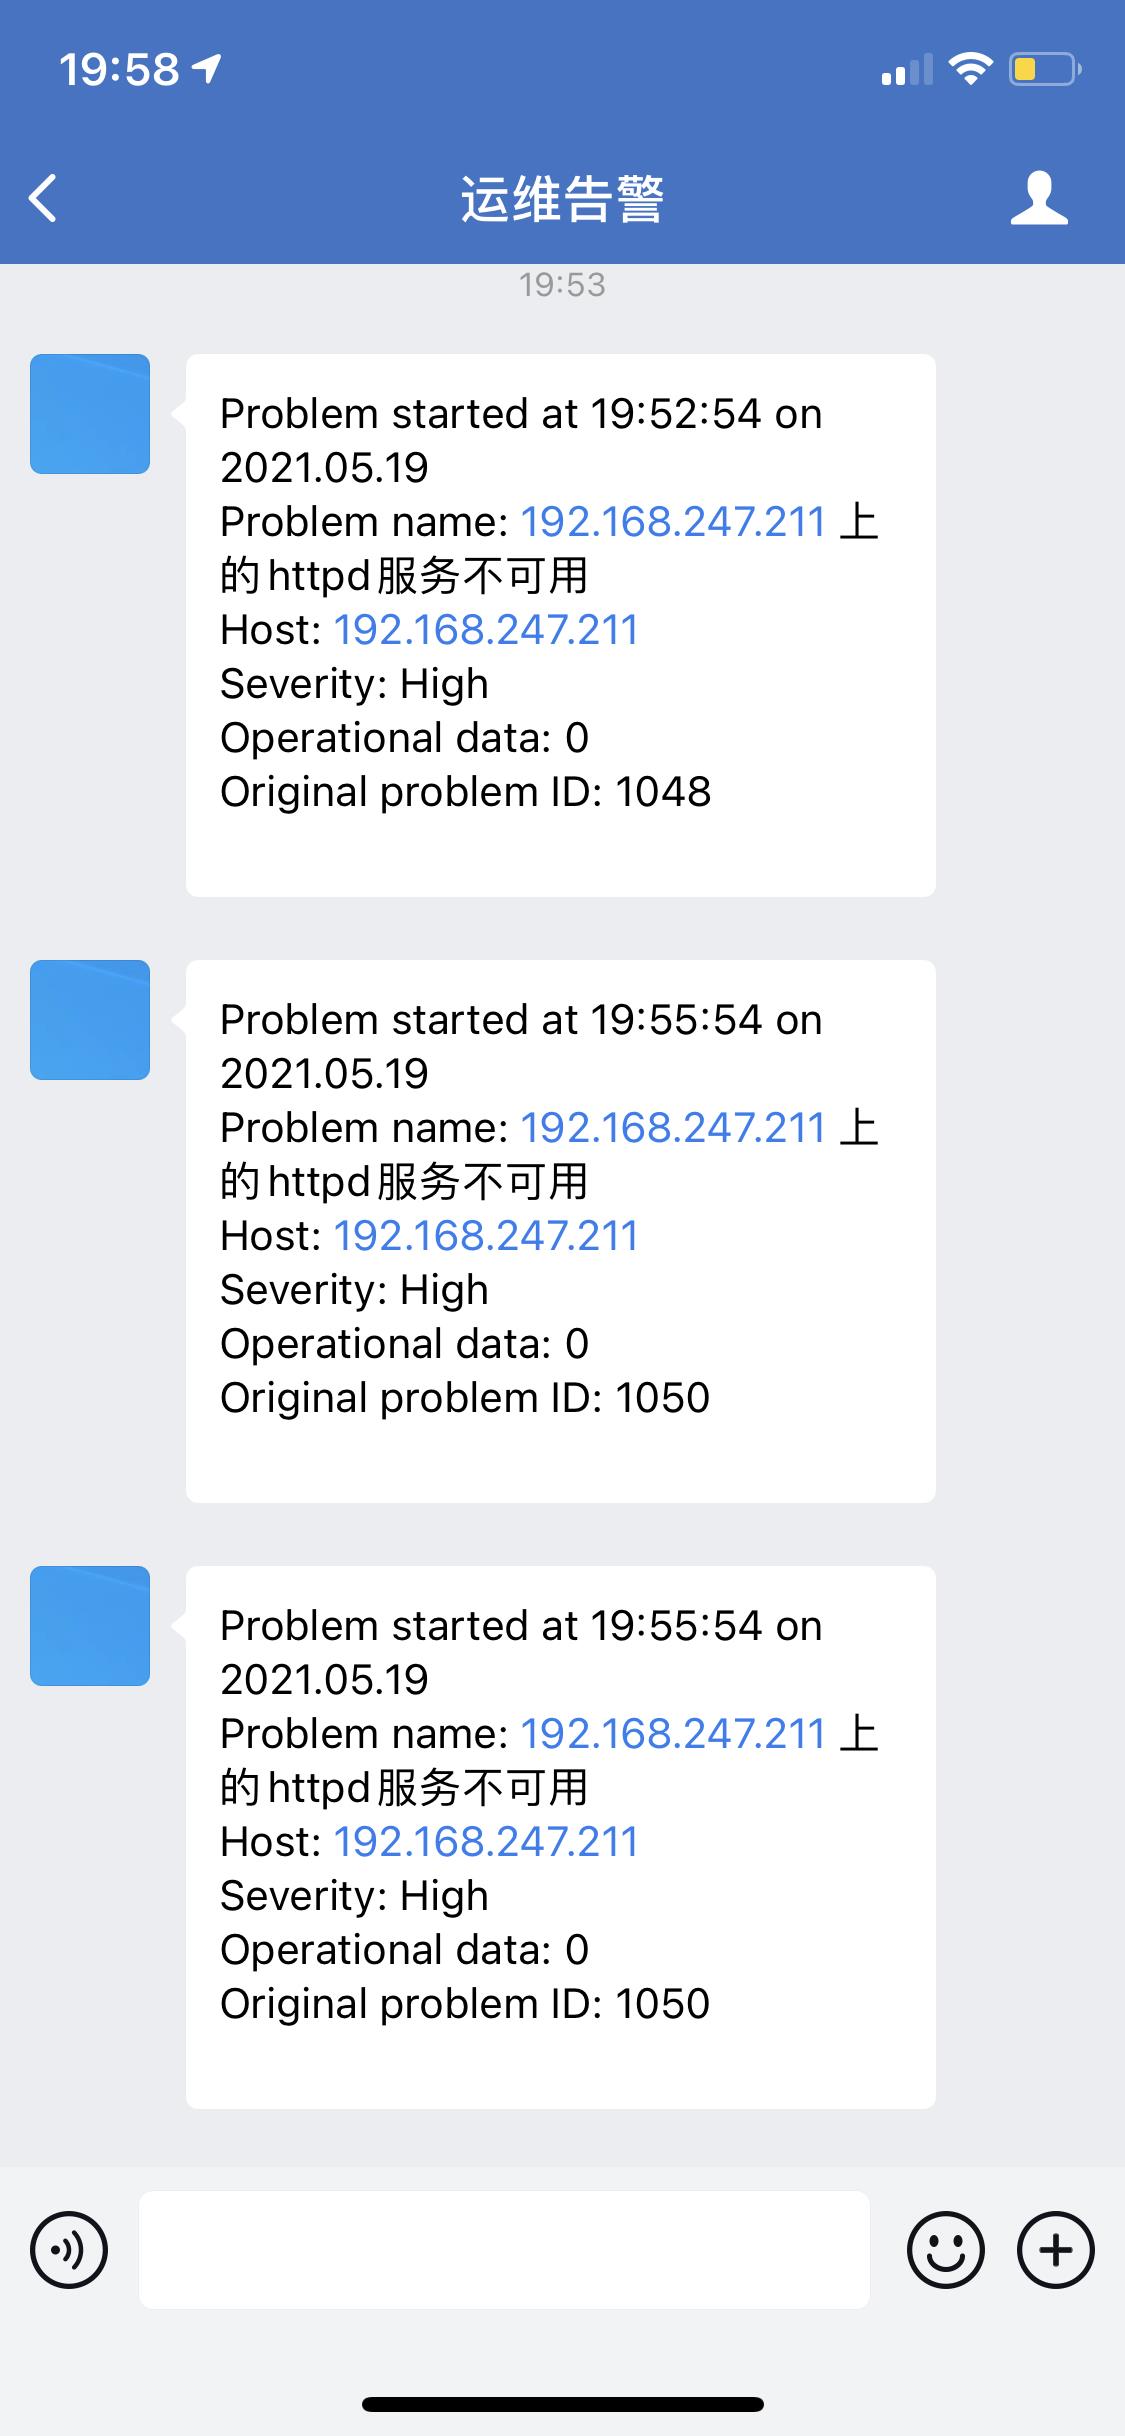
测试验证
[root@client ~]# apachectl stop
[root@client ~]# ss -anlt
State   Recv-Q  Send-Q   Local Address:Port      Peer Address:Port  Process
LISTEN  0       128            0.0.0.0:22             0.0.0.0:*
LISTEN  0       128            0.0.0.0:10050          0.0.0.0:*
LISTEN  0       80                   *:3306                 *:*
LISTEN  0       128               [::]:22                [::]:*

自定义监控日志文件
编写判断日志文件是否有报错
[root@client ~]# vim /scripts/log.py
#!/usr/bin/python3
import sys
import re
def prePos(seekfile):
    global curpos
    try:
        cf = open(seekfile)
    except IOError:
        curpos = 0
        return curpos
    except FileNotFoundError:
        curpos = 0
        return curpos
    else:
        try:
            curpos = int(cf.readline().strip())
        except ValueError:
            curpos = 0
            cf.close()
            return curpos
        cf.close()
    return curpos
def lastPos(filename):
    with open(filename) as lfile:
        if lfile.readline():
            lfile.seek(0,2)
        else:
            return 0
        lastPos = lfile.tell()
    return lastPos
def getSeekFile():
    try:
        seekfile = sys.argv[2]
    except IndexError:
        seekfile = '/tmp/logseek'				//默认将此次读取到了多少条信息存放到此文件中
    return seekfile
def getKey():
    try:
        tagKey = str(sys.argv[3])
    except IndexError:
        tagKey = 'Error'				//默认报错信息为Error
    return tagKey
def getResult(filename,seekfile,tagkey):
    destPos = prePos(seekfile)
    curPos = lastPos(filename)
    if curPos < destPos:
        curpos = 0
    try:
        f = open(filename)
    except IOError:
        print('Could not open file: %s' % filename)
    except FileNotFoundError:
        print('Could not open file: %s' % filename)
    else:
        f.seek(destPos)
        while curPos != 0 and f.tell() < curPos:
            rresult = f.readline().strip()
            global result
            if re.search(tagkey, rresult):
                result = 1
                break
            else:
                result = 0
        with open(seekfile,'w') as sf:
            sf.write(str(curPos))
    finally:
        f.close()
    return result
if __name__ == "__main__":
    result = 0
    curpos = 0
    tagkey = getKey()
    seekfile = getSeekFile()
    result = getResult(sys.argv[1],seekfile,tagkey)
    print(result)
给脚本加执行权限
[root@client ~]# chmod +x /scripts/log.py
[root@client ~]# ll /scripts/log.py
-rwxr-xr-x. 1 root root 1850 5月  19 20:22 /scripts/log.py
测试zabbix用户是否能使用此脚本
[root@client ~]# dnf -y module install python38
[root@client ~]# setfacl -m u:zabbix:rx /var/log/httpd/
[root@client ~]# mkdir /zabbix_item_log
[root@client ~]# chown -R zabbix.zabbix /zabbix_item_log/
[zabbix@client root]$ python3 /scripts/log.py /var/log/httpd/error_log /zabbix_item_log/logseek Failed
0
在zabbix客户端写入此条自定义监控并且在服务端测试是否可用
客户端:
[root@client ~]# vim /usr/local/etc/zabbix_agentd.conf
UserParameter=check_logs[*],/scripts/log.py $1 $2 $3
……
[root@client ~]# pkill zabbix_agent
[root@client ~]# zabbix_agentd
[root@client ~]# ss -anlt
State   Recv-Q  Send-Q   Local Address:Port      Peer Address:Port  Process
LISTEN  0       128            0.0.0.0:9000           0.0.0.0:*
LISTEN  0       128            0.0.0.0:22             0.0.0.0:*
LISTEN  0       128            0.0.0.0:10050          0.0.0.0:*
LISTEN  0       80                   *:3306                 *:*
LISTEN  0       128                  *:80                   *:*
LISTEN  0       128               [::]:22                [::]:*
服务端:
[root@zabbix ~]# zabbix_get -s 192.168.247.211 -k check_logs['/var/log/httpd/error_log','zabbix_item_log/logseek','Failed']
0
客户端:
[root@client ~]# echo 'Failed' >> /var/log/httpd/error_log
服务端:
[root@zabbix ~]# zabbix_get -s 192.168.247.211 -k check_logs['/var/log/httpd/error_log','zabbix_item_log/logseek','Failed']
1
客户端:
[root@client ~]# cat /zabbix_item_log/logseek
6020
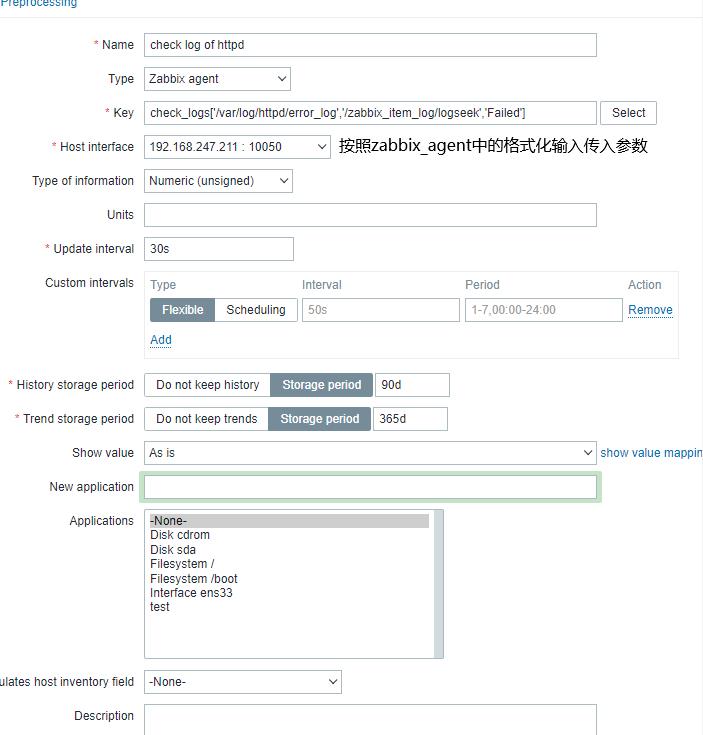
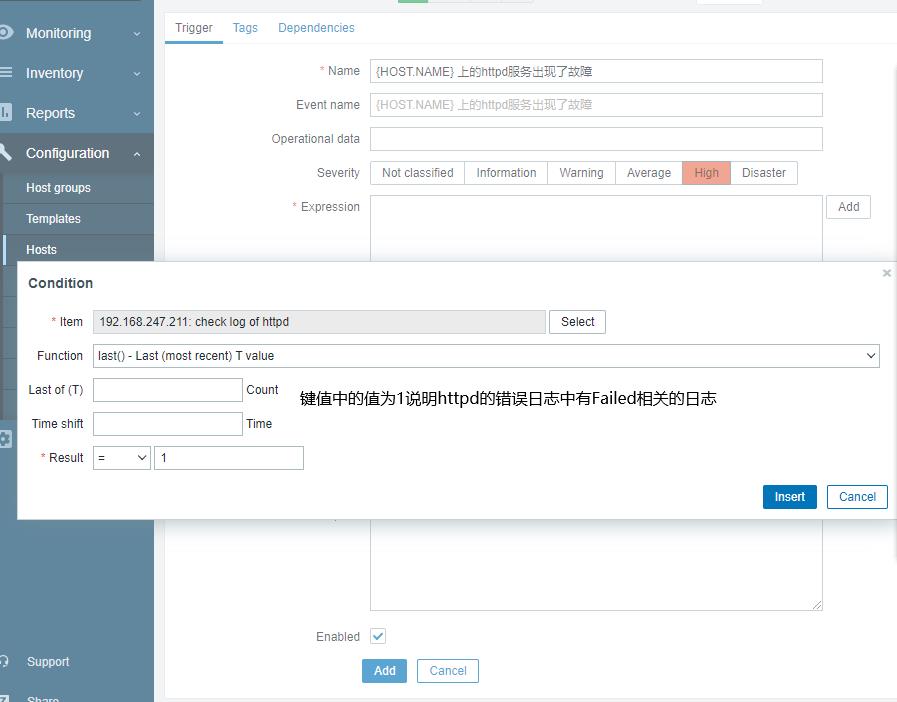
在zabbix页面上创建监控项
创建触发器
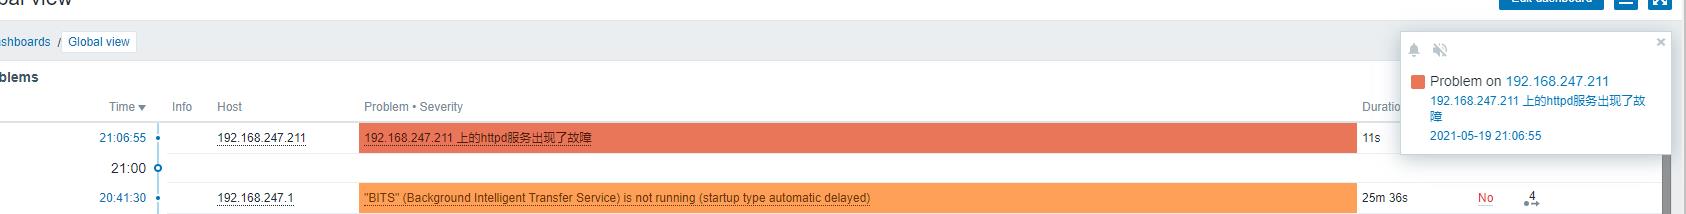
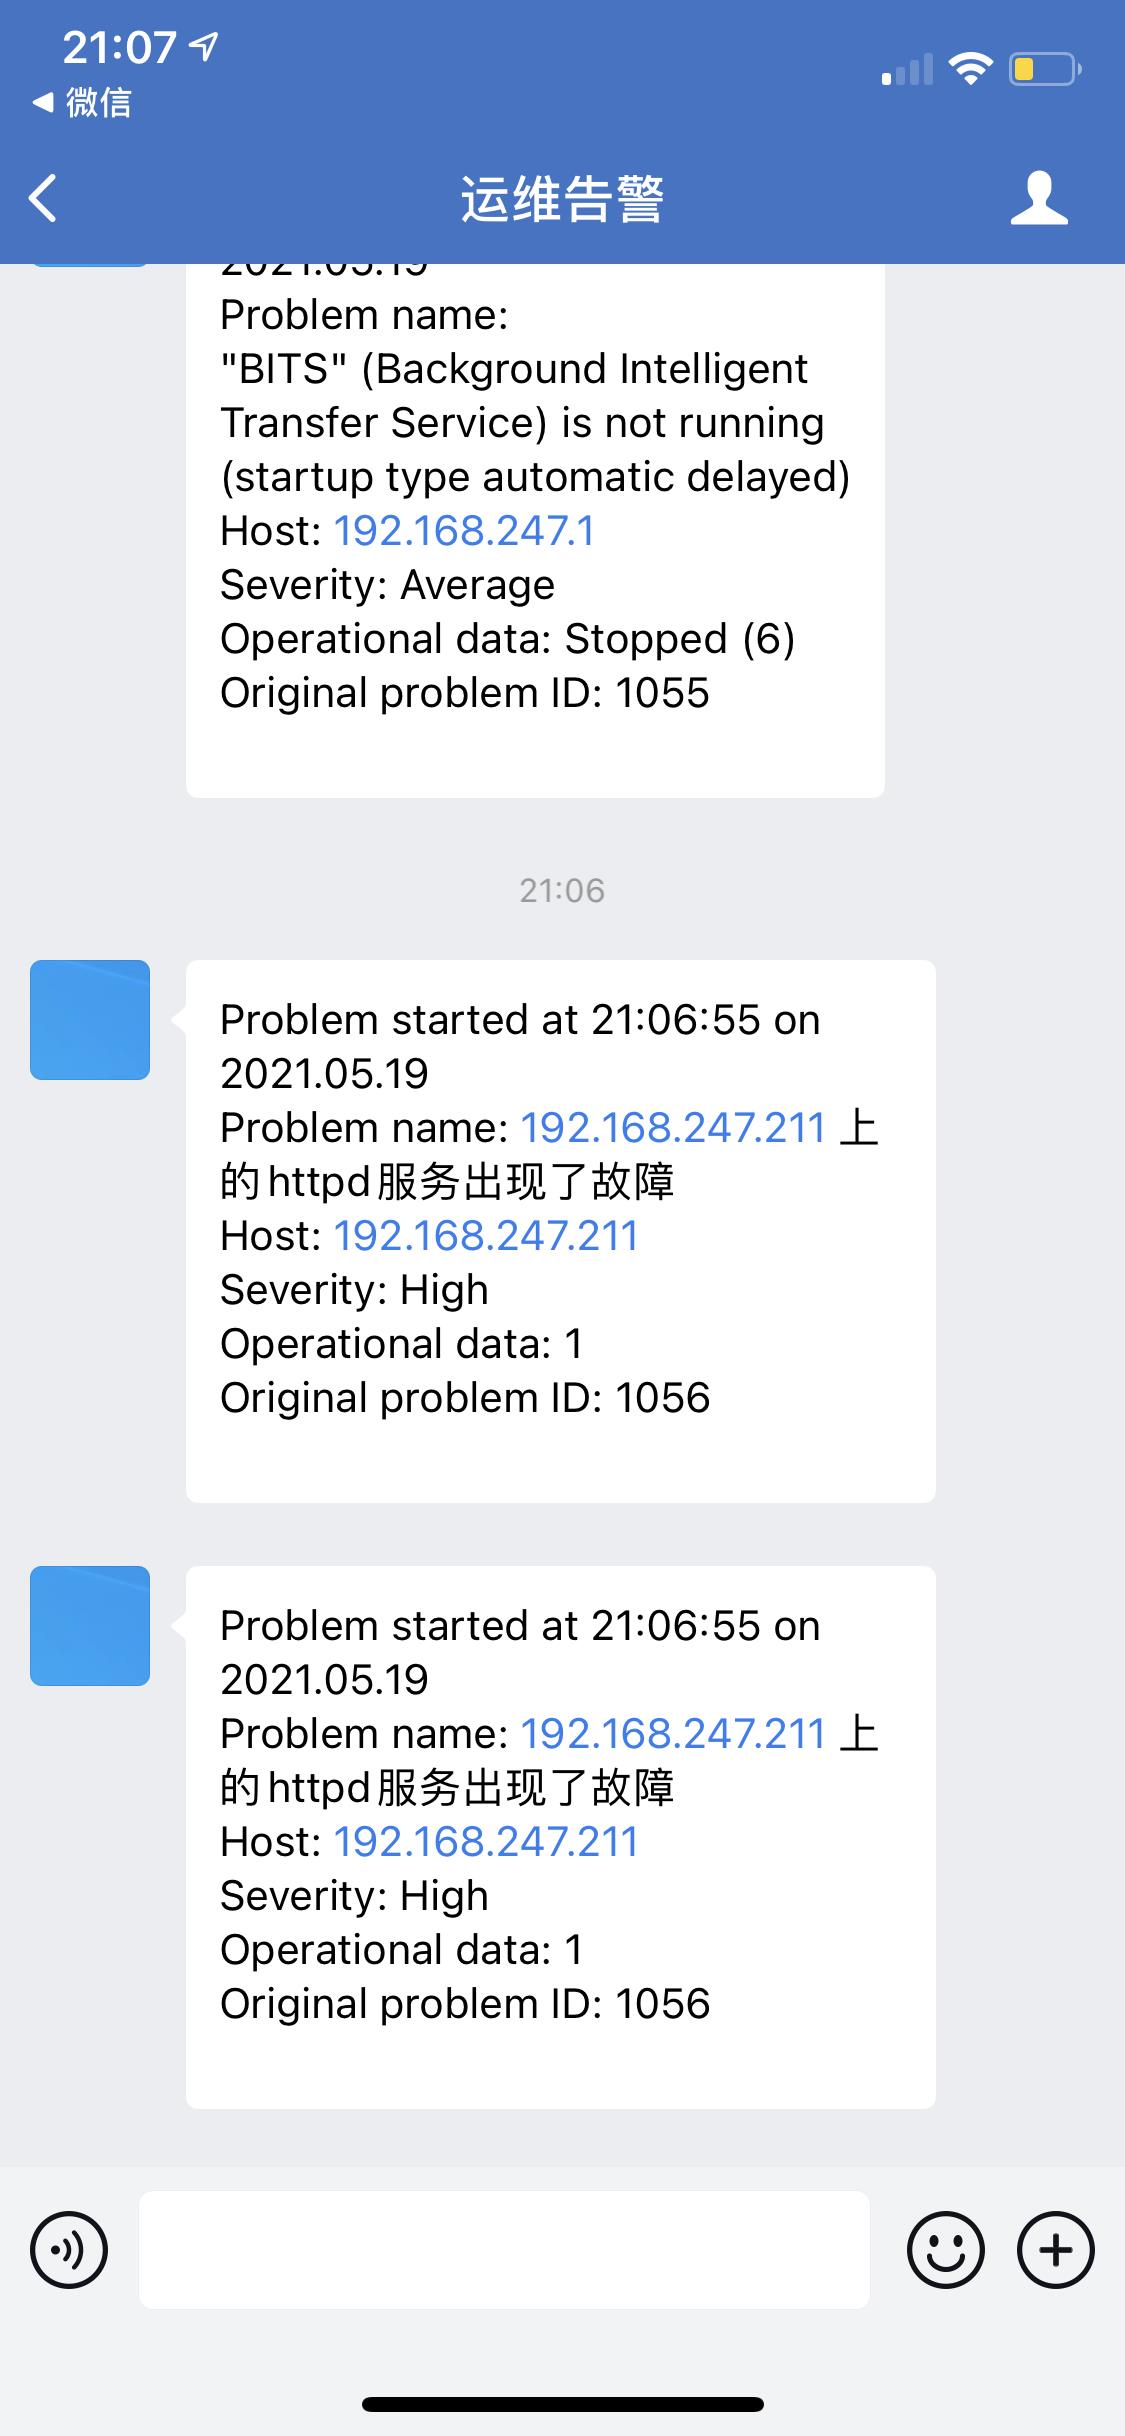
测试验证
[root@client ~]# echo 'Failed' >> /var/log/httpd/error_log
mysql主从状态的监控
实验环境说明:
| 主机名:主机IP | 角色 |
|---|---|
| zabbix:192.168.247.215 | zabbix_server端 |
| client:192.168.247.211 | zabbix_agent端、mysql从数据库 |
| client1:192.168.247.214 | mysql主数据库 |
配置主数据库的root账号在从数据库可以远程登录且不需要密码
client1:
mysql> create user 'root'@'192.168.247.211' identified by 'hanao.';
mysql> grant all on *.* to 'root'@'192.168.247.211';
Query OK, 0 rows affected (0.01 sec)
mysql> flush privileges;
Query OK, 0 rows affected (0.00 sec)
client:
[root@client ~]# vim /etc/my.cnf
[mysqld]
basedir = /usr/local/mysql
datadir = /opt/mysql_data
socket = /tmp/mysql.sock
port = 3306
pid-file = /opt/mysql_data/mysql.pid
user = mysql
skip-name-resolve
server-id=2
relay-log=slave_relay_bin
[client]
user=root
password=hanao.
编写判断主从状态的脚本
client:
[root@client ~]# vim /scripts/check_mysql_replistatus.sh
#!/bin/bash
status=$(mysql -e 'show slave status\\G' | grep "Running: Yes" |awk '{print $2}' | grep -c 'Yes')
if  [ $status == 2 ];then
        echo '0'
else
        echo '1'
fi
给脚本加执行权限
[root@client ~]# chmod +x /scripts/check_mysql_replistatus.sh
测试zabbix用户是否能使用此脚本
[root@client ~]# su - zabbix -s /bin/bash
[zabbix@client root]$ /scripts/check_mysql_replistatus.sh
0
在zabbix客户端写入此条自定义监控并且在服务端测试是否可用
client:
[root@client ~]# vim /usr/local/etc/zabbix_agentd.conf
UserParameter=check_mysql_replication,/scripts/check_mysql_replistatus.sh
[root@client ~]# pkill zabbix_agent
[root@client ~]# zabbix_agentd
zabbix:
[root@zabbix ~]# zabbix_get -s 192.168.247.211 -k check_mysql_replication
0
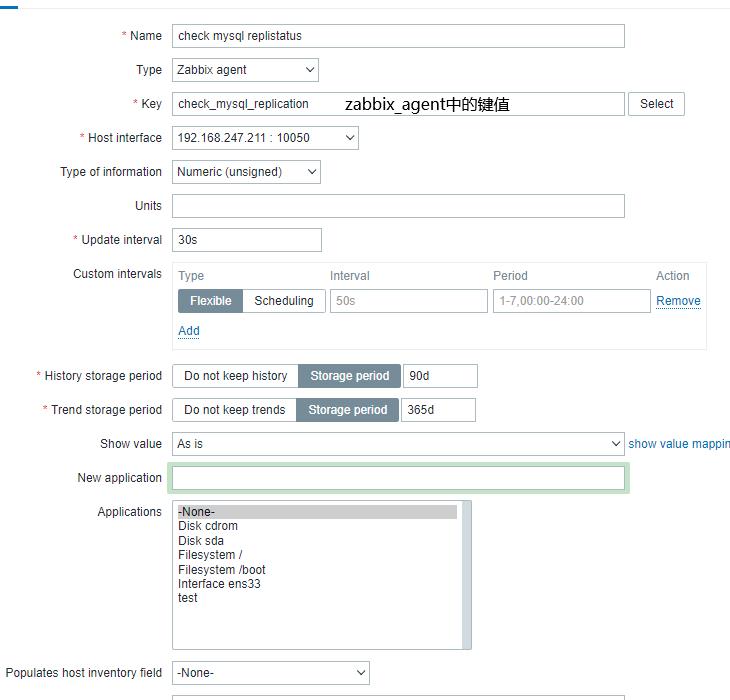
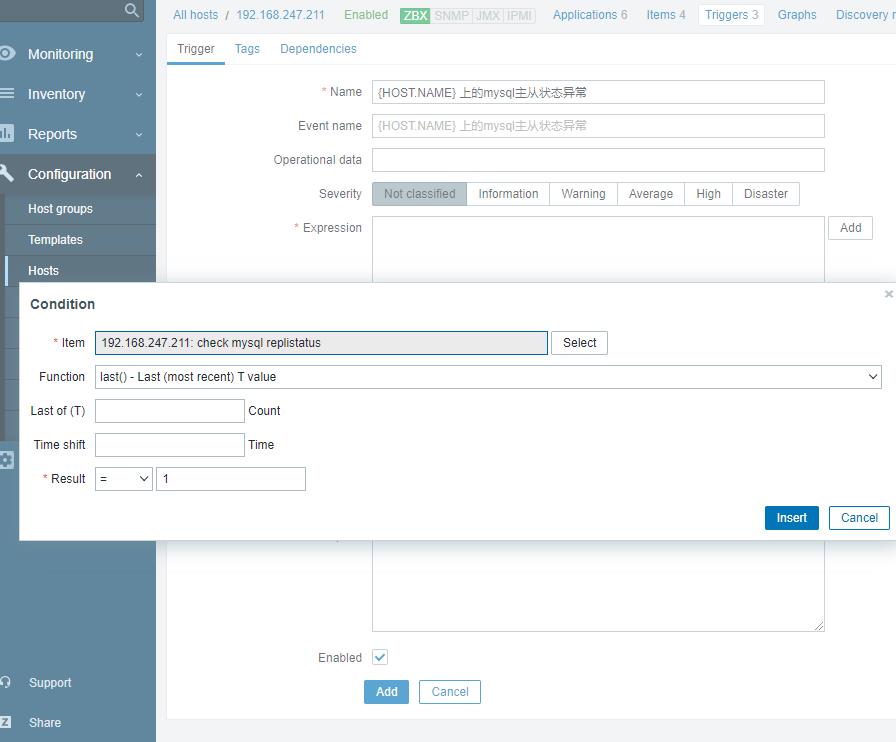
在zabbix页面上创建监控项
创建触发器
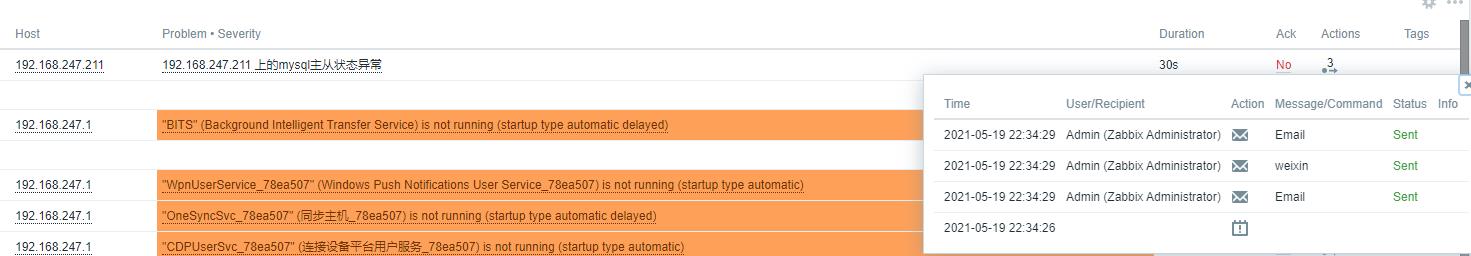
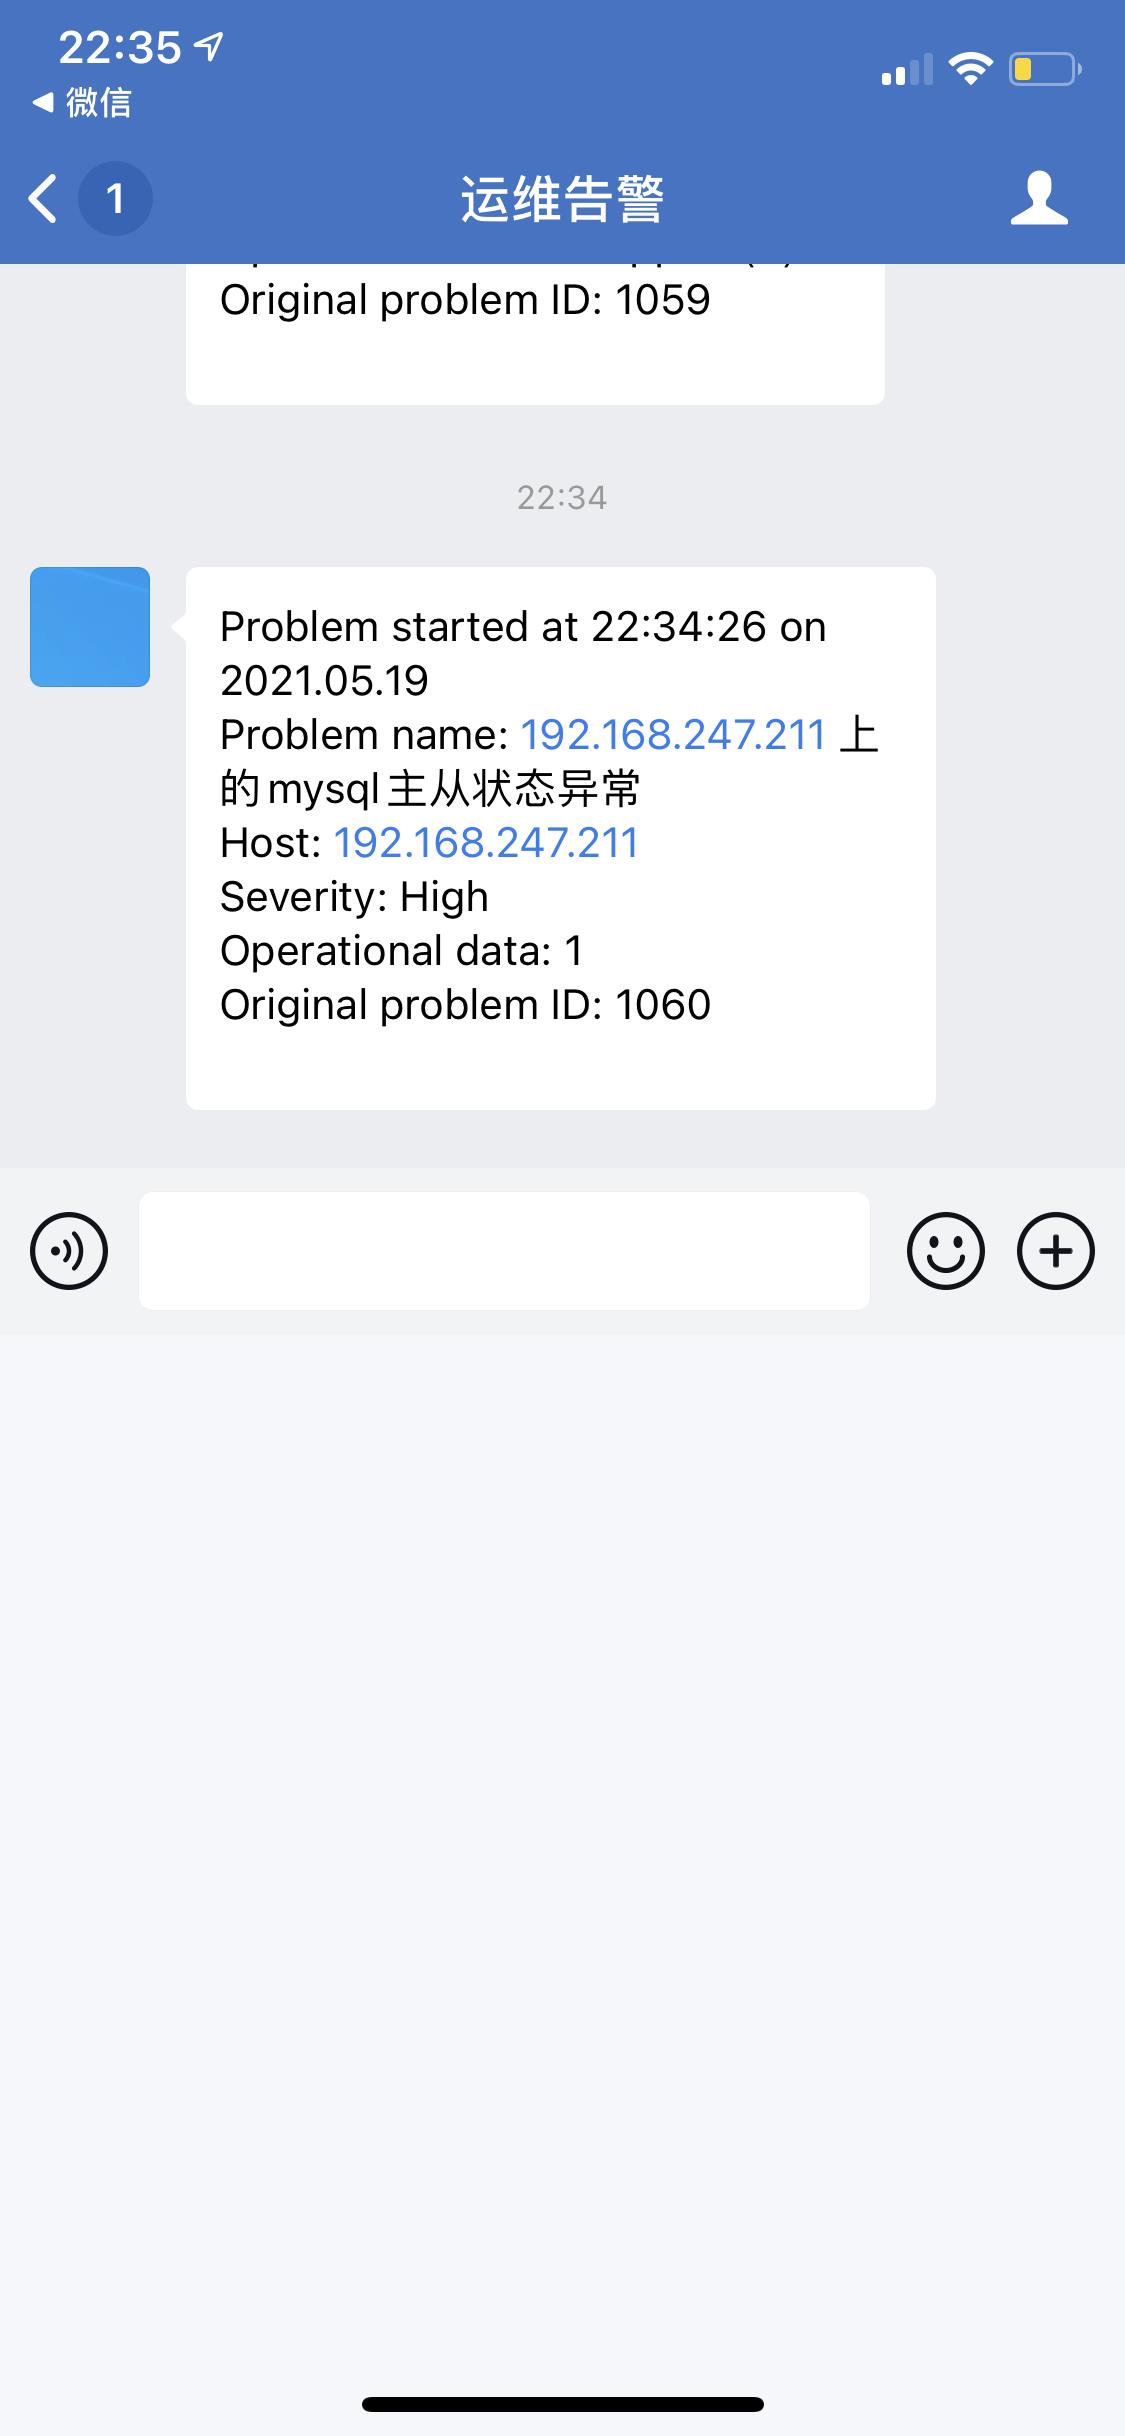
测试验证
client:
mysql> stop slave;
Query OK, 0 rows affected (0.00 sec)
mysql> show slave status\\G;
             Slave_IO_Running: No
            Slave_SQL_Running: No
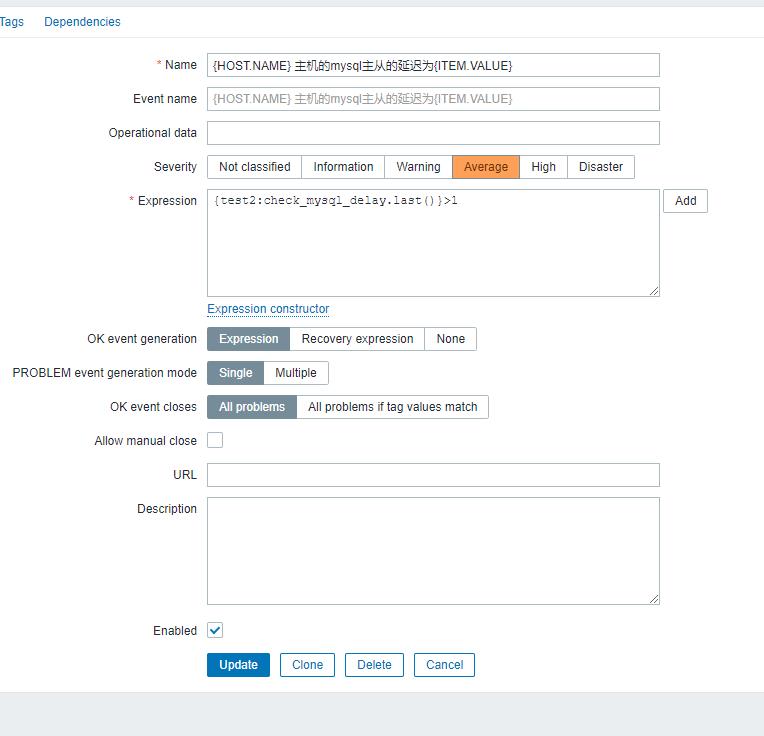
mysql主从延迟的监控
编写查看延迟的脚本
[root@client ~]# vim /scripts/check_mysql_delay.sh
#!/bin/bash
delay=$(mysql -e 'show slave status\\G' | grep "Seconds_Behind_Master" |awk '{print $2}')
echo $delay
给脚本加执行权限
[root@client ~]# chmod +x /scripts/check_mysql_delay.sh
测试zabbix用户是否能使用此脚本
[root@client ~]# su - zabbix -s /bin/bash
[zabbix@client root]$ /scripts/check_mysql_delay.sh
0
在zabbix客户端写入此条自定义监控并且在服务端测试是否可用
client:
[root@client ~]# vim /usr/local/etc/zabbix_agentd.conf
UserParameter=check_mysql_delay,/scripts/check_mysql_delay.sh
[root@client ~]# pkill zabbix_agent
[root@client ~]# zabbix_agentd
zabbix:
[root@zabbix ~]# zabbix_get -s 192.168.247.211 -k check_mysql_delay
0
在zabbix页面上创建监控项
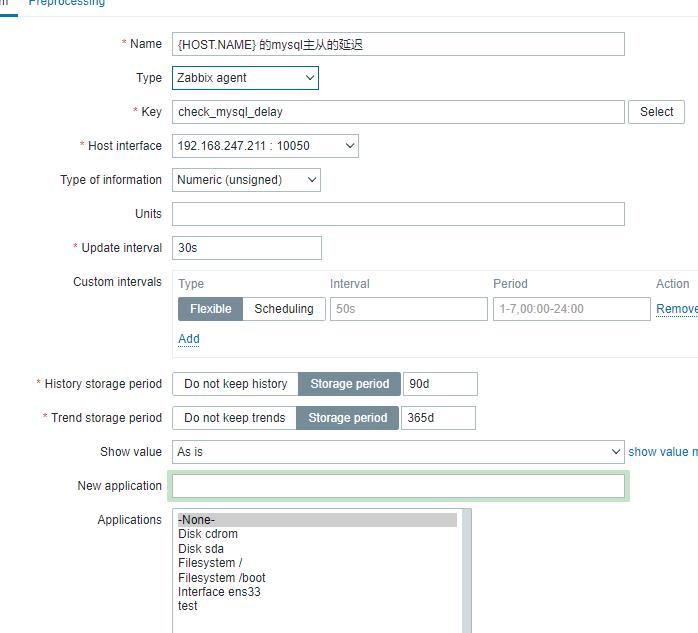
创建触发器
以上是关于zabbix自定义监控的主要内容,如果未能解决你的问题,请参考以下文章