python进行探索性数据分析EDA(Exploratory Data Analysis)分析
Posted Data+Science+Insight
tags:
篇首语:本文由小常识网(cha138.com)小编为大家整理,主要介绍了python进行探索性数据分析EDA(Exploratory Data Analysis)分析相关的知识,希望对你有一定的参考价值。
python进行探索性数据分析EDA(Exploratory Data Analysis)分析
show holy respect to python community, for there dedication and wisdom
数据集相关:
第一,UCL wine数据集:
UCI数据集是一个常用的机器学习标准测试数据集,是加州大学欧文分校(University of CaliforniaIrvine)提出的用于机器学习的数据库。机器学习算法的测试大多采用的便是UCI数据集了,其重要之处在于“标准”二字,新编的机器学习程序可以采用UCI数据集进行测试,类似的机器学习算法也可以一较高下。其官网地址如下:
website: UCI Machine Learning Repository
字段相关:
固定酸度:大多数与葡萄酒有关的酸或固定的或不挥发的(不易蒸发)
挥发性酸味:葡萄酒中醋酸的含量过高,会产生令人不快的醋味
柠檬酸:少量的柠檬酸可以增加葡萄酒的新鲜度和风味
残糖:发酵结束后的残糖量,每升1克以下的酒很少,45克以上的酒被认为是甜的
氯化物:酒中盐的含量
游离二氧化硫:SO2以游离形式存在于SO2分子(作为溶解气体)与亚硫酸氢盐离子之间的平衡状态;它可以防止葡萄酒中的微生物生长和氧化
总二氧化硫:SO2游离态和结合态的量;在低浓度的情况下,SO2在葡萄酒中几乎检测不到,但当游离SO2浓度超过50ppm时,SO2在葡萄酒的嗅觉和味觉中就会变得明显
密度:根据酒精和糖含量的百分比,水的密度接近于水的密度
pH值:描述葡萄酒的酸性或碱性程度,从0(非常酸)到14(非常碱性);大多数葡萄酒的pH值在3-4之间
硫酸盐:一种葡萄酒添加剂,可以提高二氧化硫气体(SO2)水平,起到抗菌和抗氧化剂的作用
酒精:葡萄酒中酒精含量的百分比
质量:输出变量(根据感官数据,评分0 - 10),有专门的评酒师和调酒师的职业
第二,Kaggle 泰坦尼克号数据集:
泰坦尼克号的沉没是历史上最为人熟知的海难事件之一。 1912 年 4 月 15 日,在她的处女航中,泰坦尼克号在与冰山相撞后沉没,在船上的 2224 名乘客和机组人员中,共造成 1502 人死亡。这场耸人听闻的悲剧震惊了国际社会,从而促进了船舶安全规定的完善。
造成海难失事的原因之一是乘客和机组人员没有足够的救生艇。尽管在沉船事件中幸存下有一些运气因素,但有些人比其他人更容易存活下来,比如女人,孩子和上流社会。
在这个挑战中,要求完成哪些人可能存活下来的分析。特别的,要求运用机器学习工具来预测哪些乘客能够幸免于悲剧。
字段相关:
passengerid: 乘客 ID
class: 舱位等级 (1 = 1st, 2 = 2nd, 3 = 3rd)**
name: 乘客姓名
sex: 性别
age: 年龄
sibsp: 在船上的兄弟姐妹/配偶个数
parch: 在船上的父母/小孩个数
ticket: 船票信息
fare: 票价
cabin: 客舱
embarked: 登船港口 (C = Cherbourg, Q = Queenstown, S = Southampton)
survived: 变量预测为值 0 或 1(这里 1 表示幸存,0 表示遇难)
画图工具相关:
anaconda
Pandas
Numpy
Matplotlib
Seaborn
Bokeh
plotly
# 导入相关包
import pandas as pd
import numpy as np
import matplotlib.pyplot as plt
import seaborn as sns
# 绘制标称变量关系图
def plot_categoricals(x, y, data, annotate = True):
    """Plot counts of two categoricals.
    Size is raw count for each grouping.
    Percentages are for a given value of y."""
    # dict vectorizer
    # Raw counts
    raw_counts = pd.DataFrame(data.groupby(y)[x].value_counts(normalize = False))
    raw_counts = raw_counts.rename(columns = {x: 'raw_count'})

    # Calculate counts for each group of x and y
    counts = pd.DataFrame(data.groupby(y)[x].value_counts(normalize = True))

    # Rename the column and reset the index
    counts = counts.rename(columns = {x: 'normalized_count'}).reset_index()
    counts['percent'] = 100 * counts['normalized_count']

    # Add the raw count
    counts['raw_count'] = list(raw_counts['raw_count'])

    plt.figure(figsize = (14, 10))
    # Scatter plot sized by percent
    plt.scatter(counts[x], counts[y], edgecolor = 'k', color = 'lightgreen',
                s = 100 * np.sqrt(counts['raw_count']), marker = 'o',
                alpha = 0.6, linewidth = 1.5)

    if annotate:
        # Annotate the plot with text
        for i, row in counts.iterrows():
            # Put text with appropriate offsets
            plt.annotate(xy = (row[x] - (1 / counts[x].nunique()),
                               row[y] - (0.15 / counts[y].nunique())),
                         color = 'navy',
                         s = f"{round(row['percent'], 1)}%")

    # Set tick marks
    plt.yticks(counts[y].unique())
    plt.xticks(counts[x].unique())

    # Transform min and max to evenly space in square root domain
    sqr_min = int(np.sqrt(raw_counts['raw_count'].min()))
    sqr_max = int(np.sqrt(raw_counts['raw_count'].max()))

    # 5 sizes for legend
    msizes = list(range(sqr_min, sqr_max,
                        int(( sqr_max - sqr_min) / 5)))
    markers = []

    # Markers for legend
    for size in msizes:
        markers.append(plt.scatter([], [], s = 100 * size,
                                   label = f'{int(round(np.square(size) / 100) * 100)}',
                                   color = 'lightgreen',
                                   alpha = 0.6, edgecolor = 'k', linewidth = 1.5))

    # Legend and formatting
    plt.legend(handles = markers, title = 'Counts',
               labelspacing = 3, handletextpad = 2,
               fontsize = 16,
               loc = (1.10, 0.19))

    plt.annotate(f'* Size represents raw count while % is for a given y value.',
                 xy = (0, 1), xycoords = 'figure points', size = 10)

    # Adjust axes limits
    plt.xlim((counts[x].min() - (6 / counts[x].nunique()),
              counts[x].max() + (6 / counts[x].nunique())))
    plt.ylim((counts[y].min() - (4 / counts[y].nunique()),
              counts[y].max() + (4 / counts[y].nunique())))
    plt.grid(None)
    plt.xlabel(f"{x}"); plt.ylabel(f"{y}"); plt.title(f"{y} vs {x}");
# 导入数据并进行查看
df = pd.read_csv('winequality-white.csv', sep=';')
df.head()
df.tail()
df.sample(5)
#检查缺失值的情况:
# Check if any of the following is NULL
df.isnull().any()
#使用热力图查看确实值得程度
sns.heatmap(df.isnull(), cbar=False, yticklabels=False, cmap='viridis')
#查看某些标称变量的独特值得个数、总数等
df.quality.unique()
df.quality.nunique()
df.quality.value_counts()
# 数据类型查看、列名称查看
df.dtypes
df.columns
#获取连续变量的统计信息
df.describe()
#绘制直方图:
df['fixed acidity'].plot(kind = 'hist',figsize=(20, 7), )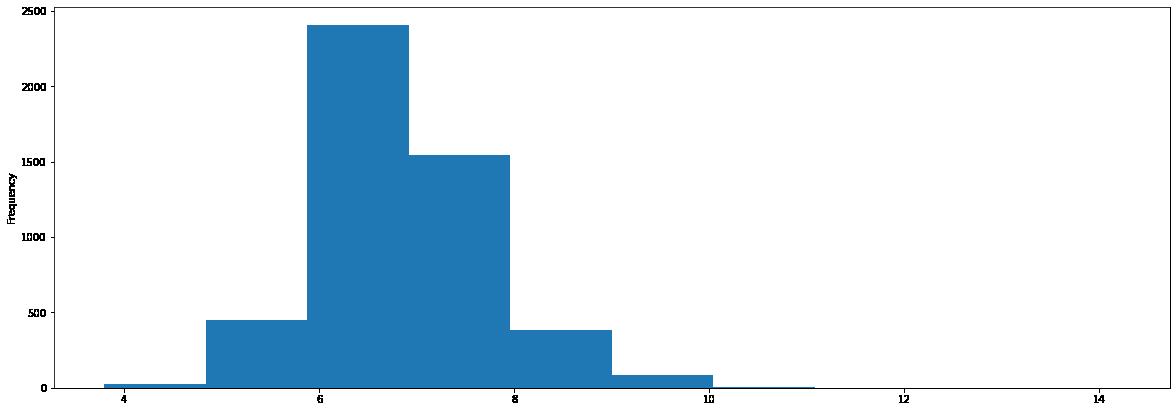
#绘制密度图

#绘制箱图
import seaborn as sns
plt.figure(figsize=(10, 7))

sns.boxplot(x=df['alcohol'])
# 绘制箱图,并把图像竖过来
import seaborn as sns
plt.figure(figsize=(10, 7))
sns.boxplot(data = df,y='alcohol',)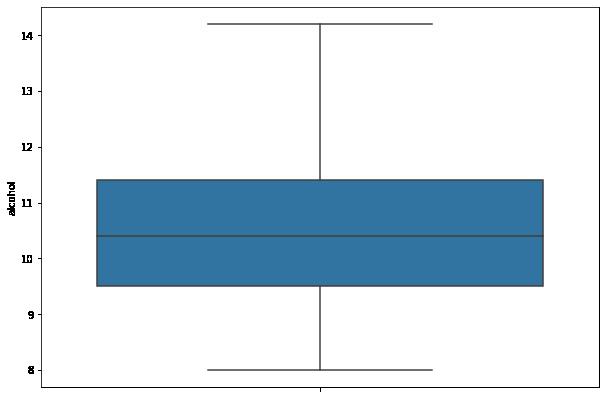
# 散点图,scatter plot绘制
import matplotlib.pyplot as plt
fig, ax = plt.subplots(figsize=(16,8))
ax.scatter(df['volatile acidity'] , df['citric acid'])
ax.set_xlabel('volatile acidity')
ax.set_ylabel('citric acid')
plt.show()
#回归图绘制
plt.figure(figsize=(25, 7))
sns.regplot(x="alcohol", y="density", data=df);
#直方图绘制
def bar_plot(df,key):
    df[key].value_counts().sort_index().plot.bar(figsize = (12, 5),
                      edgecolor = 'k', linewidth = 2)

    # Formatting
    plt.xlabel(key);
    plt.ylabel('COUNT');
    plt.xticks(rotation = 60)
    plt.title('BAR PLOT for ' + key);
    plt.show()


bar_plot(df,'quality')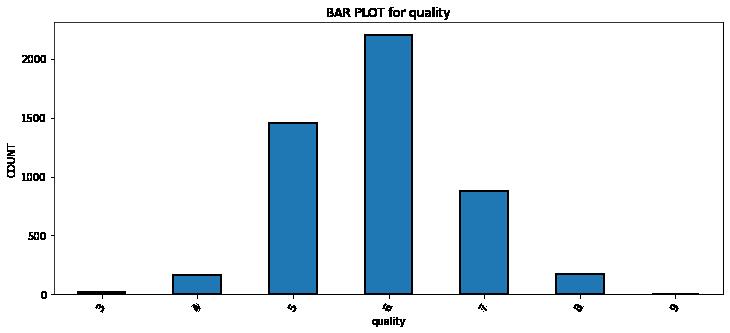
#多箱图绘制
def plot_box_plot2(df,key,value):
    import copy
    box = copy.deepcopy(df)
    box[value] = box[value].astype('float')
    sns.set_style('whitegrid',{'font.sans-serif':['SimHei','Arial']})
    sns.set_context("talk")
    fig,axes=plt.subplots(1,1,figsize = (25,7))
    sns.boxplot(data = box, x=key, y=value)
    plt.show()

plot_box_plot2(df,'quality','citric acid')
plt.figure(figsize=(25, 7))
# plt.style.use('seaborn-white')
ax = sns.boxplot(x="quality", y="free sulfur dioxide", data=df)
#绘制小提琴图
plt.figure(figsize=(25, 7))
sns.set_theme(style="whitegrid")

# Draw a nested violinplot and split the violins for easier comparison
sns.violinplot(data=df, x="quality", y="density",
               split=True, inner="quart", linewidth=1,)
sns.despine(left=True)
#绘制相关性图:
plt.figure(figsize=(15,8))
sns.heatmap(df.corr(),cmap='Greens',annot=False)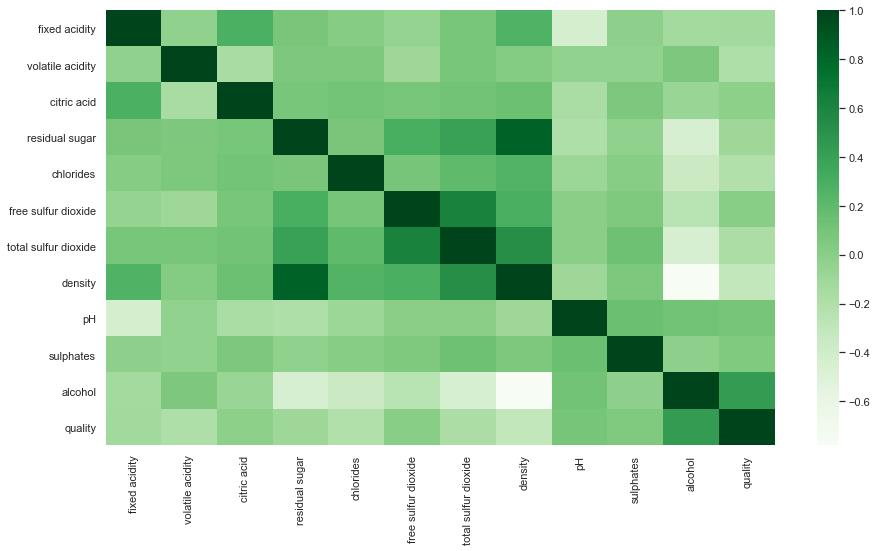
#绘制相关性图,并显示相关性数值
plt.figure(figsize=(15,15))
sns.heatmap(df.corr(), color='b', annot=True)
# 绘制标称变量的统计图
plt.figure(figsize=(15,5))
sns.countplot(x='quality', data = df)
# 绘制所有变量的箱型图:
plt.figure(figsize=(10,15))

for i, col in enumerate(list(df.columns.values)):
    plt.subplot(4,3,i+1)
    df.boxplot(col)
    plt.grid()
    plt.tight_layout()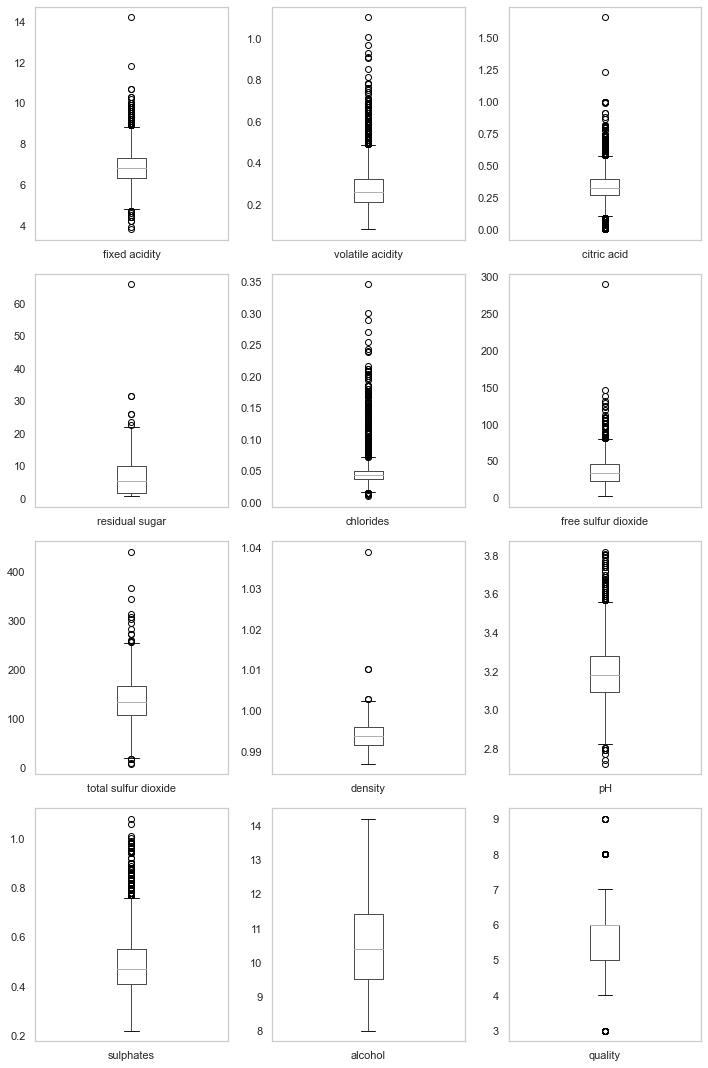
#绘制所有变量的直方图
plt.figure(figsize=(20,16))

for i,col in enumerate(list(df.columns.values)):
    plt.subplot(4,3,i+1)
    sns.distplot(df[col], color='b', kde=True, label='data')
    plt.grid()
plt.tight_layout() 
# pair plot
sns.pairplot(data=df, kind='scatter',diag_kind='kde')
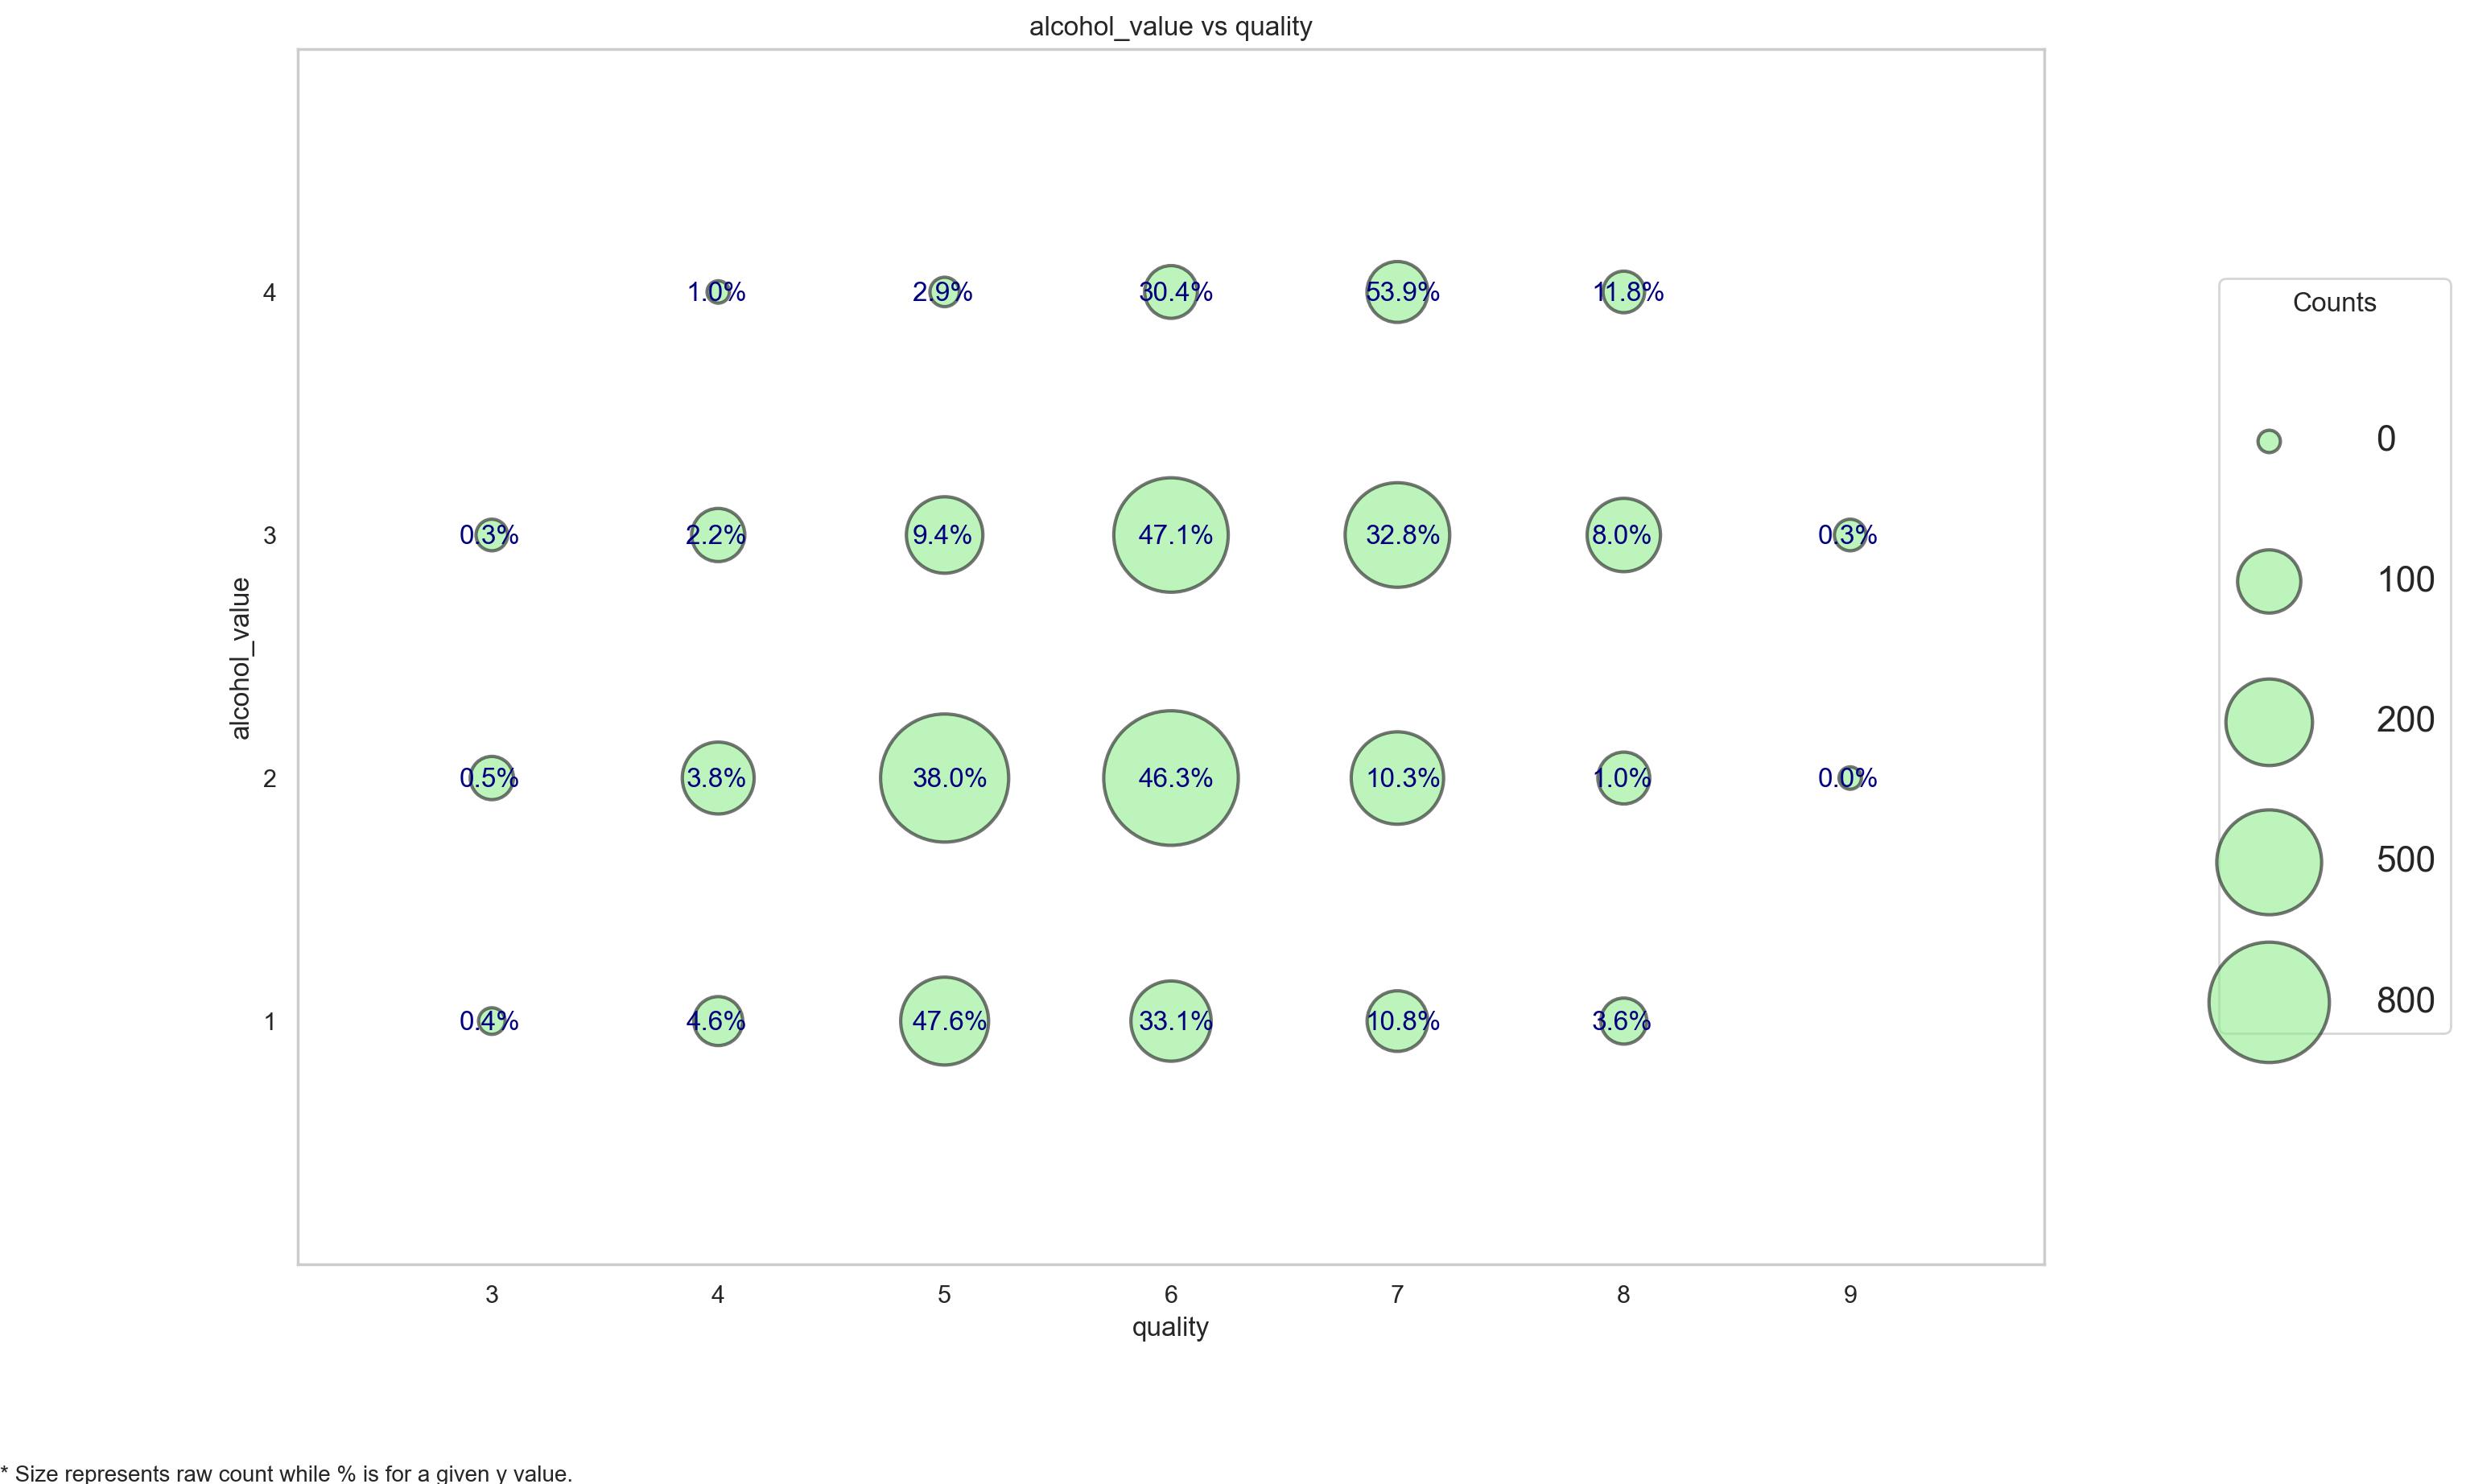
# 把变量离散化并构建离散变量关系图
df['alcohol_bin'] = pd.cut(df.alcohol,bins=[7,9,11,13,15],labels=['low','mid_low','mid_high','high'])
# df.insert(5,'Age Group',category)

df['alcohol_value'] = pd.cut(df.alcohol,bins=[7,9,11,13,15],labels=[1,2,3,4])
# df.insert(5,'Age Group',category)


plot_categoricals('alcohol_value', 'quality', df, annotate = True)
# 泰坦尼克号数据集
#加载数据
df=pd.read_excel(titanic.xls")

df.head()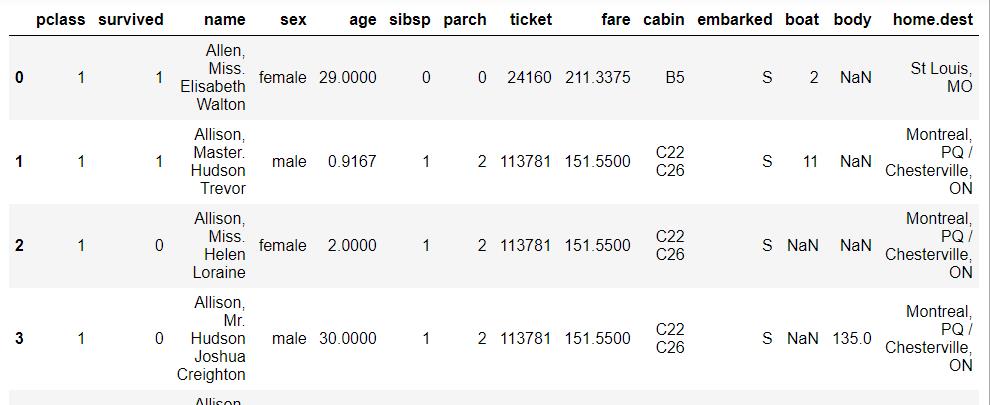
# df.tail()
#df.sample(5)
#df.columns
#df.shape
#df.info()
#获取统计信息
df.describe()
# describe默认只输出连续变量的信息,那么我想看其他变量类型的数据的统计信息:
df.describe(include=[bool,object])
#查看统计信息(单列)
df.fare.mean()

df[df['survived']==1].mean()

df[(df['survived'] == 1) & (df['pclass'] == 1)]['age'].max()

df[df['name'].apply(lambda name: name[0] == 'A')].head()
df[df['name'].apply(lambda name: name[0] == 'A')].head()
# replace函数:
x = {1 : 'Class I', 2 : 'Class II', 3:'Class III'}
df_new=df.replace({'pclass': x})
df_new.head()
# 获取聚合信息(groupby)

# 列联表信息
pd.crosstab(df['survived'], df['pclass'])
pd.crosstab(df['survived'], df['sex'], margins=True)

#透视表pivot
df.pivot_table(['fare','age'],['survived'],aggfunc='mean')
df.pivot_table(['fare','age'],['survived'],aggfunc='median')

#数据排序(基于某个特定字段)
df.sort_values(by=["fare"], ascending=False).head()
df.sort_values(by=["fare"], ascending=False).tail()
#缺失值情况可视化
import seaborn as sns
plt.rcParams['figure.dpi'] = 100# the dpi can be set to enhance the resolution of the image
# Congiguring retina format
%config InlineBackend.figure_format = 'retina'
sns.heatmap(df.isnull(), cmap='viridis',yticklabels=False)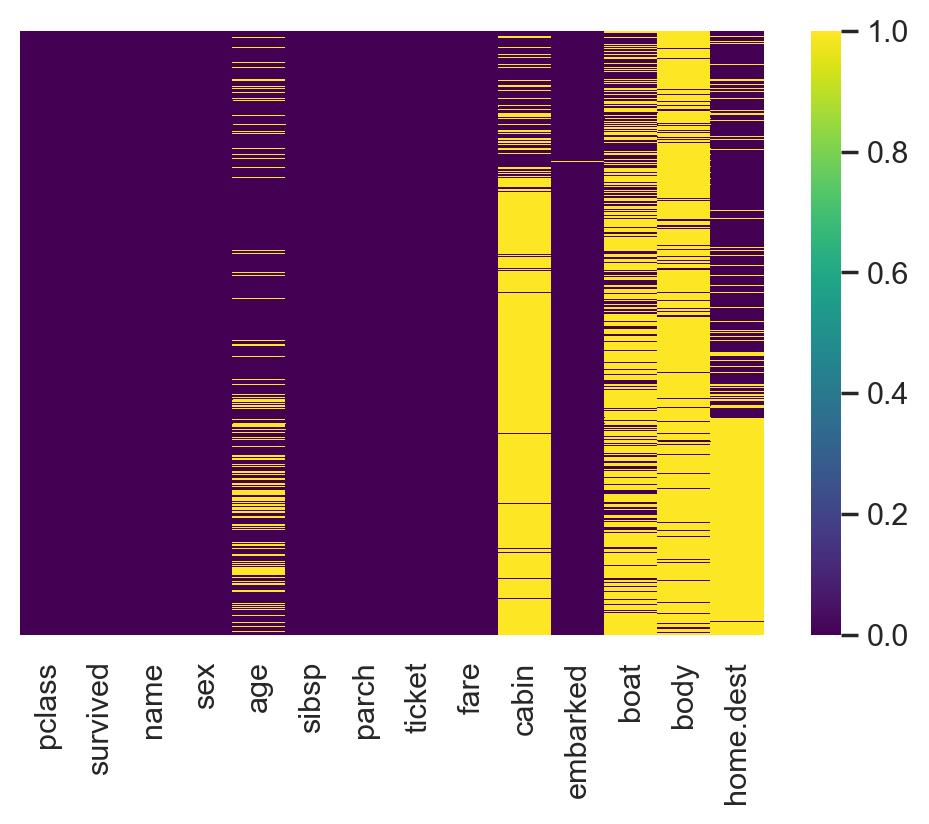
#生存情况统计
sns.countplot(x=df.survived)
#不同性别的生存情况
sns.countplot(data =df, x = 'survived',hue = 'sex')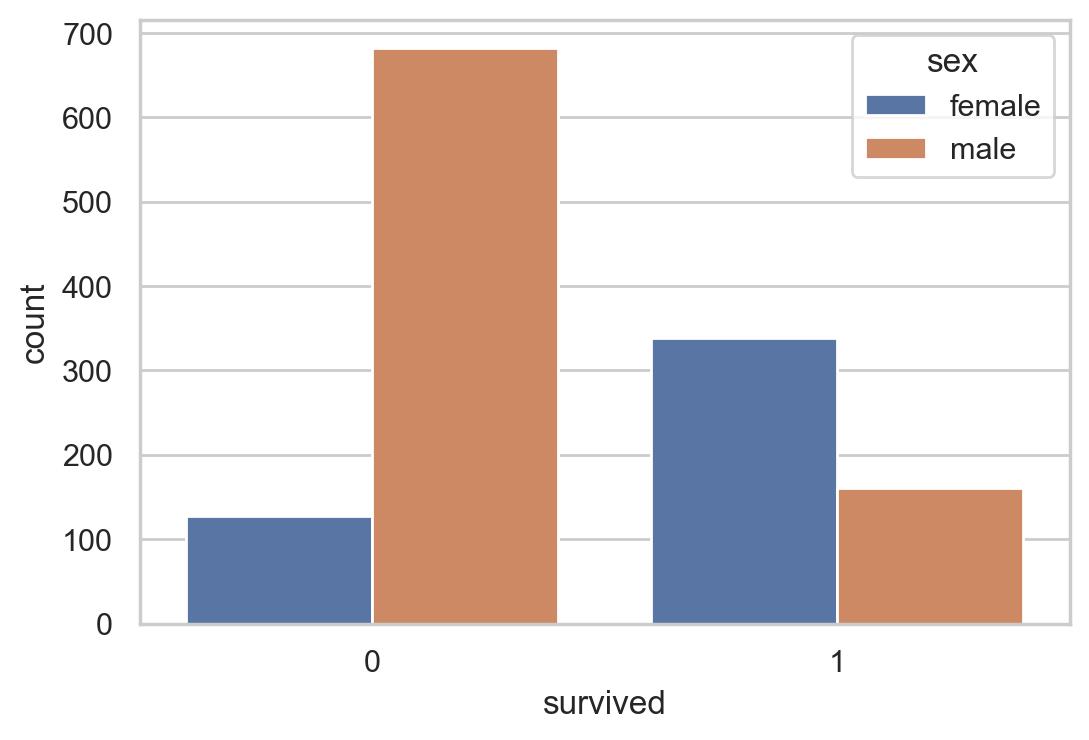
#舱位登记不同生存统计
sns.countplot(data = df , x = 'survived', hue='pclass')
#舱位等级和生存的交叉表
pd.crosstab(df['survived'], df['pclass'], margins=True)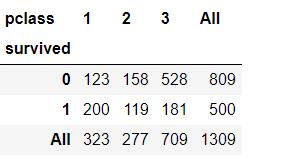
#舱位计数统计
sns.countplot(df.pclass)
# 绘制年龄直方图、密度图
plt.figure(figsize=(20, 7))
sns.distplot(df.age, color='purple')
# 绘制年龄直方图、密度图(去除缺失值)
plt.figure(figsize=(20, 7))
sns.distplot(df['age'].dropna(),color='darkred',bins=40)
#费用的密度图
plt.figure(figsize=(20, 7))
sns.distplot(df.fare, color='green')
#绘制费用的箱图和小提琴图:
plt.figure(figsize=(20, 7))

plt.subplot(1,2,1)
sns.boxplot(data = df, y='fare',orient = 'v')
plt.subplot(1,2,2)
sns.violinplot(data = df, y='fare',orient = 'v')
#(Q1−1.5⋅IQR, Q3+1.5⋅IQR) 
#费用和年龄相对于舱位等级的箱图
plt.figure(figsize=(20, 7))

plt.subplot(1,2,1)
sns.boxplot(x=df.pclass,y=df.fare)
plt.subplot(1,2,2)
sns.boxplot(x=df.pclass, y=df.age)
#相关性可视化
# Considering only numerical variables
scatter_var = list(set(df.columns)-set(['name', 'survived', 'ticket','cabin','embarked','sex','sibsp','parch']))

# Creating heatmap
corr_matrix = df[scatter_var].corr()
sns.heatmap(corr_matrix,annot=True);
#年龄和费用的散点图
plt.scatter(df['age'], df['fare'])
plt.title("Age Vs Fare")
plt.xlabel('Age')
plt.ylabel('Fare')
# 舱位等级和费用的散点图
plt.scatter(df['pclass'], df['fare'])
plt.title("pclass Vs fare")
plt.xlabel('pclass')
plt.ylabel('fare')
# pair plot of variables
#两两变量之间的散点关系
sns.pairplot(df[scatter_var])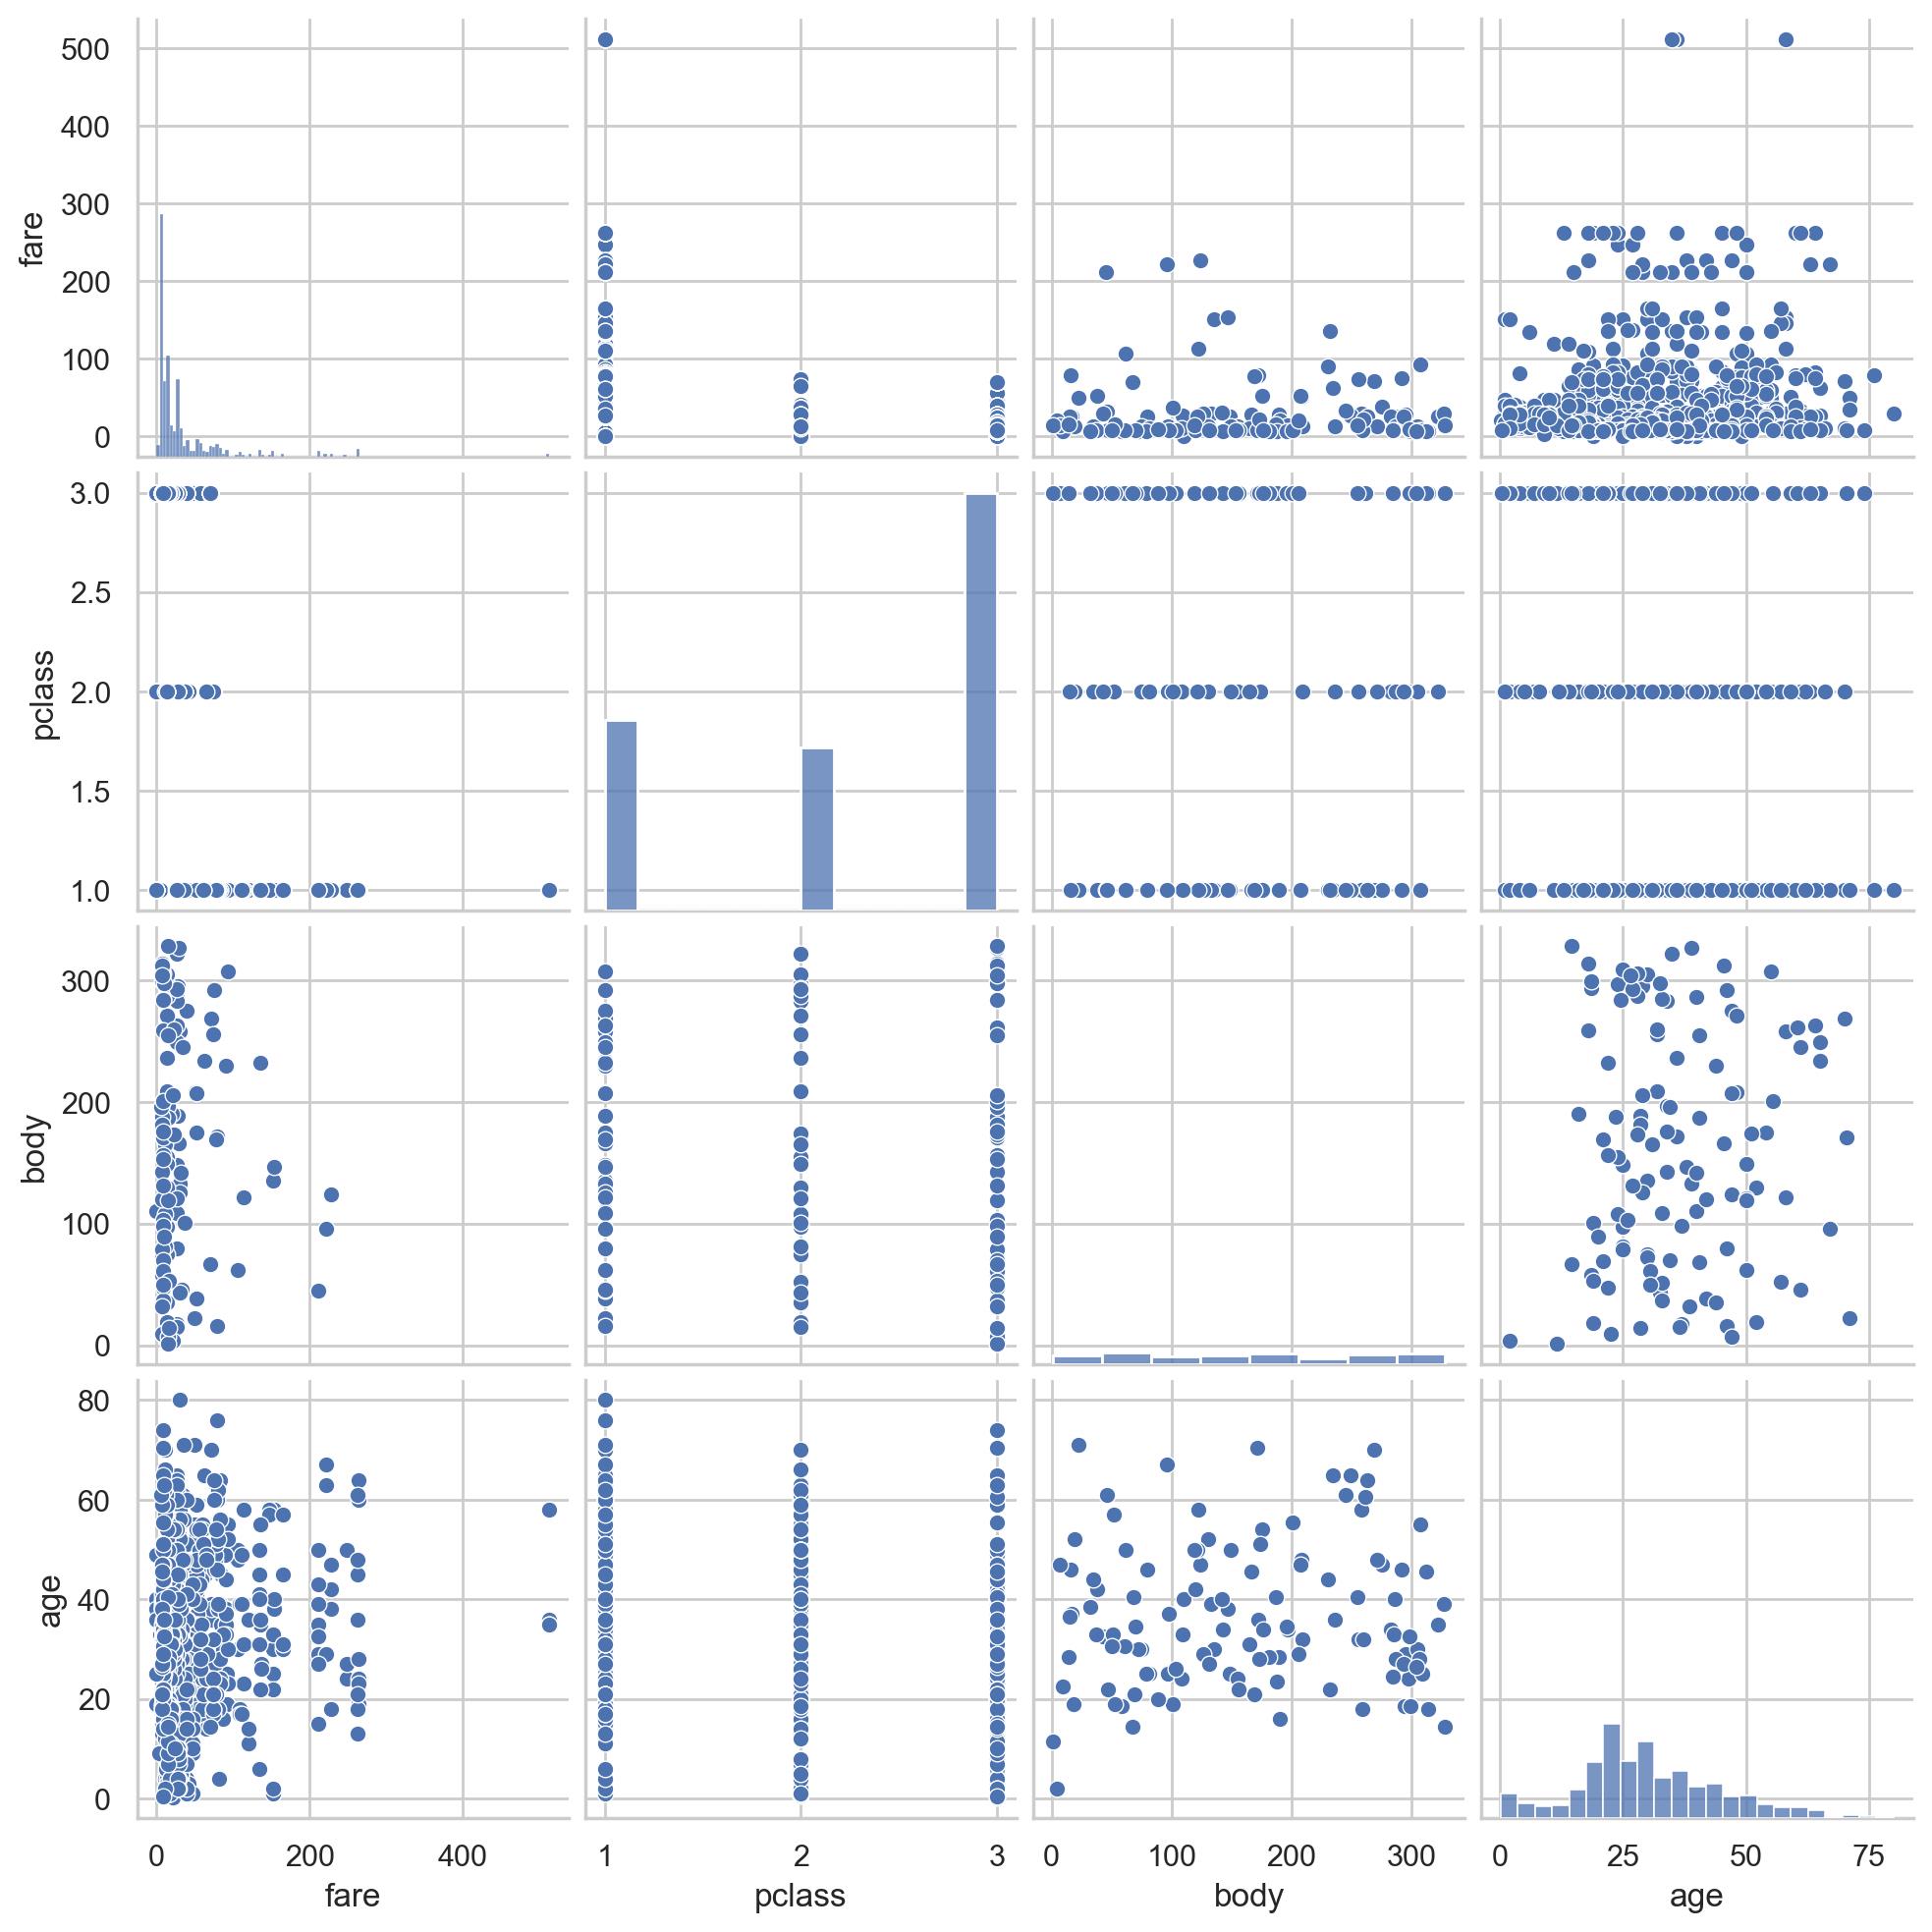
# 性别、登船地点、舱位等级生存统计信息
f, [ax1,ax2,ax3] = plt.subplots(1,3,figsize=(20,5))
sns.countplot(x='sex', hue='survived', data=df, ax=ax1)
sns.countplot(x='pclass', hue='survived', data=df, ax=ax2)
sns.countplot(x='embarked', hue='survived', data=df, ax=ax3)
ax1.set_title('sex feature analysis')
ax2.set_title('pclass feature analysis')
ax3.set_title('embarked feature analysis')
f.suptitle('categorical feature analysis', size=20, y=1.1)

plt.show()
#登船地、舱位等级、性别交叉统计图
grid = sns.FacetGrid(data = df, col='pclass', hue='sex', palette='seismic', size=4)
grid.map(sns.countplot, 'embarked', alpha=0.8)
grid.add_legend()
#绘制生存与否的年龄密度图:
f,ax = plt.subplots(figsize=(10,5))
sns.kdeplot(df.loc[(df['survived'] == 0),'age'] , color='gray',shade=True,label='not survived')
sns.kdeplot(df.loc[(df['survived'] == 1),'age'] , color='g',shade=True, label='survived')
plt.title('age feature distribution', fontsize = 15)
plt.xlabel("age", fontsize = 15)
plt.ylabel('frequency', fontsize = 15)
# 不同性别、生存情况下的年龄密度图:
def plot_distribution( df , var , target , **kwargs ):
    row = kwargs.get( 'row' , None )
    col = kwargs.get( 'col' , None )
    facet = sns.FacetGrid( df , hue=target , aspect=4 , row = row , col = col )
    facet.map( sns.kdeplot , var , shade= True )
    facet.set( xlim=( 0 , df[ var ].max() ) )
    facet.add_legend()


plot_distribution( df , var = 'age' , target = 'survived' , row = 'sex' )

# 不同生存情况人群的费用图
以及计算方差和均值并进行可视化分析
# 填充缺失值
df["fare"].fillna(df["fare"].median(), inplace=True)

df['fare'] = df['fare'].astype(int)

# 分别获得生还和遇难乘客的 Fare
fare_not_survived = df["fare"][df["survived"] == 0]
fare_survived = df["fare"][df["survived"] == 1]

# 得到 Fare 的均值和方差
avgerage_fare = pd.DataFrame([fare_not_survived.mean(), fare_survived.mean()])
std_fare = pd.DataFrame([fare_not_survived.std(), fare_survived.std()])

df['fare'].plot(kind='hist', figsize=(15,3),bins=100, xlim=(0,50))

avgerage_fare.index.names = std_fare.index.names = ["survived"]
avgerage_fare.plot(yerr=std_fare,kind='bar',legend=False)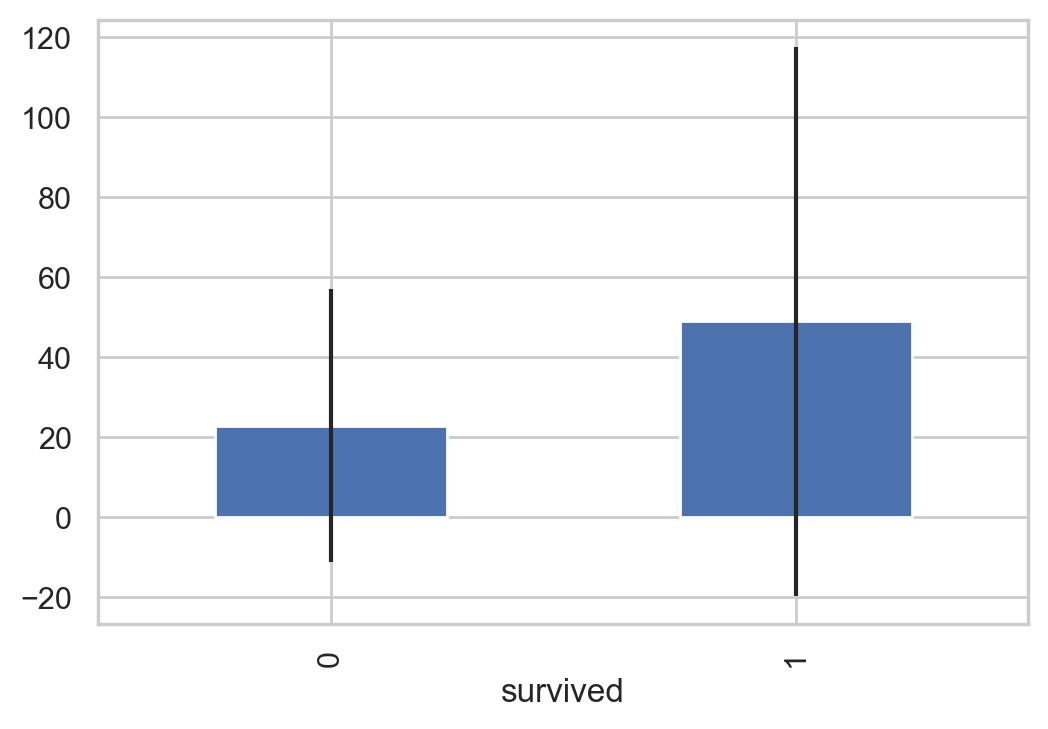
# 孤独以及和家庭一起出发的统计
# 孤独一个人还是和家庭一起,对生存的影响
df['family'] =  df["parch"] + df["sibsp"]
df['family'].loc[df['family'] > 0] = 1
df['family'].loc[df['family'] == 0] = 0


# 删除 Parch 和 SibSp
df_new = df.drop(['sibsp','parch'], axis=1)

# 绘图
fig, (axis1,axis2) = plt.subplots(1,2,sharex=True,figsize=(10,5))

sns.countplot(x='family', data=df, order=[1,0], ax=axis1)

# 分为和家人一起、独自乘船两种情况
family_perc = df_new[["family", "survived"]].groupby(['family'],as_index=False).mean()
sns.barplot(x='family', y='survived', data=family_perc, order=[1,0], ax=axis2)

axis1.set_xticklabels(["With Family","Alone"], rotation=0)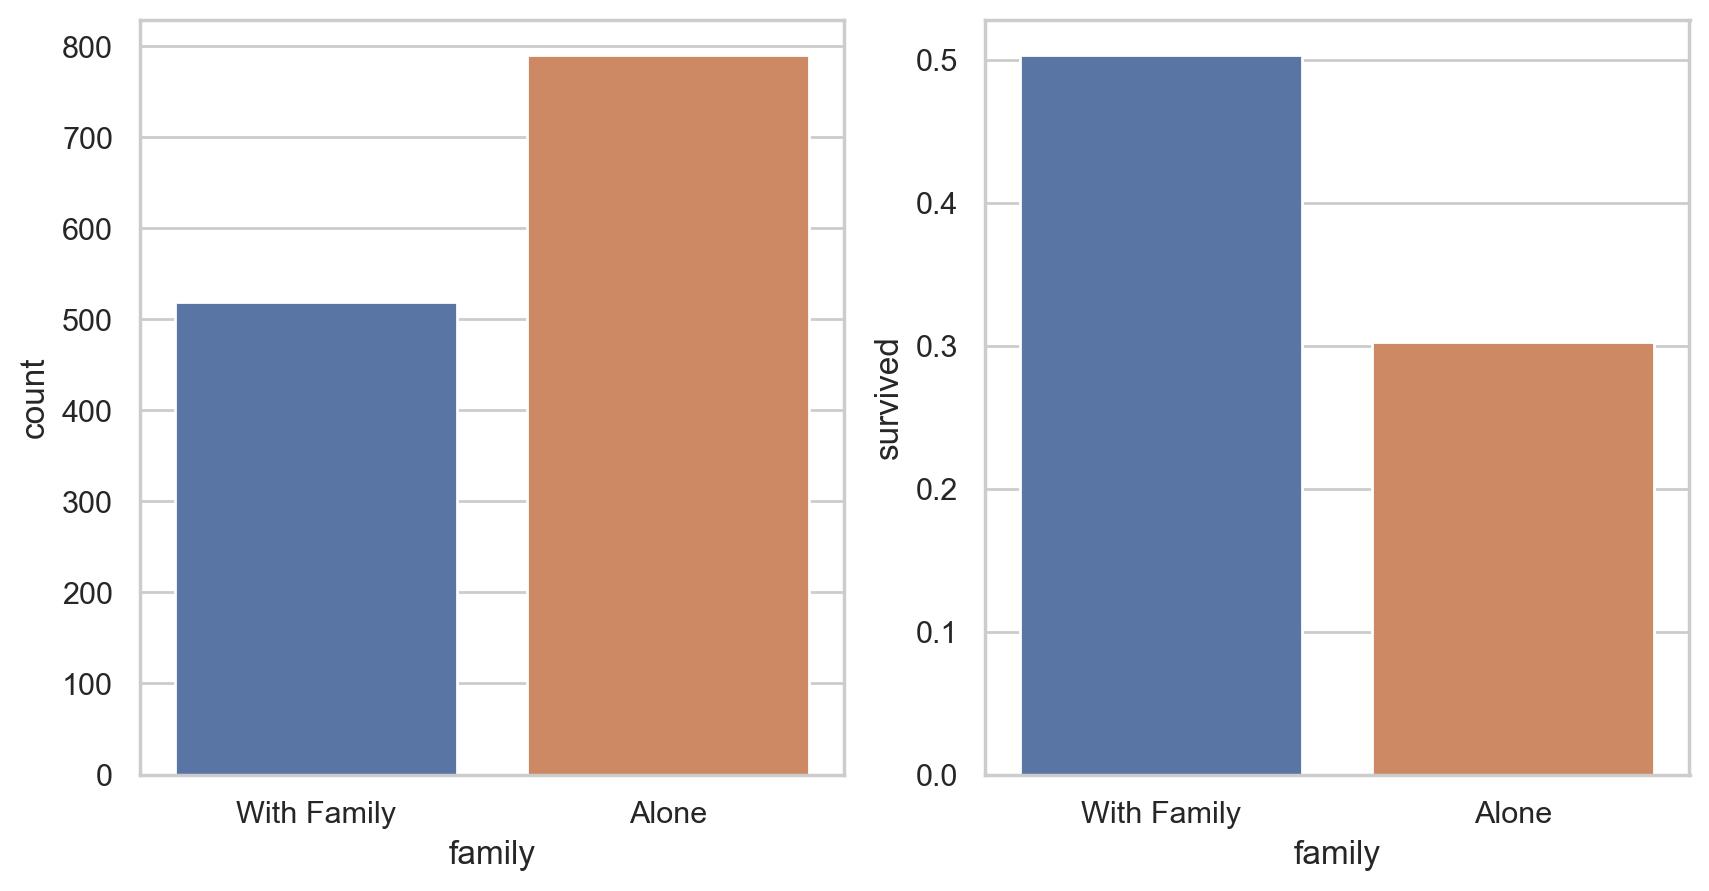
# pair plot
g = sns.pairplot(df[[u'survived', u'pclass', u'sex', u'age', u'family', u'fare', u'embarked']], hue='survived', palette = 'seismic',
                 size=4,diag_kind = 'kde',diag_kws=dict(shade=True),plot_kws=dict(s=50) )
g.set(xticklabels=[])
# pandas profiling
#pip install pandas-profiling

# from pandas_profiling import ProfileReport
# EDA_report = ProfileReport(df)
# EDA_report.to_file(output_file='EDA.html')
参考:kaggle
参考:Interview Questions on Exploratory Data Analysis (EDA)
参考:Introduction to Exploratory Data Analysis (EDA)
参考:How to do Exploratory Data Analysis (EDA) with python?
参考:Kaggle入门级赛题:泰坦尼克号生还者预测——数据分析篇
参考:Kaggle入门级赛题:泰坦尼克号生还者预测——数据挖掘篇
参考:UCI数据集整理(附论文常用数据集)
参考:pandas
参考:pandas profiling
以上是关于python进行探索性数据分析EDA(Exploratory Data Analysis)分析的主要内容,如果未能解决你的问题,请参考以下文章