图像处理基于图像直方图+滤波+小波变换+分割处理系统matlab源码含 GUI
Posted Matlab走起
tags:
篇首语:本文由小常识网(cha138.com)小编为大家整理,主要介绍了图像处理基于图像直方图+滤波+小波变换+分割处理系统matlab源码含 GUI相关的知识,希望对你有一定的参考价值。
一、简介
基于matlab GUI图像直方图、滤波、小波变换、分割处理系统
Part1-Introduction To The Wavelet Transform(简介)
1、Origin of the wavelet transform:
The theories of Wavelet originate from diffierent areas of study:
-
Engineering
-
Time-frequency analysis and Multiresolution Analysis
-
Computer Vision
-
Pyramidal algorithm
-
Physics
-
Pure Mathematics
2、Multiresolution Analysis(MRA-多分辨率分析与处理)
-
Multiresolution analysis is about analyzing a signal based on the information appeared in different scales of such signal – to mimic human beings in analyzing signals.
-
A signal of a certain “scale” refers to its best approximation at a certain resolution
-
By “traveling” from the coarse scales toward the fine scales, one zooms in and arrives at a more exact representation of the given signal

3、The Discrete Wavelet Transform(离散小波变换)
A simple way to implement MAR is by using the Discrete Wavelet Transform(DWT):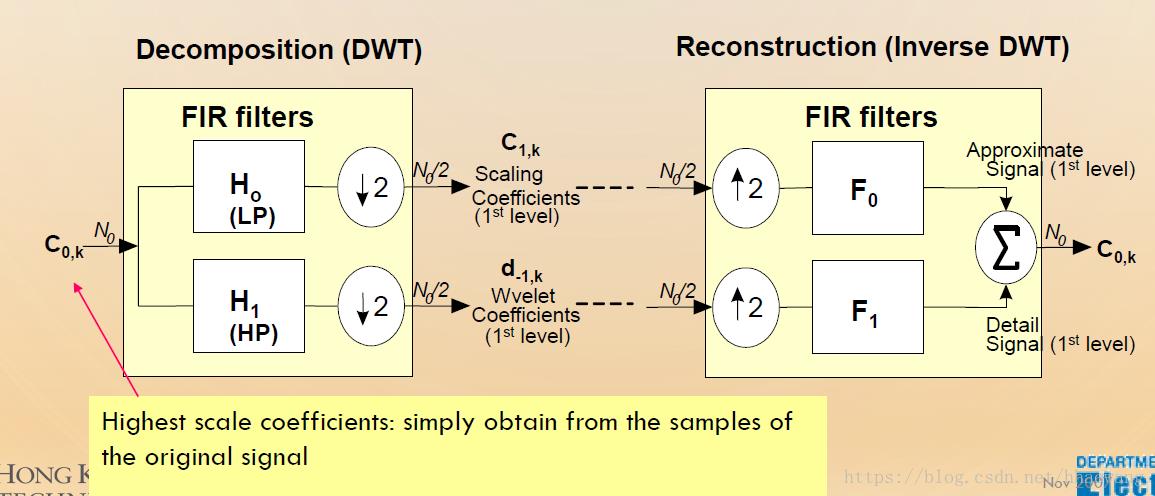
The definition of wavelet transform shows that the wavelet analysis is a measure of similarity the basis functions(wavelets) and the original function .The coefficients ,named H0 for Low Pass Filter, and H1 for High Pass Filter, caculated indicate how close the function is to the danghter wavelet at that particular scale.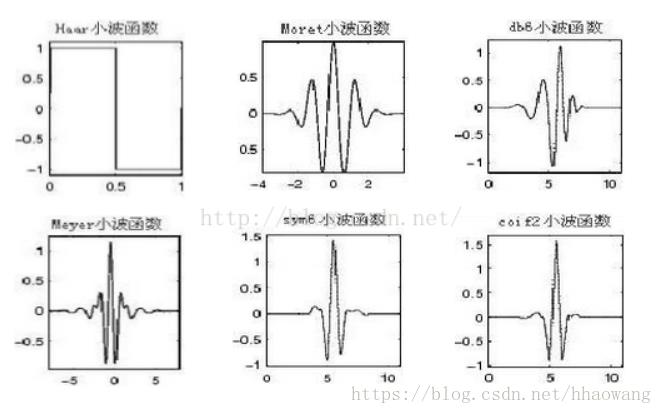
Part2-Decomposition(DWT) and Reconstruction(Inverse DWT)–离散小波分解与重构
对于离散小波变换,由于很多小波函数不是正交函数,因此需要一个尺度系数(Scaling Coefficients)和一个小波系数(Wavelet Coefficients).因此,原信号函数可以分解成尺度函数(系数)和小波函数(系数)的线性组合,在这个函数中,尺度函数产生低频部分,小波函数产生高频部分。
1、一维Haar小波变换-分解
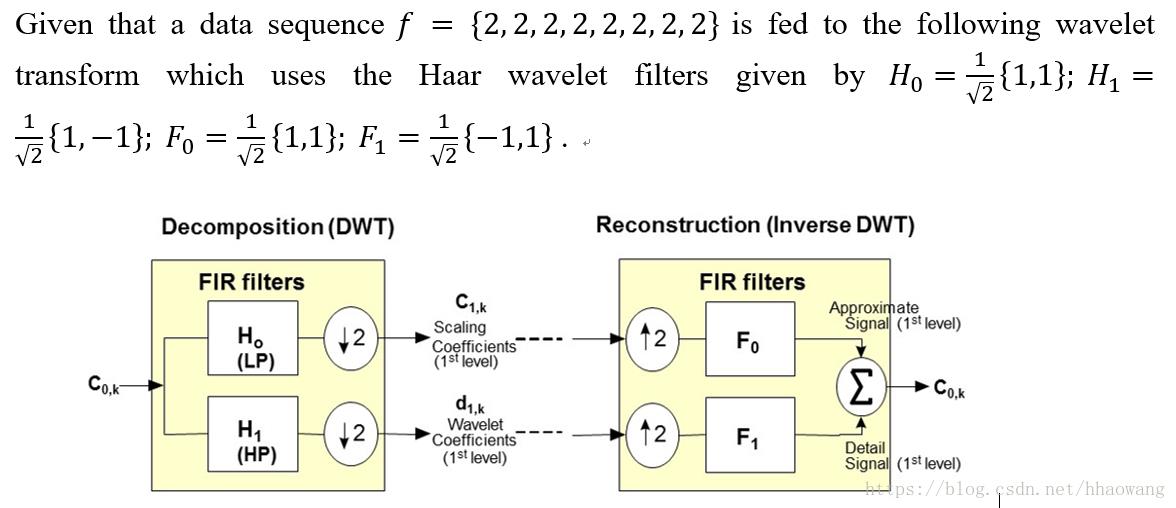
离散的信号经过Haar小波变换时,首先会将这个信号所携带的信息进行压缩,得到N/2个数据点进行存储,那么这些点信息就是由这些Scaling Coefficients-尺度系数来表征的。对于离散信号而言,其可能具有高频和低频成分,而小波系数或细节系数代表它的高频部分。
小波中的下采样就是对信号进行隔点采样,目的就是为了将信息进行压缩存储。
小波中的上采样就是隔点插零,目的是为了重构信号。
而对信号的滤波过程,在数学上等效为信号与滤波器冲激响应的卷积。
分解LP 滤波器(离散卷积算子):
分解HP滤波器(离散卷积算子):
离散时间卷积定理:
“离散卷积”是两个离散序列x(n) 和h(n) 之间按照一定的规则将它们的有关序列值分别两两相乘再相加的一种特殊的运算。具体可用公式表示为:
其中 y(n)就是经过卷积运算以后所得到的一个新的序列。
在工程上离散卷积有着广泛的应用,例如,在数字图像处理领域,为了将数字信号进行滤波,可以将表示成离散序列的图像信号C(n) 与数字滤波器的冲激响应h(n) 进行离散卷积运行。
多分辨分析的小波函数Ψ(t)和尺度函数φ(t)满足双尺度的差分方程: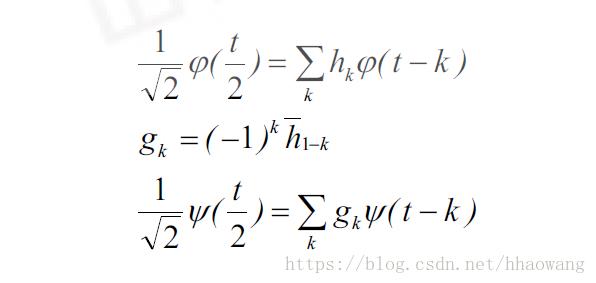
多分辨分析每一层分解使信号f(t)通过一低通滤波器和带通滤波器,把信号分解为低频部分和高频部分。低通滤波器的特性由小波函数Ψ(x)确定,带通滤波器的特性由尺度函数φ(x)确定。分解后的系数由两部分组成:低频系数向量c1和高频系数向量d1。低频系数向量c1 是由信号与低通滤波器(小波函数确定)的脉冲响应经过卷积运算得到,高频系数向量d1是由信号与带通滤波器(尺度函数确定)经过卷积运算得到。
2、一维Haar小波变换–重构
逆变换过程:
3、二维Haar小波变换
二维图像信号
对于二维图像信号,可以用分别在水平和垂直方向进行滤波的方法实现二维小波多分辨率分解。图2.5为经过二维离散小波变换的分解后子图像的划分。其中:
(l)LL子带是由两个方向利用低通小波滤波器卷积后产生的小波系数,它是图像的近似表示。
(2)HL子带是在行方向利用低通小波滤波器卷积后,再用高通小波滤波器在列方向卷积而产生的小波系数,它表示图像的水平方向奇异特性。(水平子带)
(3)LH子带是在行方向利用高通小波滤波器卷积后,再用低通小波滤波器在列方向卷积而产生的小波系数,它表示图像的垂直方向奇异特性。(垂直子带)
(4)HH子带是由两个方向利用高通小波滤波器卷积后产生的小波系数,它表示图像的对角边缘特性。(对角子带)
第一个字母表示列方向的处理,第二个字母表示行方向的处理,图像的奇异特性通过低通时保留,通过高通时被滤除。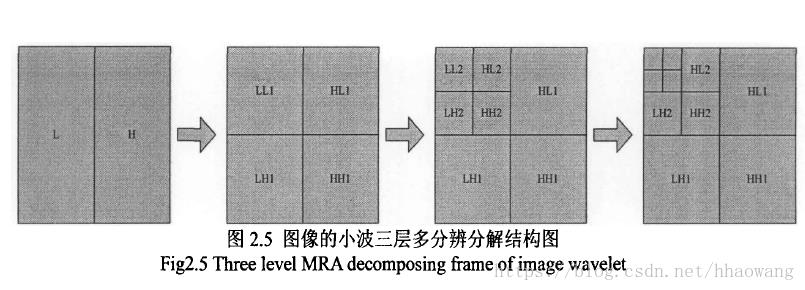
小波去噪方法也就是寻找从实际信号空间到小波函数空间的最佳映像,以便得到原信号的最佳恢复。

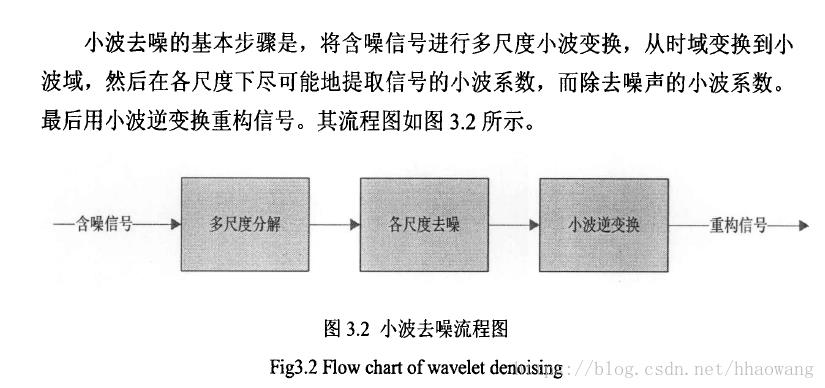
目前,小波去噪的方法大概可以分为三大类:
第一类方法–小波变换模极大值去噪法
利用小波变换模极大值原理去噪,即根据信号和噪声在小波变换各尺度上的不同传播特性,剔除由噪声产生的模极大值点,保留信号所对应的模极大值点,然后利用所余模极大值点重构小波系数,进而恢复信号;
第二类方法–小波系数相关性去噪法
对含噪信号作小波变换之后,计算相邻尺度间小波系数的相关性,根据相关性的大小区别小波系数的类型,从而进行取舍,然后直接重构信号;
第三类方法–小波变换阈值去造法
小波阈值去噪方法,该方法认为信号对应的小波系数包含有信号的重要信息,其幅值较大,但数目较少,而噪声对应的小波系数是一致分布的,个数较多,但幅值小。
4、小波阀值收缩去噪法:
1、 小波阀值去噪的基本思想:
Donoho提出的小波阀值去噪的基本思想是将信号通过小波变换(采用Mallat算法)后,信号产生的小波系数含有信号的重要信息,将信号经小波分解后小波系数较大,噪声的小波系数较小,并且噪声的小波系数要小于信号的小波系数,通过选取一个合适的阀值,大于阀值的小波系数被认为是有信号产生的,应予以保留,小于阀值的则认为是噪声产生的,置为零从而达到去噪的目的。其基本步骤为:
(1)分解:选定一种层数为N的小波对信号进行小波分解;
(2)阀值处理过程:分解后通过选取一合适的阀值,用阀值函数对各层系数进行量化;
(3)重构:用处理后的系数重构信号。
2、小波阀值去噪的基本问题
小波阀值去噪的基本问题包括三个方面:小波基的选择,阀值的选择,阀值函数的选择。
(1)小波基的选择:通常我们希望所选取的小波满足以下条件:正交性、高消失矩、紧支性、对称性或反对称性。但事实上具有上述性质的小波是不可能存在的,因为小波是对称或反对称的只有Haar小波,并且高消失矩与紧支性是一对矛盾,所以在应用的时候一般选取具有紧支的小波以及根据信号的特征来选取较为合适的小波。
(2)阀值的选择:直接影响去噪效果的一个重要因素就是阀值的选取,不同的阀值选取将有不同的去噪效果。目前主要有通用阀值(VisuShrink)、SureShrink阀值、Minimax阀值、BayesShrink阀值等。
(3)阀值函数的选择:阀值函数是修正小波系数的规则,不同的反之函数体现了不同的处理小波系数的策略。最常用的阀值函数有两种:一种是硬阀值函数,另一种是软阀值函数。还有一种介于软、硬阀值函数之间的Garrote函数。
另外,对于去噪效果好坏的评价,常用信号的信噪比(SNR)与估计信号同原始信号的均方根误差(MSE)来判断。
二、源代码
unction varargout = exp_gs(varargin)
% EXP_GS M-file for exp_gs.fig
%      EXP_GS, by itself, creates a new EXP_GS or raises the existing
%      singleton*.
%
%      H = EXP_GS returns the handle to a new EXP_GS or the handle to
%      the existing singleton*.
%
%      EXP_GS('CALLBACK',hObject,eventData,handles,...) calls the local
%      function named CALLBACK in EXP_GS.M with the given input arguments.
%
%      EXP_GS('Property','Value',...) creates a new EXP_GS or raises the
%      existing singleton*.  Starting from the left, property value pairs are
%      applied to the GUI before exp_gs_OpeningFcn gets called.  An
%      unrecognized property name or invalid value makes property application
%      stop.  All inputs are passed to exp_gs_OpeningFcn via varargin.
%
%      *See GUI Options on GUIDE's Tools menu.  Choose "GUI allows only one
%      instance to run (singleton)".
%
% See also: GUIDE, GUIDATA, GUIHANDLES

% Edit the above text to modify the response to help exp_gs

% Last Modified by GUIDE v2.5 30-Jun-2010 13:33:39

% Begin initialization code - DO NOT EDIT
gui_Singleton = 1;
gui_State = struct('gui_Name',       mfilename, ...
                   'gui_Singleton',  gui_Singleton, ...
                   'gui_OpeningFcn', @exp_gs_OpeningFcn, ...
                   'gui_OutputFcn',  @exp_gs_OutputFcn, ...
                   'gui_LayoutFcn',  [] , ...
                   'gui_Callback',   []);
if nargin && ischar(varargin{1})
    gui_State.gui_Callback = str2func(varargin{1});
end

if nargout
    [varargout{1:nargout}] = gui_mainfcn(gui_State, varargin{:});
else
    gui_mainfcn(gui_State, varargin{:});
end
% End initialization code - DO NOT EDIT


% --- Executes just before exp_gs is made visible.
function exp_gs_OpeningFcn(hObject, eventdata, handles, varargin)
% This function has no output args, see OutputFcn.
% hObject    handle to figure
% eventdata  reserved - to be defined in a future version of MATLAB
% handles    structure with handles and user data (see GUIDATA)
% varargin   command line arguments to exp_gs (see VARARGIN)

% Choose default command line output for exp_gs
handles.output = hObject;

% Update handles structure
guidata(hObject, handles);

% UIWAIT makes exp_gs wait for user response (see UIRESUME)
% uiwait(handles.figure1);


% --- Outputs from this function are returned to the command line.
function varargout = exp_gs_OutputFcn(hObject, eventdata, handles)
% varargout  cell array for returning output args (see VARARGOUT);
% hObject    handle to figure
% eventdata  reserved - to be defined in a future version of MATLAB
% handles    structure with handles and user data (see GUIDATA)

% Get default command line output from handles structure
varargout{1} = handles.output;


function edit1_Callback(hObject, eventdata, handles)
% hObject    handle to edit1 (see GCBO)
% eventdata  reserved - to be defined in a future version of MATLAB
% handles    structure with handles and user data (see GUIDATA)

% Hints: get(hObject,'String') returns contents of edit1 as text
%        str2double(get(hObject,'String')) returns contents of edit1 as a double


% --- Executes during object creation, after setting all properties.
function edit1_CreateFcn(hObject, eventdata, handles)
% hObject    handle to edit1 (see GCBO)
% eventdata  reserved - to be defined in a future version of MATLAB
% handles    empty - handles not created until after all CreateFcns called

% Hint: edit controls usually have a white background on Windows.
%       See ISPC and COMPUTER.
if ispc && isequal(get(hObject,'BackgroundColor'), get(0,'defaultUicontrolBackgroundColor'))
    set(hObject,'BackgroundColor','white');
end


% --- Executes on button press in pushbutton1.
function pushbutton1_Callback(hObject, eventdata, handles)
% hObject    handle to pushbutton1 (see GCBO)
% eventdata  reserved - to be defined in a future version of MATLAB
% handles    structure with handles and user data (see GUIDATA)
ImgPath=get(handles.edit1,'String');
global img_1;
img_1=imread(ImgPath);
axes(handles.axes1);
imshow(img_1);
global histogram1;
histogram1=zeros(1,256);
[sizex,sizey]=size(img_1);
for ii=1:sizex % 计算直方图
    for jj=1:sizey
        histogram1(img_1(ii,jj)+1)=histogram1(img_1(ii,jj)+1)+1;
    end
end
maxhisto1=sum(histogram1);% 归一化
histogram1=histogram1/maxhisto1;
axes(handles.axes2);
bar(0:255,histogram1);
axis([0 255 0 max(histogram1)]);

% --- Executes on button press in pushbutton2.
function pushbutton2_Callback(hObject, eventdata, handles)
% hObject    handle to pushbutton2 (see GCBO)
% eventdata  reserved - to be defined in a future version of MATLAB
% handles    structure with handles and user data (see GUIDATA)
global img_1;
[sizex,sizey]=size(img_1);
for ii=1:sizex % 减小动态范围
    for jj=1:sizey
        img_1tmp(ii,jj)=floor(img_1(ii,jj)/2)+64;
    end
end
global img_11;
img_11=img_1tmp;
axes(handles.axes3);
imshow(img_11);
histogram2=zeros(1,256);
for ii=1:sizex
    for jj=1:sizey
        histogram2(img_11(ii,jj)+1)=histogram2(img_11(ii,jj)+1)+1;
    end
end
maxhisto2=sum(histogram2);
histogram2=histogram2/maxhisto2;
axes(handles.axes4);
bar(0:255,histogram2);
axis([0 255 0 max(histogram2)]);

% --- Executes on button press in pushbutton3.
function pushbutton3_Callback(hObject, eventdata, handles)
% hObject    handle to pushbutton3 (see GCBO)
% eventdata  reserved - to be defined in a future version of MATLAB
% handles    structure with handles and user data (see GUIDATA)
global img_1;
[sizex,sizey]=size(img_1);
for ii=1:sizex % 直方图左移
    for jj=1:sizey
        img_1tmp(ii,jj)=img_1(ii,jj)-30;
    end
end
global img_11;
img_11=img_1tmp;
axes(handles.axes3);
imshow(img_11);
histogram3=zeros(1,256);
for ii=1:sizex
    for jj=1:sizey
        histogram3(img_11(ii,jj)+1)=histogram3(img_11(ii,jj)+1)+1;
    end
end
maxhisto3=sum(histogram3);
histogram3=histogram3/maxhisto3;
axes(handles.axes4);
bar(0:255,histogram3);
axis([0 255 0 max(histogram3)]);

% --- Executes on button press in pushbutton4.
function pushbutton4_Callback(hObject, eventdata, handles)
% hObject    handle to pushbutton4 (see GCBO)
% eventdata  reserved - to be defined in a future version of MATLAB
% handles    structure with handles and user data (see GUIDATA)
global img_1;
[sizex,sizey]=size(img_1);
for ii=1:sizex % 直方图右移
    for jj=1:sizey
        img_1tmp(ii,jj)=img_1(ii,jj)+30;
    end
end
global img_11;
img_11=img_1tmp;
axes(handles.axes3);
imshow(img_11);
histogram4=zeros(1,256);
for ii=1:sizex
    for jj=1:sizey
        histogram4(img_11(ii,jj)+1)=histogram4(img_11(ii,jj)+1)+1;
    end
end
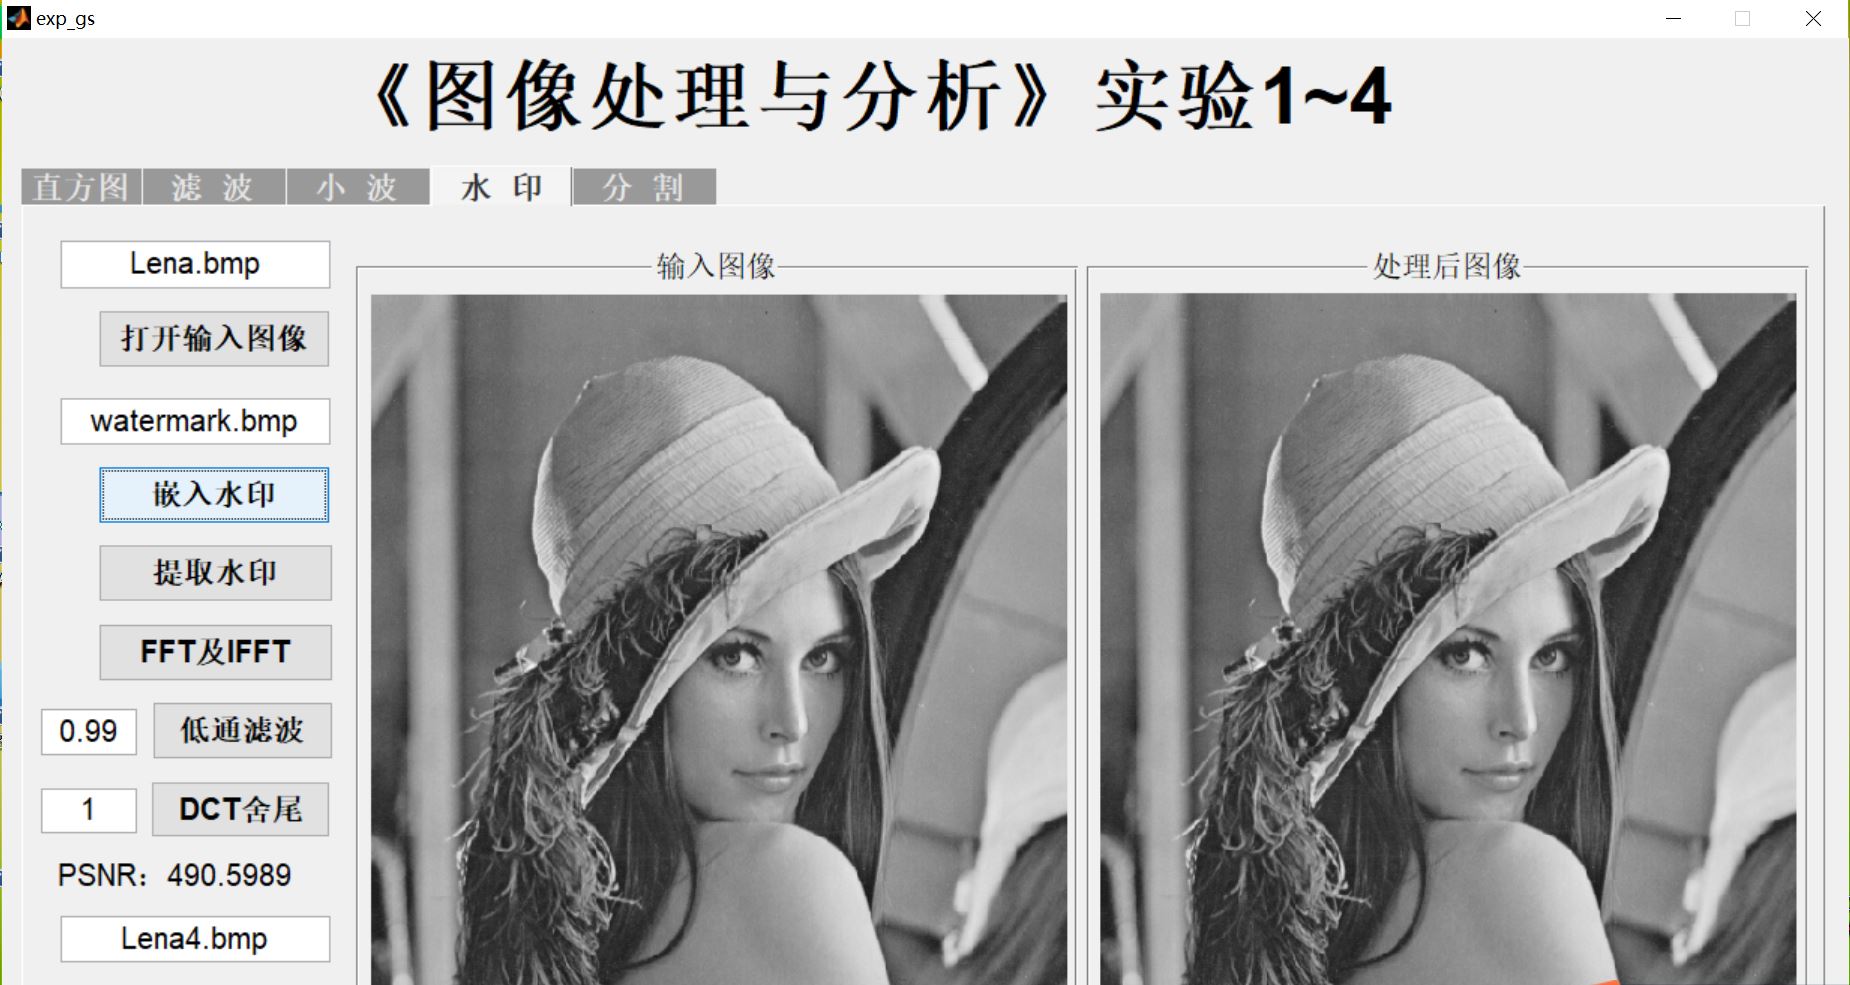
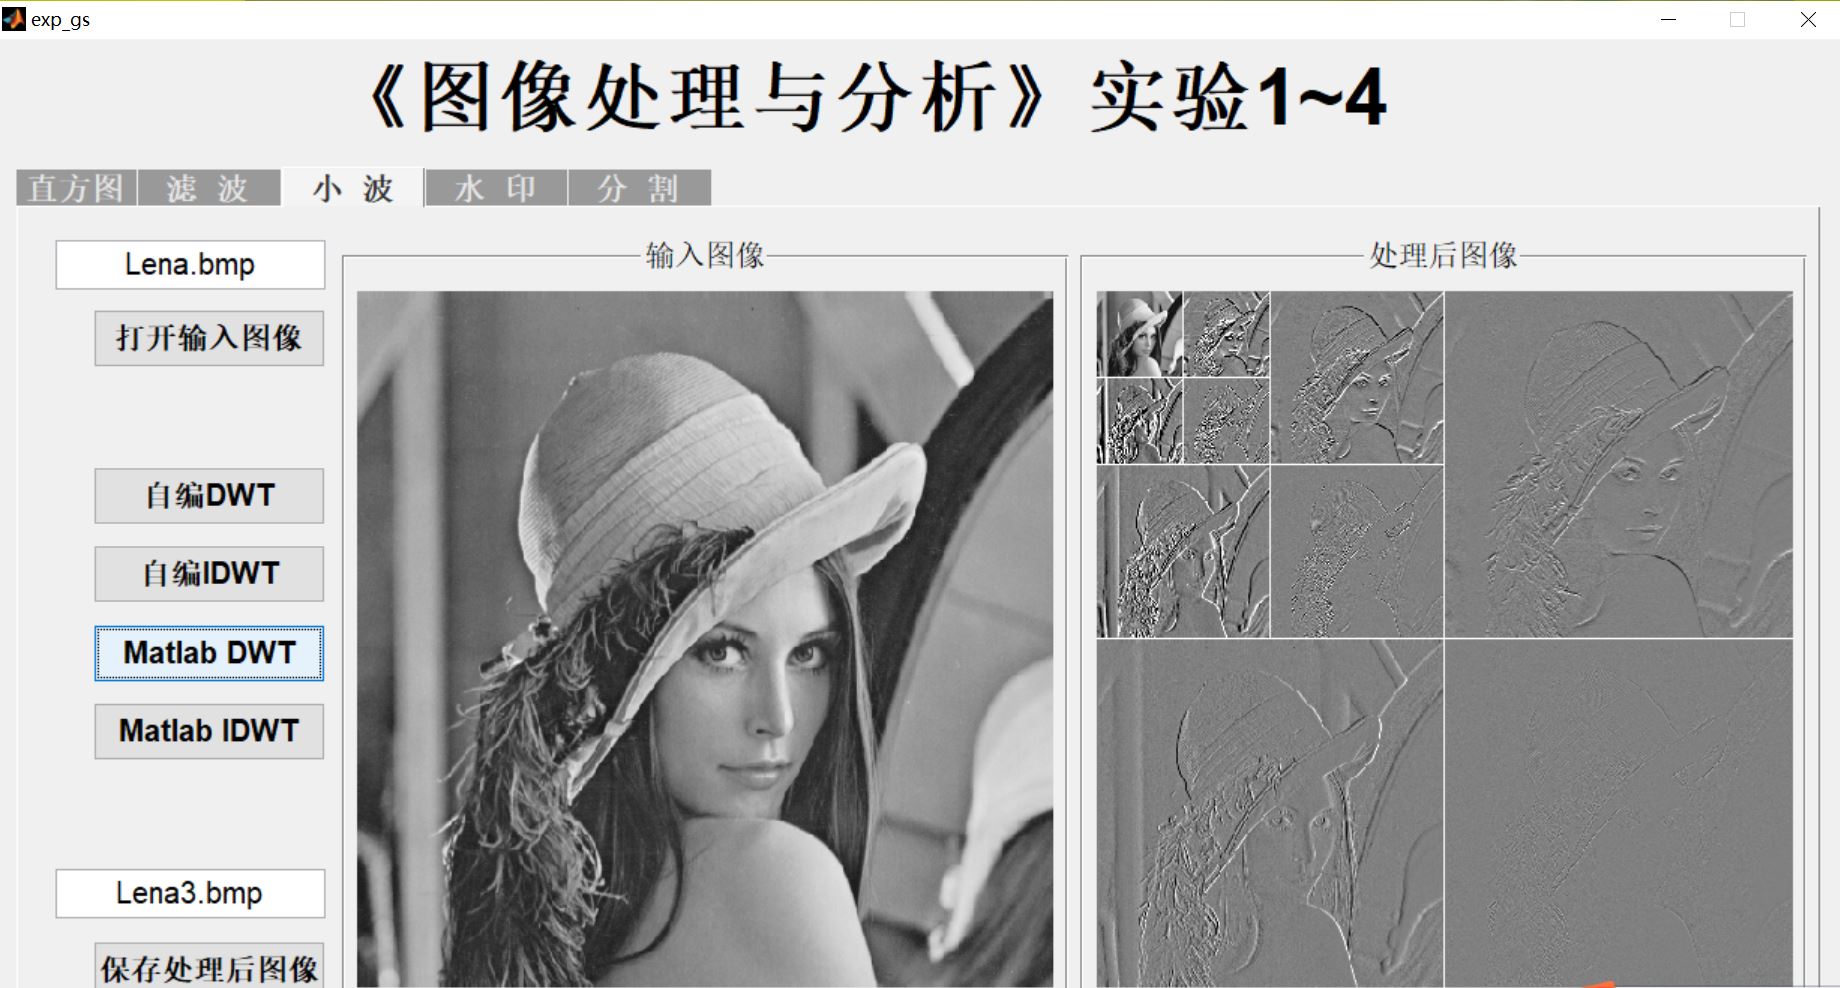
三、运行结果
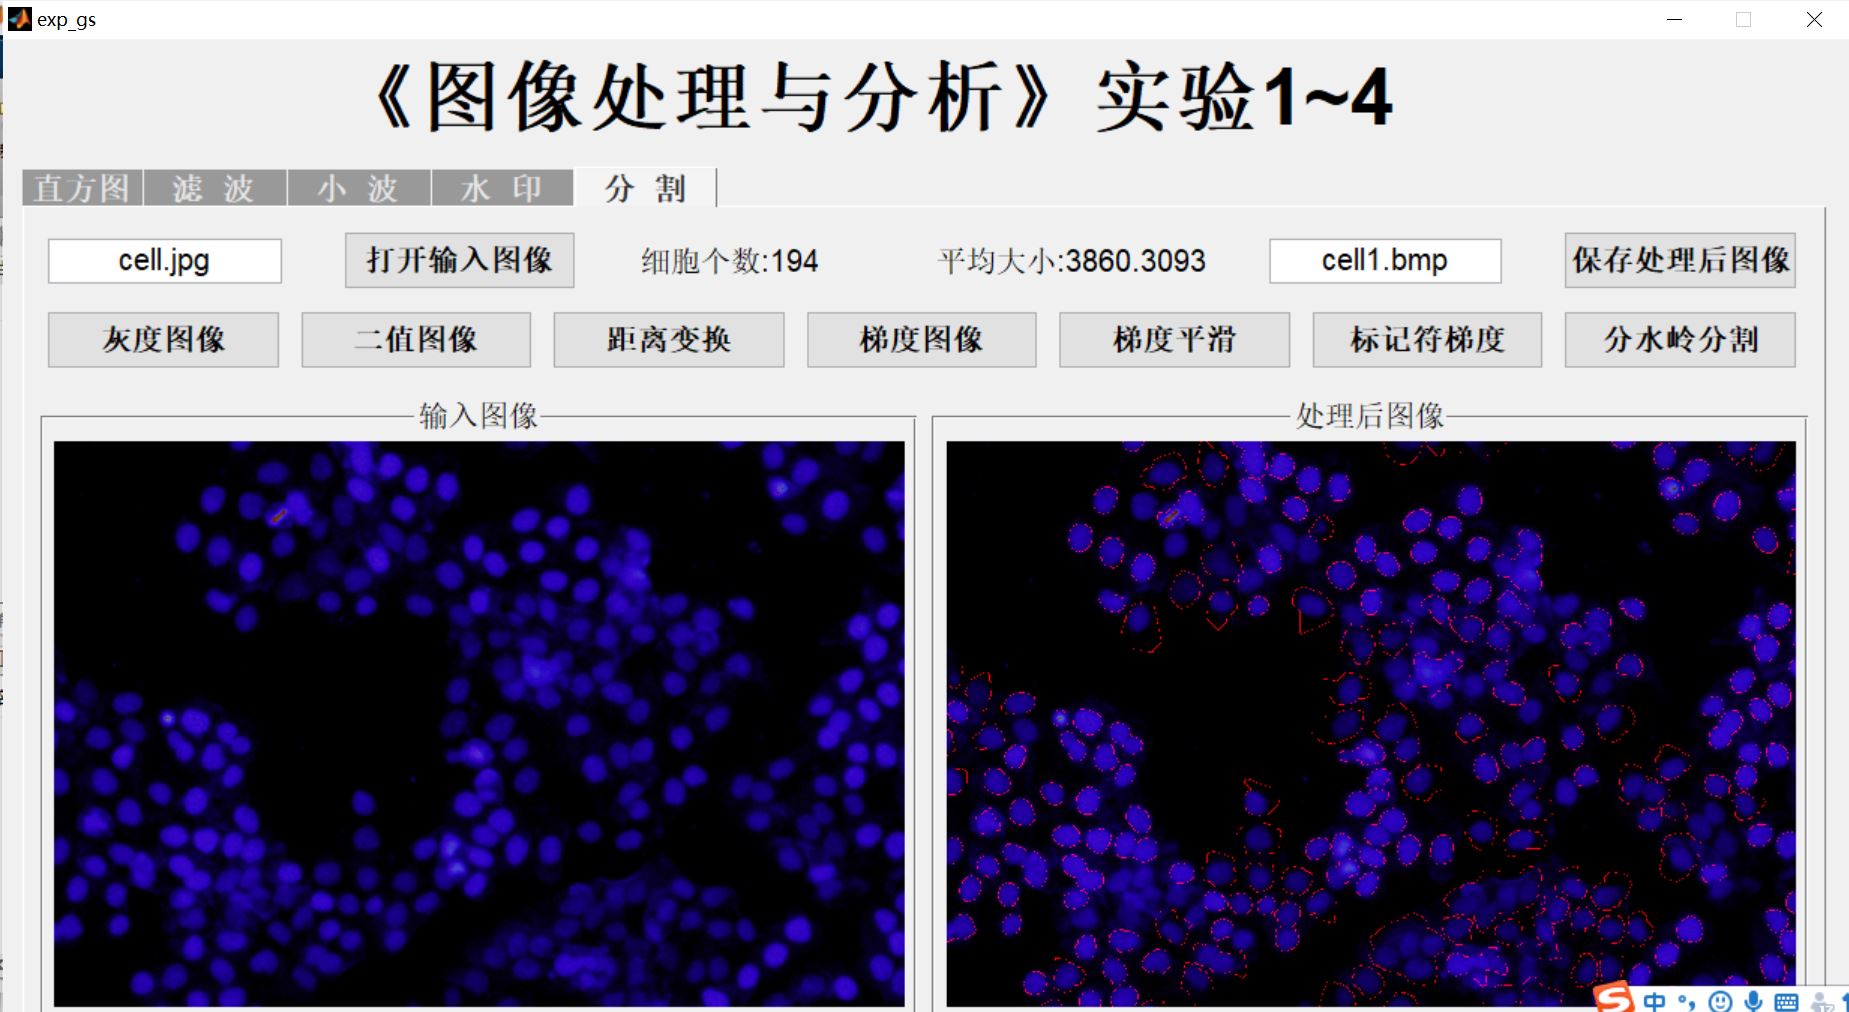
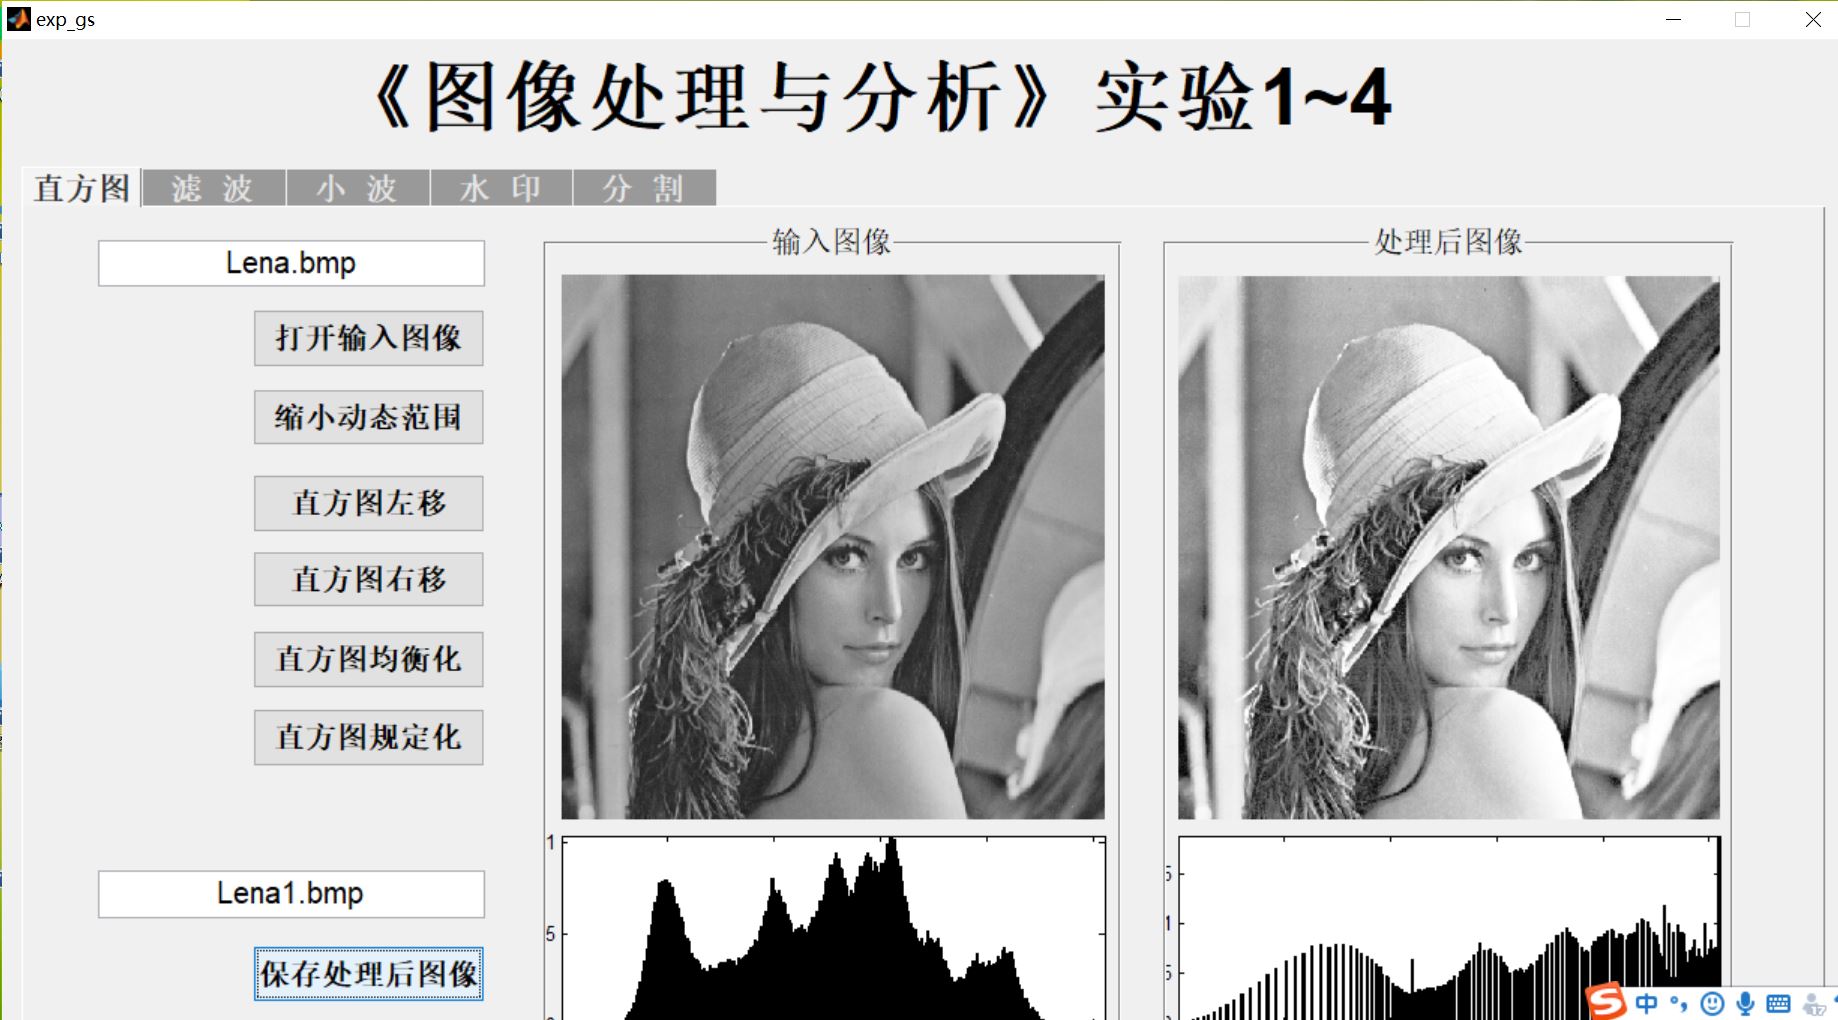
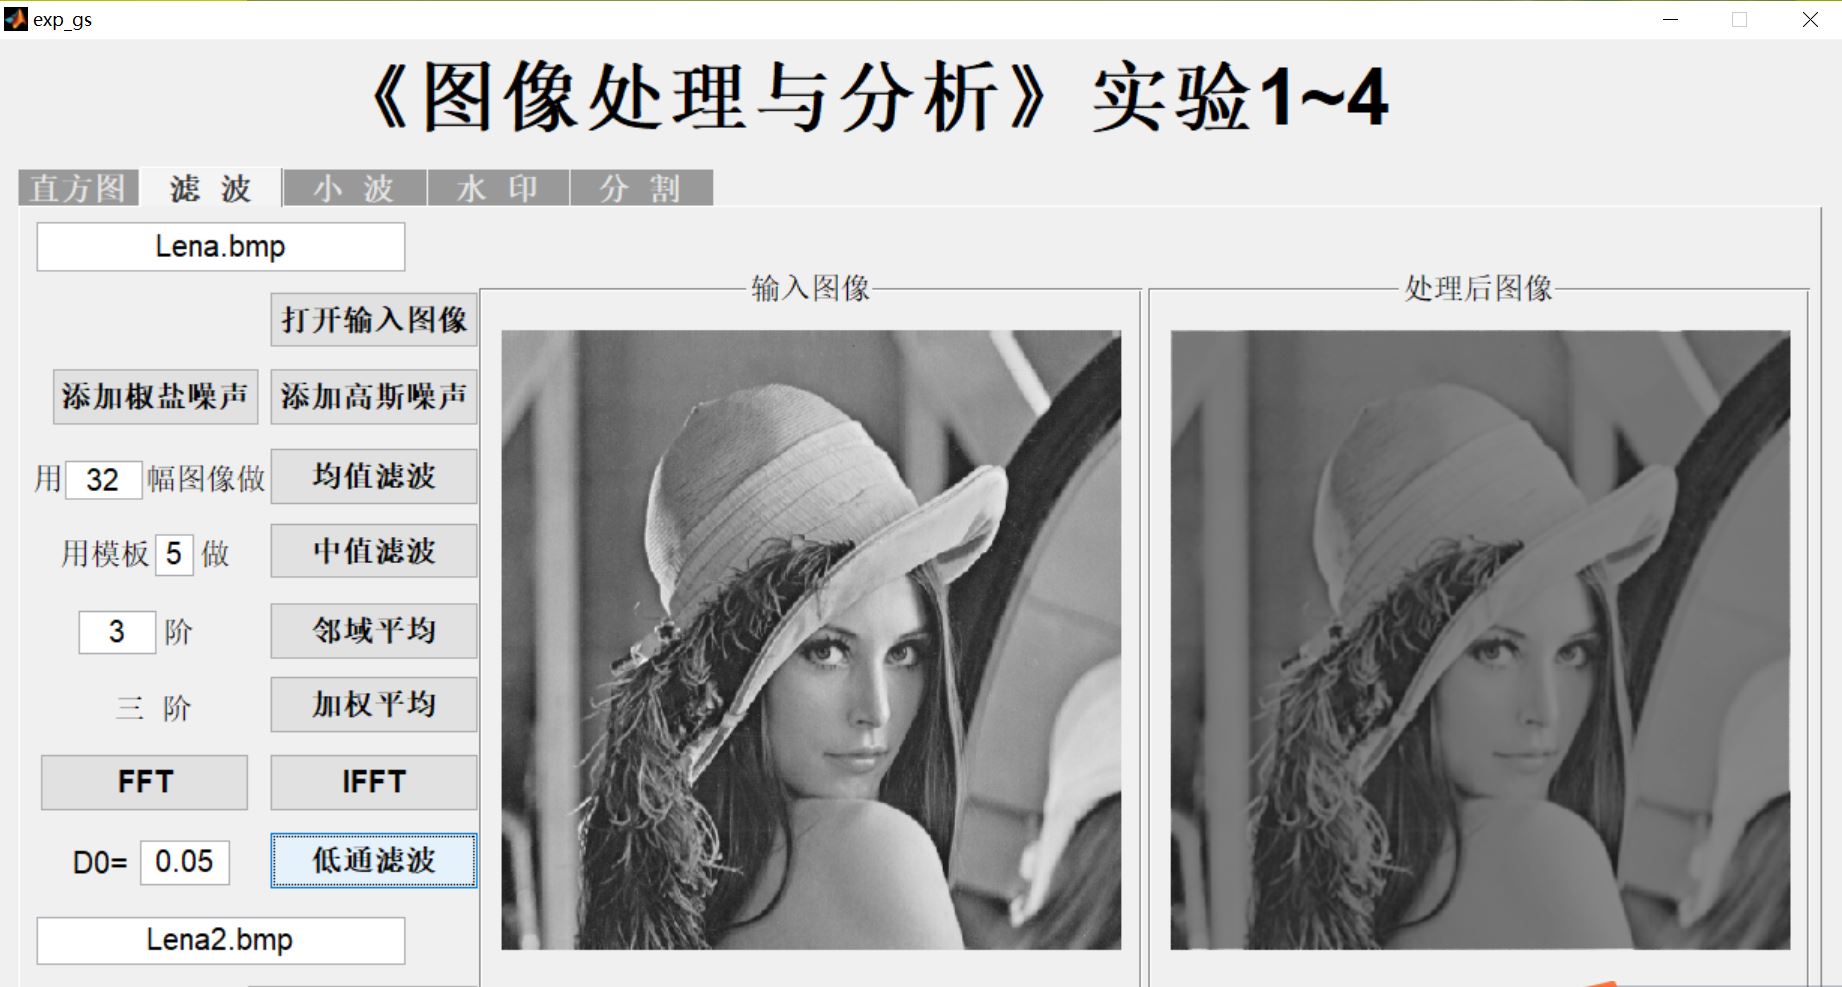
四、备注
完整代码或者代写添加QQ1575304183
以上是关于图像处理基于图像直方图+滤波+小波变换+分割处理系统matlab源码含 GUI的主要内容,如果未能解决你的问题,请参考以下文章