托盘孔位项目分析
Posted 东东就是我
tags:
篇首语:本文由小常识网(cha138.com)小编为大家整理,主要介绍了托盘孔位项目分析相关的知识,希望对你有一定的参考价值。
1.ply点云文件加载
from plyfile import PlyData
import numpy as np
import pandas as pd
import cv2
plydata = PlyData.read(file_dir)  # 读取文件
data = plydata.elements[0].data  # 读取数据
data_pd = pd.DataFrame(data)  # 转换成DataFrame, 因为DataFrame可以解析结构化的数据
rgbimg = np.array(data_pd.iloc[:, 3:6]).reshape(512,640, 3)
2.点云分析,先通过固定阈值的y分割物体
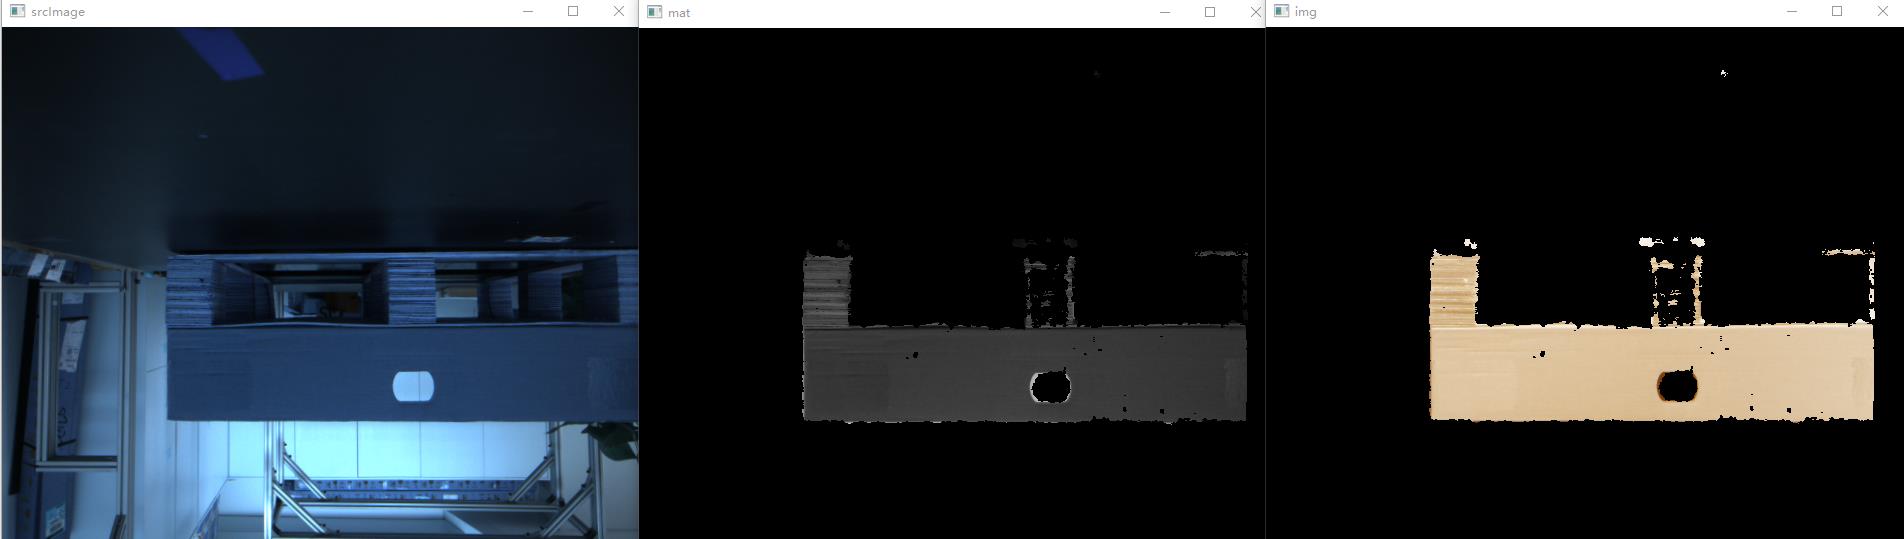
    plydata = PlyData.read(file_dir)  # 读取文件
    data = plydata.elements[0].data  # 读取数据
    data_pd = pd.DataFrame(data)  # 转换成DataFrame, 因为DataFrame可以解析结构化的数据
    srcimg = data_pd.copy()
    # data_pd['red']=np.where(data_pd['y']>0.82 or data_pd['y']<0.7,0,data_pd['red'])
    data_pd['red'] = np.where(
        (data_pd['y'] > 0.82) | (data_pd['y'] < 0.7) | (pd.isnull(data_pd['y'])),
        0, data_pd['red'])
    data_pd['green'] = np.where(
        (data_pd['y'] > 0.82) | (data_pd['y'] < 0.7) | (pd.isnull(data_pd['y'])),
        0, data_pd['green'])
    data_pd['blue'] = np.where(
        (data_pd['y'] > 0.82) | (data_pd['y'] < 0.7) | (pd.isnull(data_pd['y'])),
        0, data_pd['blue'])
    mat = np.array(data_pd.iloc[:, 3:6]).reshape(512, 640, 3)
    mat = cv2.cvtColor(mat, cv2.COLOR_BGR2GRAY)
    srcimg = np.array(srcimg.iloc[:, 3:6]).reshape(512, 640, 3)
    img = cv2.bitwise_not(srcimg, mask=mat)
    cv2.imshow("srcImage", srcimg)
    cv2.imshow('img', img)
    cv2.imshow("mat", mat)
    cv2.waitKey(0)
想通过判断物体点云个数,然后对y做直方图找到检测物体的取值范围,然后在过滤。
    plydata = PlyData.read(file_dir)  # 读取文件
    data = plydata.elements[0].data  # 读取数据
    data_pd = pd.DataFrame(data)  # 转换成DataFrame, 因为DataFrame可以解析结构化的数据
    data_pd = data_pd.replace(np.nan, 0, regex=True)

    y_img = np.array(data_pd.iloc[:, 2])
    # y_img=np.where(y_img<0,0,y_img)
    hist,bins=np.histogram(y_img)
    point=0
    for i,h in enumerate(hist):
        if h<100000 and h>20000:
            print(h)
            point=i
    min=bins[point]
    max=bins[point+1]
    mask=data_pd.iloc[:,3:6].copy()
    mask['red'] = np.where(((data_pd['y'] > max) | (data_pd['y'] < min)),0, data_pd['red'])
    mask['green'] = np.where(((data_pd['y'] > max) | (data_pd['y'] < min)),0, data_pd['green'])
    mask['blue'] = np.where(((data_pd['y'] > max) | (data_pd['y'] < min)),0, data_pd['blue'])

    mas_img=np.array(mask).reshape(512,640,3)
    cv2.imshow('mas_img', mas_img)
    cv2.waitKey(0)
经过多个ply文件发现,点云的数量不固定,无法通过个数确定物体。
想一下,直接在y图像上找到孔位分析
    plydata = PlyData.read(file_dir)  # 读取文件
    data = plydata.elements[0].data  # 读取数据
    data_pd = pd.DataFrame(data)  # 转换成DataFrame, 因为DataFrame可以解析结构化的数据
    # mat = np.array(data_pd.iloc[:, 3:6]).reshape(-1, 3)
    mat = data_pd.iloc[:, 1]
    mat = mat.replace(np.nan, 0, regex=True)
    mat=np.where(mat<0 ,0,mat)
    mat=np.float32(np.array(mat)).reshape((512,640))
    cv2.imshow("mat", mat)
    cv2.waitKey(0)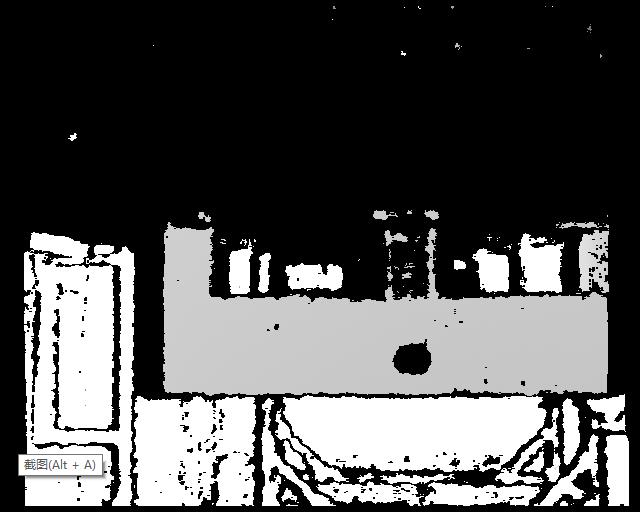
特征匹配
    plydata = PlyData.read(file_dir)  # 读取文件
    data = plydata.elements[0].data  # 读取数据
    data_pd = pd.DataFrame(data)  # 转换成DataFrame, 因为DataFrame可以解析结构化的数据
    img2=data_pd.iloc[:,3:6]
    img2=np.array(img2).reshape(512,640,3)
    # cv2.imwrite('srcimg.jpg',img2)
    img2=cv2.cvtColor(img2,cv2.COLOR_BGR2GRAY)
    img1=cv2.imread('label6.jpg')
    img1=cv2.cvtColor(img1,cv2.COLOR_BGR2GRAY)
    # 创建sift检测器
    sift = cv2.xfeatures2d.SIFT_create()
    # min_hessian = 400
    # SURF = cv2.xfeatures2d.SURF_create(min_hessian)
    # 查找监测点和匹配符
    kp1, des1 = sift.detectAndCompute(img1, None)
    kp2, des2 = sift.detectAndCompute(img2, None)
    # kp1, des1 = SURF.detectAndCompute(img1, None)
    # kp2, des2 = SURF.detectAndCompute(img2, None)
    """
    keypoint是检测到的特征点的列表
    descriptor是检测到特征的局部图像的列表
    """
    MIN_MATCH_COUNT = 10
    # 获取flann匹配器
    FLANN_INDEX_KDTREE = 0
    indexParams = dict(algorithm=FLANN_INDEX_KDTREE, trees=5)
    searchParams = dict(checks=50)
    flann = cv2.FlannBasedMatcher(indexParams, searchParams)
    # 进行匹配
    matches = flann.knnMatch(des1, des2, k=2)
    good = []
    #舍弃大于0.7的匹配
    for m,n in matches:
        if (m.distance <0.7* n.distance):
            good.append(m)
    draw_params = dict(matchColor = (255,255,0), # draw matches in green color
            singlePointColor = None,
            matchesMask = None, # draw only inliers
            flags = 2)

    img3 = cv2.drawMatches(img1,kp1,img2,kp2,good,None,**draw_params)

    plt.imshow(img3, 'gray'),plt.show()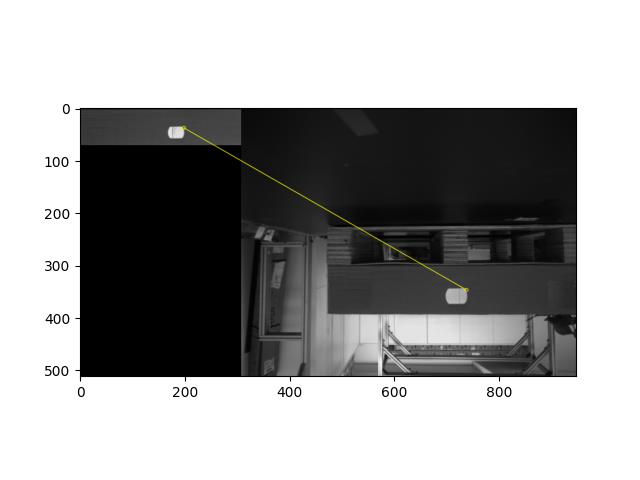
测试多个点云文件,发现该方法不稳定。
模板匹配
# tpl =cv.imread("E:/imageload/sample1.jpg")
    # target = cv.imread("E:/imageload/target1.jpg")
     # 按照灰度图片读入
    plydata = PlyData.read(file_dir)  # 读取文件
    data = plydata.elements[0].data  # 读取数据
    data_pd = pd.DataFrame(data)  # 转换成DataFrame, 因为DataFrame可以解析结构化的数据
    img2=data_pd.iloc[:,3:6]
    target=np.array(img2).reshape(512,640,3)
    target=target.copy()
    tpl=cv2.imread('label6.jpg')
    methods = [cv.TM_SQDIFF_NORMED, cv.TM_CCORR_NORMED, cv.TM_CCOEFF_NORMED]   #3种模板匹配方法
    th, tw = tpl.shape[:2]
    for md in methods:
        # print(md)
        result = cv.matchTemplate(target, tpl, md)
        min_val, max_val, min_loc, max_loc = cv.minMaxLoc(result)
        if md == cv.TM_SQDIFF_NORMED:
            tl = min_loc
        else:
            tl = max_loc
        br = (tl[0]+tw, tl[1]+th)   #br是矩形右下角的点的坐标
        cv.rectangle(target, tl, br, (0, 0, 255), 2)
        cv2.imshow('target',target)
        cv2.waitKey(0)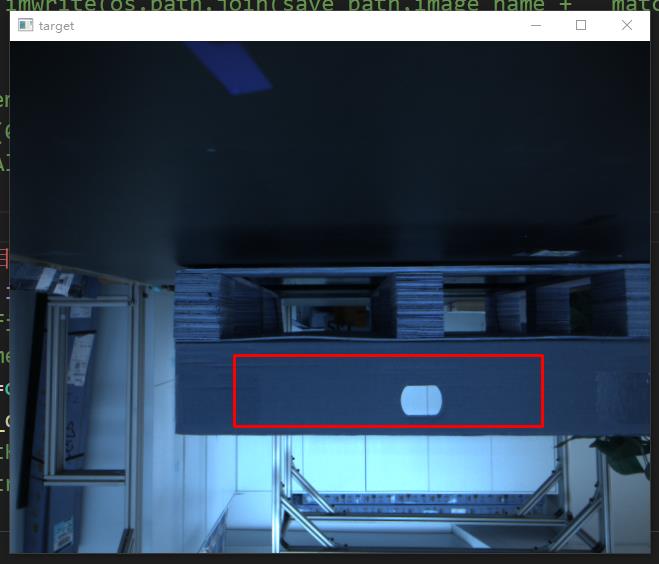
测试过程中也是存在误检测现象
所以先粗定位,然后精细定位
    plydata = PlyData.read(file_dir)  # 读取文件
    data = plydata.elements[0].data  # 读取数据
    data_pd = pd.DataFrame(data)  # 转换成DataFrame, 因为DataFrame可以解析结构化的数据
    img2=data_pd.iloc[:,3:6]
    target=np.array(img2).reshape(512,640,3)
    target=target.copy()
    tpl=cv2.imread('label6.jpg')
    methods = [cv.TM_SQDIFF_NORMED,  cv.TM_CCOEFF_NORMED]   #3种模板匹配方法
    th, tw = tpl.shape[:2]
    for md in methods:
        # print(md)
        result = cv.matchTemplate(target, tpl, md)
        min_val, max_val, min_loc, max_loc = cv.minMaxLoc(result)
        if md == cv.TM_SQDIFF_NORMED:
            tl = min_loc
        else:
            tl = max_loc
        br = (tl[0]+tw, tl[1]+th)   #br是矩形右下角的点的坐标
        sec_search=target[tl[1]:br[1],tl[0]:br[0]]
        sec_search=cv2.cvtColor(sec_search,cv2.COLOR_BGR2GRAY)
        sec_search=cv2.threshold(sec_search,100,255,cv2.THRESH_BINARY)[1]
        contours,hierarchy=cv2.findContours(sec_search,cv2.RETR_TREE,cv2.CHAIN_APPROX_SIMPLE)
        rect=cv2.minAreaRect(contours[0])
        box = np.int0(cv2.boxPoints(rect))
        tl2=[]
        br2=[]
        #左上角增加
        tl2.append(tl[0]+box[0][0])
        tl2.append(tl[1]+box[0][1])
        #右下角减小
        br2.append(tl2[0]+box[2][0]-box[0][0])
        br2.append(tl2[1]+box[2][1]-box[0][1])
        cv.rectangle(target, tl2, br2, (0, 255, 255), 2)
        cv2.imshow('target',target)
        cv2.waitKey(0)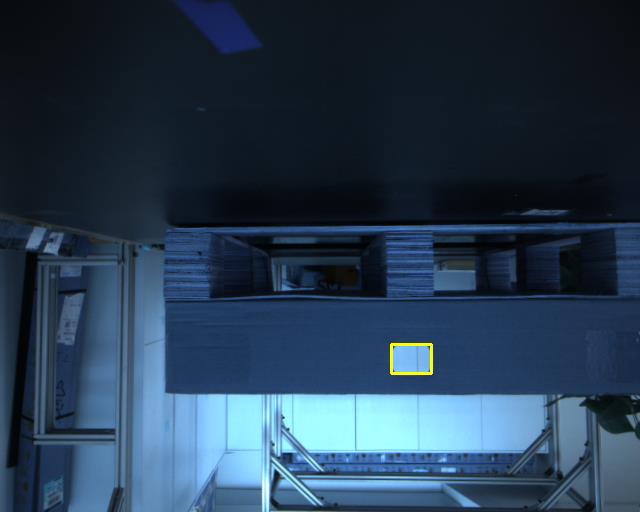
以上是关于托盘孔位项目分析的主要内容,如果未能解决你的问题,请参考以下文章