Python之matplotlib
Posted Harris-H
tags:
篇首语:本文由小常识网(cha138.com)小编为大家整理,主要介绍了Python之matplotlib相关的知识,希望对你有一定的参考价值。
Python之matplotlib
plot(x, y) # 绘制二维图形

figure(num=None, figsize=None, dpi=None, facecolor=None, edgecolor=None, frameon=True)  # 设置图像边框
"""
num: 图像编号或名称,数字为编号 ,字符串为名称
figsize: 指定figure的宽和高,单位为英寸
dpi: 指定绘图对象的分辨率,即每英寸多少个像素,缺省值为80, 1英寸等于2.5cm
facecolor: 背景颜色
edgecolor: 边框颜色
frameon: 是否显示边框
"""

gca() # get current axes 获取当前坐标轴
gca的常见操作
ax = plt.gca()
ax.spines['right'].set_color('none') #首先隐藏右上的脊柱
ax.spines['top'].set_color('none')
ax.xaxis.set_ticks_position('bottom')	# 然后分别移动左下
ax.spines['bottom'].set_position(('data', 0))
ax.yaxis.set_ticks_position('left')
ax.spines['left'].set_position(('data', 0))
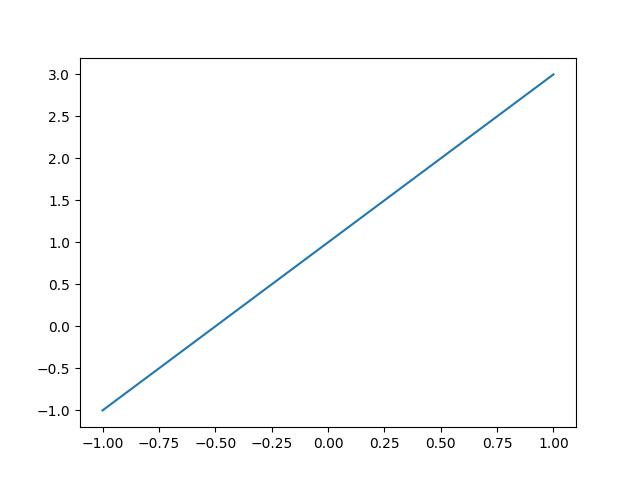
1.绘制一个直线
import matplotlib.pyplot as plt
import numpy as np

x = np.linspace(-1, 1, 50)
# y = 2 * x + 1
y = x ** 2
plt.plot(x, y)
plt.show()

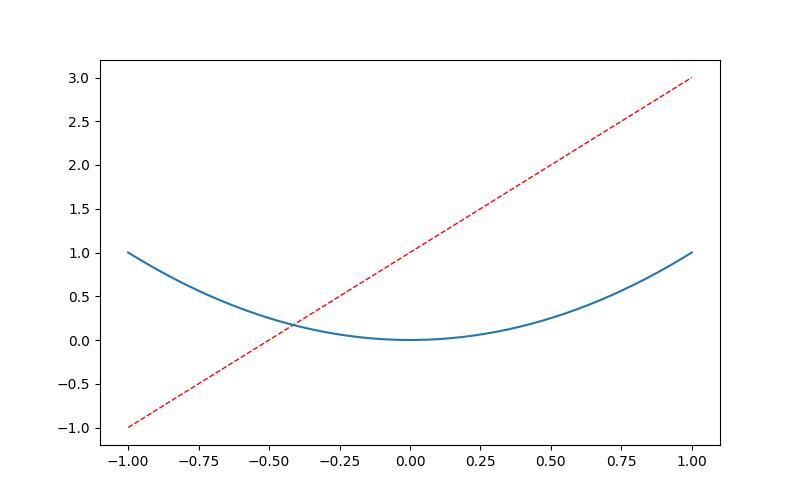
2.设置曲线样式
x = np.linspace(-1, 1, 50)
y1 = 2 * x + 1
y2 = x ** 2

plt.figure() # 一个figure代表一张图
plt.plot(x, y1)

plt.figure(num=2, figsize=(8, 5))
plt.plot(x, y1, color='red', linewidth='1', linestyle='--')
plt.plot(x, y2)

plt.show()

p l o t plot plot的属性 c o l o r , l i n e w i d t h , l i n e s t y l e color,linewidth,linestyle color,linewidth,linestyle分别表示颜色,行宽,和行的样式。
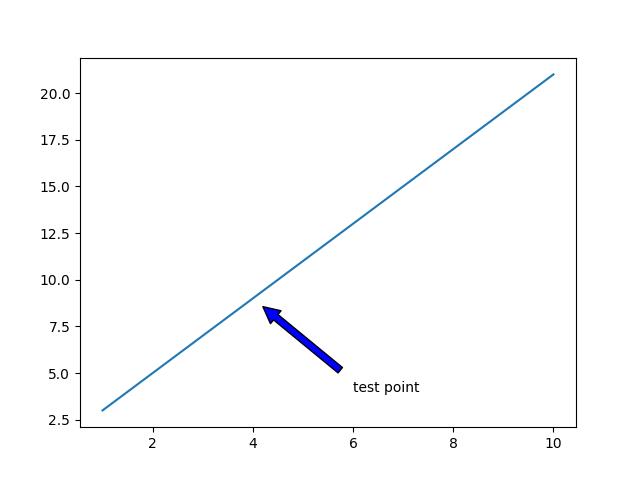
annotate添加注释
    x = np.linspace(1, 10, 50)
    y = 2 * x + 1
    x0, y0 = 4, 9
    plt.plot(x, y)
    #  文本内容text  xy 箭头所值的位置(x,y)   xytext (文本所处的位置)
    plt.annotate('test point', xy=(x0, y0 - 3), xytext=(x0, y0 - 5), arrowprops=dict(arrowstyle='->'))
    plt.show()

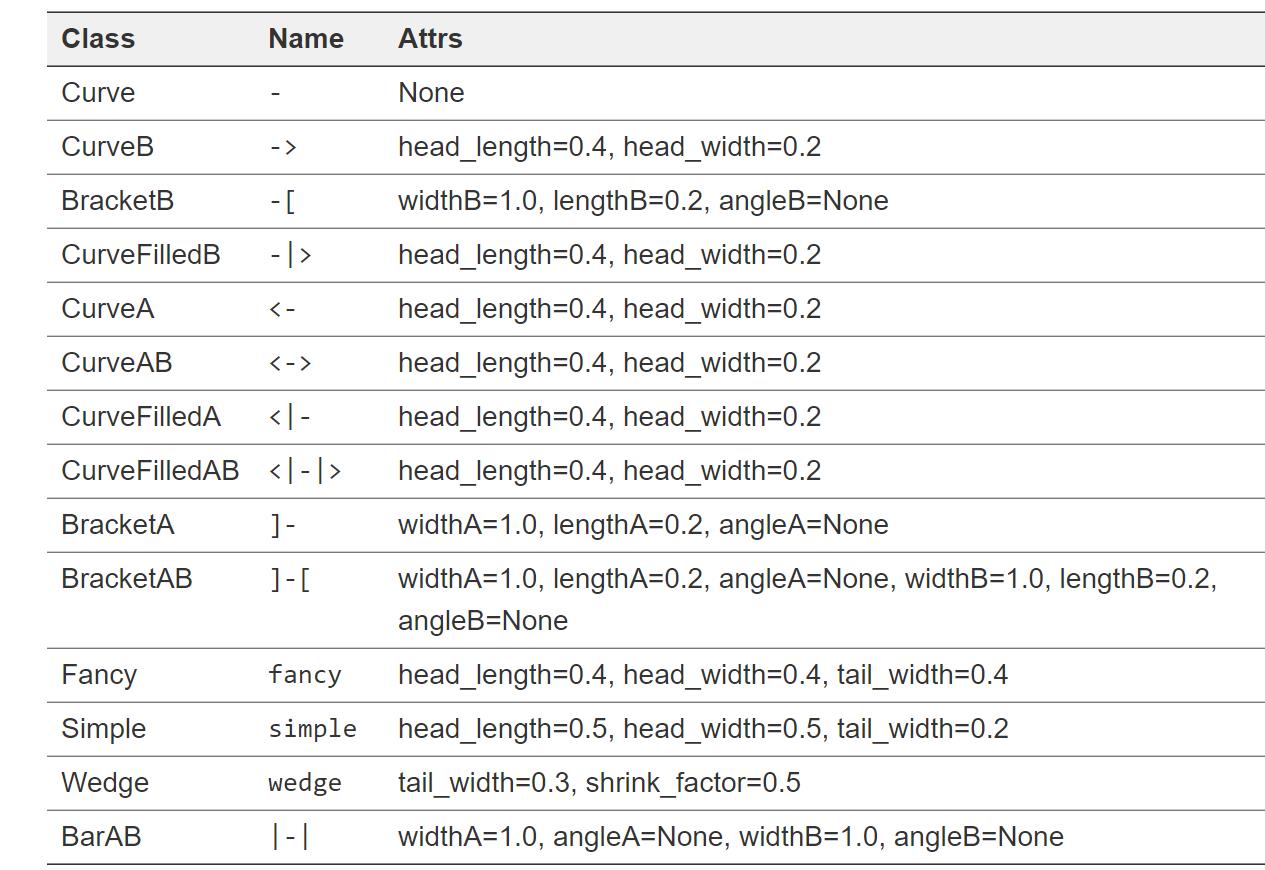
arrowstyle可选的样式:

以上是关于Python之matplotlib的主要内容,如果未能解决你的问题,请参考以下文章