Python之时间序列
Posted 斑点鱼要成为伟大的数据分析师
tags:
篇首语:本文由小常识网(cha138.com)小编为大家整理,主要介绍了Python之时间序列相关的知识,希望对你有一定的参考价值。
1.日期和时间数据类型及工具datatime、time、calendar
from datetime import datetime
now =datetime.now()
now
now.year,now.month,now.day

#datatime以毫秒形式存储日期和时间,timedelta表示两个datatime对象之间的时间差
delta=datetime(2011,1,7)-datetime(2008,6,24,8,15)
delta

delta.days

delta.seconds

#可以给datetime对象加上或减去一个或多个timedelta(timedelta表示两个datatime对象之间的时间差),会产生一个新对象
from datetime import timedelta
start =datetime(2011,1,7)
start+timedelta(12)

start-2*timedelta(12)

%字符串和datetime的相互转换
#利用str或strftime,datetime对象和pandas的Timestamp对象可以被格式化为字符串:
stamp=datetime(2011,1,3)
str(stamp)#包含时间点

stamp.strftime('%Y-%m-%d')#规范成年月日的形式

#datetime.strptime可以将字符串转换为日期
value='2011-01-03'
datetime.strptime(value,'%Y-%m-%d')
datastrs=['7/6/2011','8/6/2011']
[datetime.strptime(x,'%m/%d/%Y') for x in datastrs]

#可以用deteutil中 的parser.parse方法,几乎可以解析所有日期表示形式
from dateutil.parser import parse
parse('2018-02-26')

parse('Jan 31, 1994 20:00 PM')#报错 unknown string format
parse('Jan 31, 1994')

parse('26/7/2017',dayfirst=True)

#pandas用于处理成组日期和缺失值
datastrs=['7/6/2011','8/6/2011']
pd.to_datetime(datastrs)
idx=pd.to_datetime(datastrs+[None])
idx

idx[2]

pd.isnull(idx)

2.时间序列基础
#pandas最基本的时间序列类型是以时间戳为索引的Series
from datetime import datetime
import numpy as np
dates=[datetime(2018,1,1),datetime(2018,1,2),datetime(2018,1,3),datetime(2018,1,4),datetime(2018,1,5),datetime(2018,1,6)]
ts=pd.Series(np.random.randn(6),index=dates)
ts
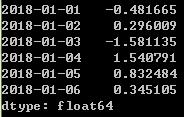
type(ts)

ts.index

ts+ts[::2]
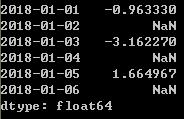
ts.index.dtype

stamp=ts.index[0]
stamp

%索引、选取、子集构造
#TimeSeries是Series的一个子集
stamp=ts.index[2]
stamp

ts[stamp]

ts['1/1/2018']

ts['20180101']

long_ts=pd.Series(np.random.randn(1000),index=pd.date_range('1/1/2018',periods=1000))
long_ts
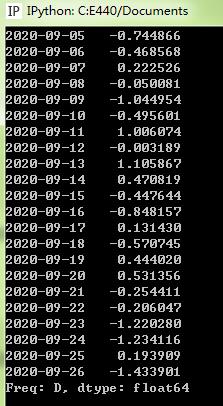
long_ts['2018']
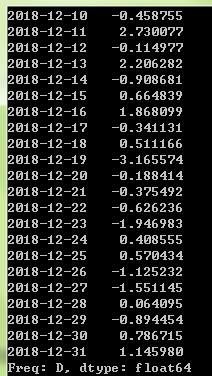
long_ts['2018-05']
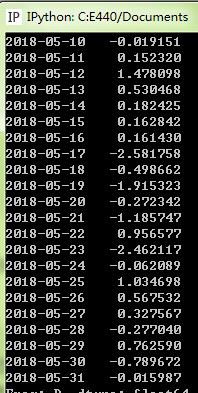
ts[datetime(2018,1,3):]#通过日期切片只对Series有效
ts
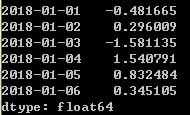
ts['1/1/2018':'1/3/2018']

ts.truncate(after='1/5/2018')#将1月5号之后数据剔除

dates=pd.date_range('1/1/2018',periods=100,freq='W-WED')
long_df=pd.DataFrame(np.random.randn(100,4),index=dates,columns=['Colrado','Texas','NEWYORK','OHIO'])
long_df.head()

long_df.ix['5-2018']

%带有重复索引的时间序列
dates=pd.DatetimeIndex(['1/1/2018','1/2/2018','1/2/2018','1/2/2018','1/3/2018'])
dup_ts=pd.Series(np.arange(5),index=dates)
dup_ts

#监测索引是不是唯一
dup_ts.index.is_unique
grouped=dup_ts.groupby(level=0)#索引的唯一一层
grouped

grouped.mean()

grouped.count()

3.日期的范围、频率以及移动
#我们可以将不规则的时间序列转换为一个固定频率(每日)的时间序列
dates=[datetime(2018,1,1),datetime(2018,1,5),datetime(2018,1,8),datetime(2018,1,9),datetime(2018,1,11),datetime(2018,1,14)]
ts=pd.Series(np.random.randn(6),index=dates)
ts
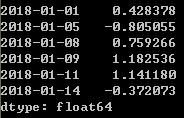
ts.resample('D')

%生成日期范围
#可用pandas.date_range生成指定长度的DatetimeIndex:
index=pd.date_range('4/1/2017','6/1/2017')
index
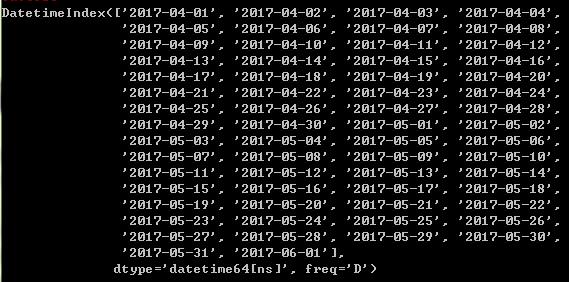
pd.date_range(start='4/1/2017',periods=20)

pd.date_range(end='6/1/2017',periods=20)

pd.date_range('1/1/2017','12/1/2017',freq='BM')#business end of month 每个月最后一天

pd.date_range('5/2/2017 12:56:31',periods=5)

pd.date_range('5/2/2017 12:56:31',periods=5,normalize=True)#规范化

%频率和日期偏移量
from pandas.tseries.offsets import Hour,Minute
hour=Hour()
four_hour=Hour(4)
four_hour

pd.date_range('1/1/2017','1/3/2017',freq='4h')
Hour(2)+Minute(30)

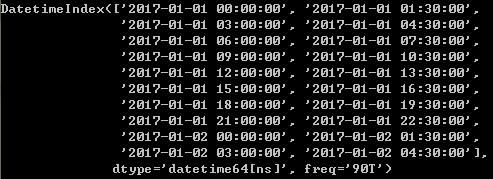
pd.date_range('1/1/2017',periods=20,freq='1h30min')
%WOM日期:Week of month
rng=pd.date_range('1/1/2017','9/1/2017',freq='WOM-3FRI')#得到每月第三个星期五
list(rng)

rng

%移动(超前或滞后)数据shift
import numpy as np
ts=pd.Series(np.random.randn(4),index=pd.date_range('1/1/2017',periods=4,freq='M'))
ts

ts/ts.shift(1)-1#相当于X2/X1-1

ts.shift(2,freq='M')

ts.shift(2,freq='D')

ts.shift(2,freq='3D')

ts.shift(2,freq='90D')

ts.shift(2,freq='90T')

%通过偏移量对日期进行位移
from pandas.tseries.offsets import Day,MonthEnd
from datetime import datetime
now=datetime(2017,1,9)
now+3*Day()

now+MonthEnd()

now+MonthEnd(2)

#通过锚点偏移量的rollforward\rollback,可将日期向前或向后移动
offset=MonthEnd()
offset.rollforward(now)#未来

offset.rollback(now)#过去

ts=pd.Series(np.random.randn(20),index=pd.date_range('1/15/2017',periods=20,freq='4d'))
ts.groupby(offset.rollforward).mean()

#快速实现的方法resample
ts.resample('M',how='mean')

4.时区处理
import pytz
pytz.common_timezones[-5:]
tz=pytz.timezone('US/Eastern')
tz

%本地化和转换
rng=pd.date_range('1/1/2017',periods=6,freq='D')
ts=pd.Series(np.random.randn(len(rng),index=rng)
print(ts.index.tz)#不知道为什么没有结果,一直要求继续输入
5.时区及其算术运算
6.重采样及频率转换
7.时间序列绘图
import os
import pandas as pd
#更改当前工作目录
os.chdir('C:\Users\E440\Desktop\PythonStudy\input')
os.getcwd()
import matplotlib.pyplot as plt
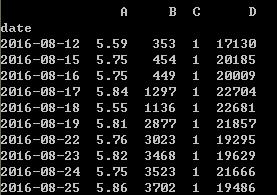
close_px_all=pd.read_csv('GEELY.csv',parse_dates=True,index_col=0)#数据是我随便找的,只要是时间序列就好啦。
close_px_all[:10]
close_px_all=pd.DataFrame(close_px_all)
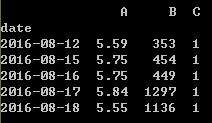
close_px=close_px_all[['A','B','C']]
close_px=close_px.resample('B',fill_method='ffill')
close_px.head()
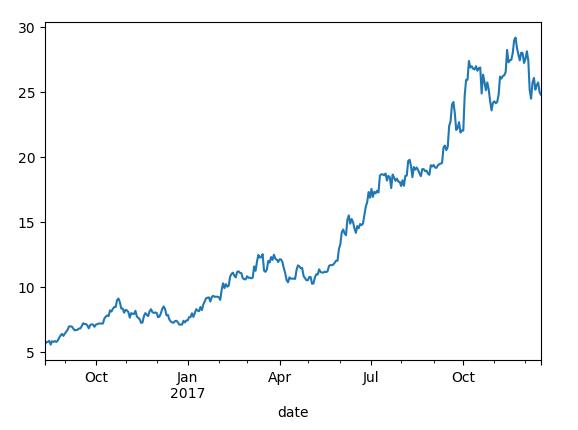
close_px['A'].plot()
plt.show()
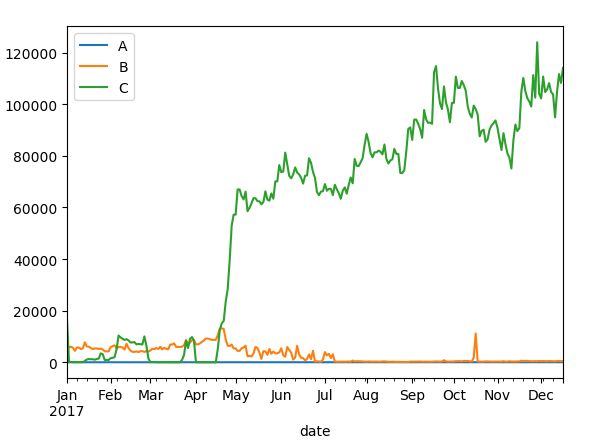
close_px.ix['2017'].plot()
plt.show()
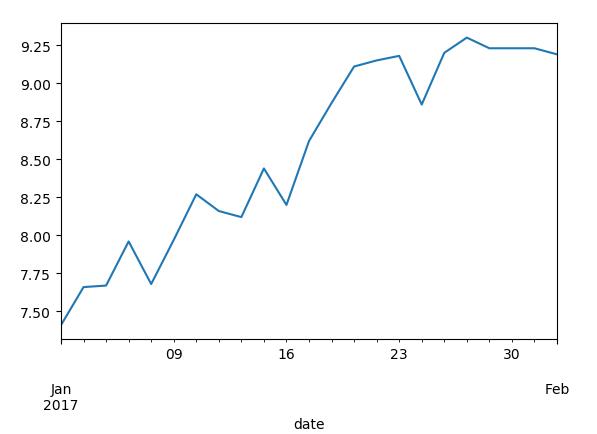
close_px['A'].ix['2017-01-01':'2017-02-01'].plot()
plt.show()
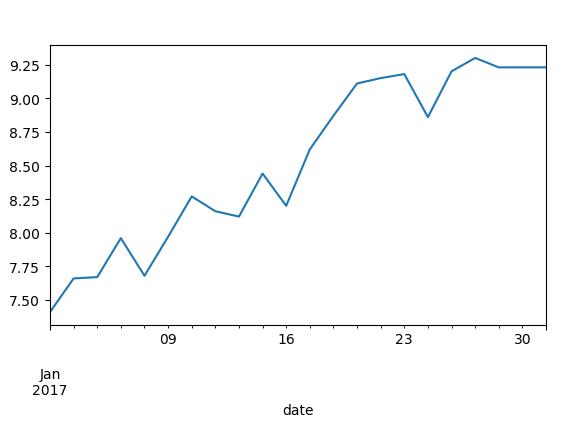
close_px['A'].ix['01-2017':'01-2017'].plot()
plt.show()
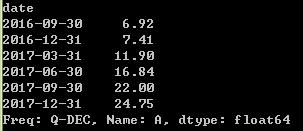
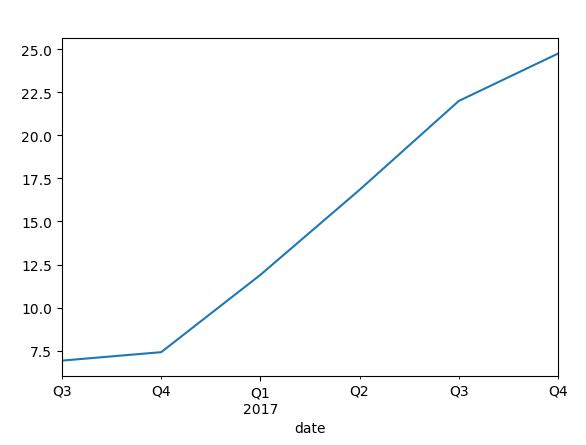
#按季度画图
appl=close_px['A'].resample('Q-DEC',fill_method='ffill')
appl
appl.ix['2016':].plot()
plt.show()
8.移动窗口函数:常见于时间序列的数组变换
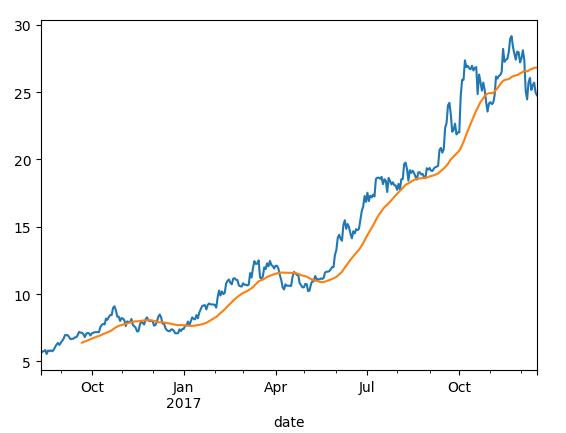
close_px.A.plot()
pd.rolling_mean(close_px.A,30).plot()#30日均线
plt.show()
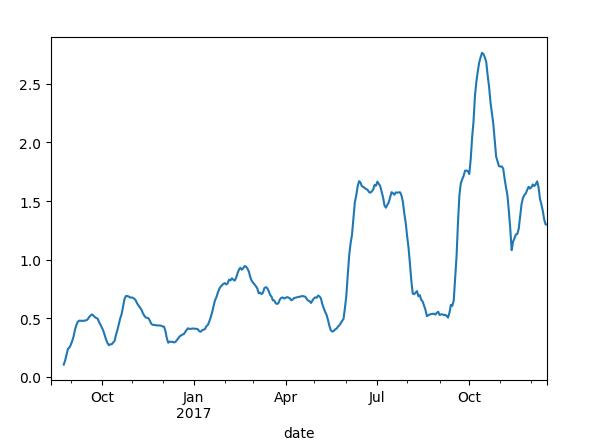
appl_std=pd.rolling_std(close_px.A,30,min_periods=10)#30日每日回报标准差
appl_std
appl_std.plot()
plt.show()
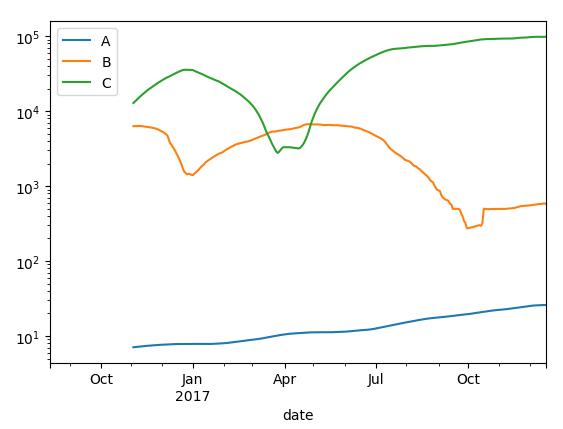
#通过rolling_mean计算扩展平均
expanding_mean=lambda x:rolling_mean(x,len(x),min_periods=1)
pd.rolling_mean(close_px,60).plot(logy=True)
plt.show()
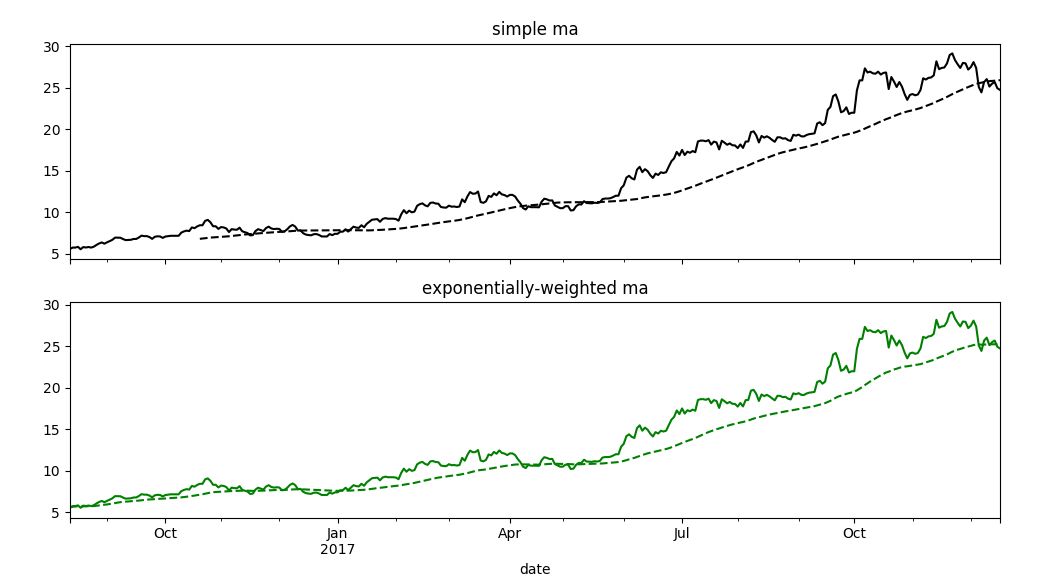
%指数加权函数
fig,axes =plt.subplots(nrows=2,ncols=1,sharex=True,sharey=True,figsize=(12,7))
appl_px=close_px.A['2016':'2017']
ma60=pd.rolling_mean(appl_px,60,min_periods=50)#简单移动平均
ewma60=pd.ewma(appl_px,span=60)#指数加权平均
appl_px.plot(style='k-',ax=axes[0])
ma60.plot(style='k--',ax=axes[0])
appl_px.plot(style='g-',ax=axes[1])
ewma60.plot(style='g--',ax=axes[1])
axes[0].set_title('simple ma')
axes[1].set_title('exponentially-weighted ma')
plt.show()
%二元移动窗口函数:两个时间序列之间相关性:corr
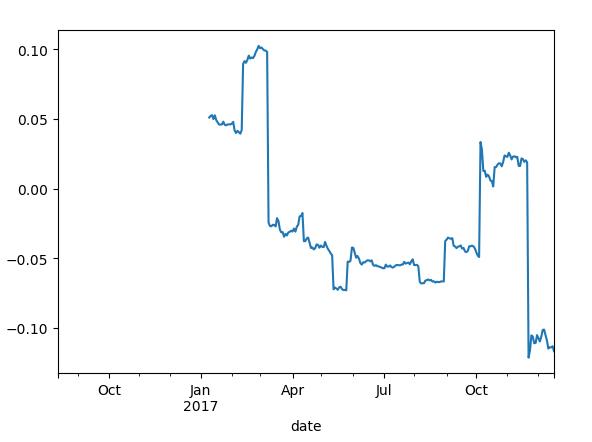
spx_px=close_px_all['D']
spx_rets=spx_px/spx_px.shift(1)-1#标准普尔500指数
returns=close_px.pct_change()
corr=pd.rolling_corr(returns.A,spx_rets,125,min_periods=100)
corr.plot()
plt.show()
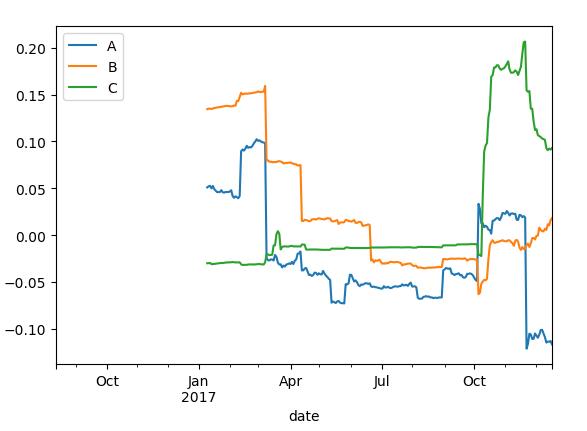
corr=pd.rolling_corr(returns,spx_rets,125,min_periods=100)
corr.plot()
plt.show()
%用户定义的移动创口函数
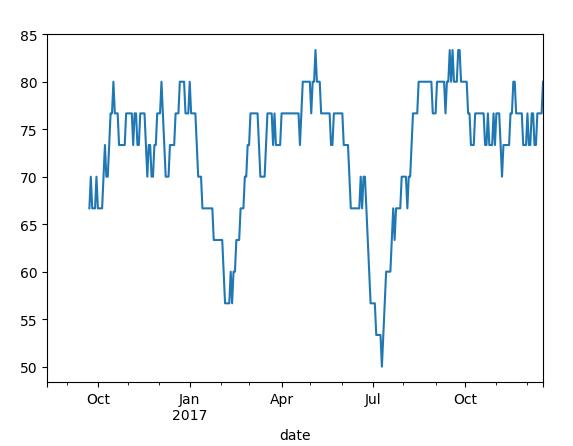
rolling_apply可以使你在移动窗口应用自己设计的数组函数
#AAPL的2%回报率的百分等级
from scipy.stats import percentileofscore
score_at_2percent=lambda x : percentileofscore(x,0.02)
result=pd.rolling_apply(returns.A,30,score_at_2percent)
result.plot()
plt.show()
9.性能和内存使用方面的注意事项
不想看了,略

一起学习的小伙伴如果有什么想法或者意见,欢迎沟通~
投稿|沟通邮箱:yzhmry1314@163.com
以上是关于Python之时间序列的主要内容,如果未能解决你的问题,请参考以下文章