Pandas 处理时间序列数据
Posted Python学习派
tags:
篇首语:本文由小常识网(cha138.com)小编为大家整理,主要介绍了Pandas 处理时间序列数据相关的知识,希望对你有一定的参考价值。
Resampling, shifting and windowing
pandas提供了重采样、移位和加窗的操作,通过它们,我们可以更加灵活的处理时间序列数据。pandas-datareader(以前的版本pandas.io.data以不可用)为导入金融数据提供了方便,包括Yahoo finance, Google Finance和其他的一些。
Resampling
 1from pandas_datareader import data
 2goog = data.DataReader('GOOG', start = '2004', end = '2016', data_source = 'google')
 3goog.head()
 4>>> out:
 5             High   Low    Open    Close   Volume  Adj Close
 6Date
 72004-08-19    51.693783   47.669952   49.676899   49.845802   44994500.0  49.845802
 82004-08-20    54.187561   49.925285   50.178635   53.805050   23005800.0  53.805050
 92004-08-23    56.373344   54.172661   55.017166   54.346527   18393200.0  54.346527
102004-08-24    55.439419   51.450363   55.260582   52.096165   15361800.0  52.096165
112004-08-25    53.651051   51.604362   52.140873   52.657513   9257400.0   52.657513
12# 选择收盘价
13goog = good['Close']
14#goog收盘价的走势
15%matplotlib inline
16import matplotlib.pyplot as plt
17import seaborn;seaborn.set()
18goog.plot()
1#不同采样方法(下采样)的效果图
2goog.plot(alpha=0.5, style='-')
3goog.resample('BA').mean().plot(style=':')
4goog.asfreq('BA').plot(style='--');
5plt.legend(['input', 'resample', 'asfreq'],
6           loc='upper left')
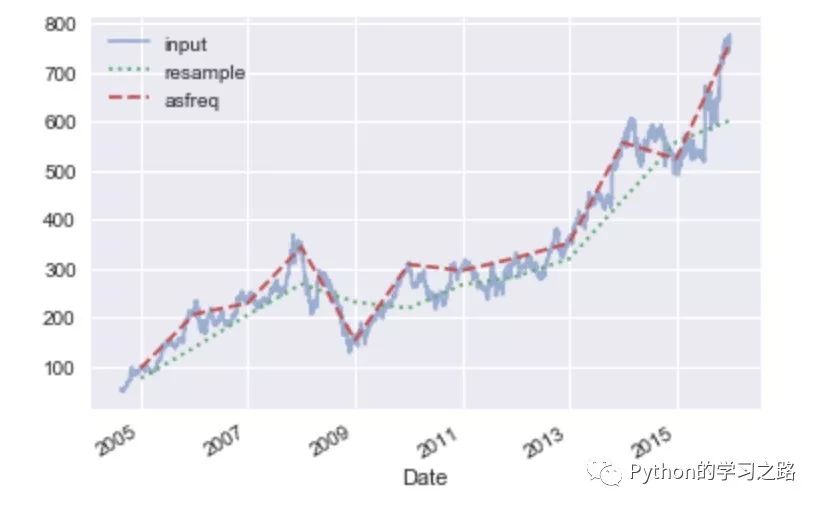
1#上采样,缺失值向前和向后填充
2fig, ax = plt.subplots(2, sharex=True)
3data = goog.iloc[:10]
4data.asfreq('D').plot(ax=ax[0], marker='o')
5data.asfreq('D', method='bfill').plot(ax=ax[1], style='-o')
6data.asfreq('D', method='ffill').plot(ax=ax[1], style='--o')
7ax[1].legend(["back-fill", "forward-fill"])
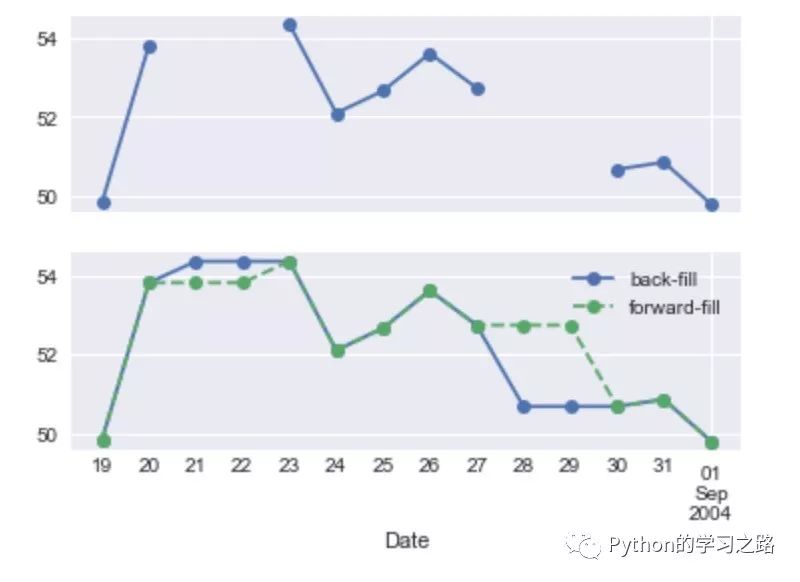
其中BA表示business year end,D表示Calendar day,具体的如下表所示:
| Code | Description |
|---|---|
| D | Calendar day |
| W | Weekly |
| M | Month end |
| Q | Quarter end |
| A | Year end |
| H | Hours |
| T | Minutes |
| S | Seconds |
| L | Milliseonds |
| U | Microseconds |
| N | Nanoseconds |
| B | Business day |
| BM | Business month end |
| BQ | Business quarter end |
| BA | Business year end |
| BH | Business hours |
Time-shifts
pandas为数据shift提供了两种操作方式,包括shift和tshift。这两种方式是不同的,shift是移动数据,而tshift则是移动index,但是我们都可以自己制定frequency
 1import pandas as pd
 2fig, ax = plt.subplots(3, sharey=True)
 3# 900 days frequency
 4goog = goog.asfreq('D', method='pad')
 5goog.plot(ax=ax[0])
 6goog.shift(900).plot(ax=ax[1])
 7goog.tshift(900).plot(ax=ax[2])
 8# legends and annotations
 9local_max = pd.to_datetime('2007-11-05')
10offset = pd.Timedelta(900, 'D')
11ax[0].legend(['input'], loc=2)
12ax[0].get_xticklabels()[4].set(weight='heavy', color='red')
13ax[0].axvline(local_max, alpha=0.3, color='red')
14ax[1].legend(['shift(900)'], loc=2)
15ax[1].get_xticklabels()[4].set(weight='heavy', color='red')
16ax[1].axvline(local_max + offset, alpha=0.3, color='red')
17ax[2].legend(['tshift(900)'], loc=2)
18ax[2].get_xticklabels()[1].set(weight='heavy', color='red')
19ax[2].axvline(local_max + offset, alpha=0.3, color='red')
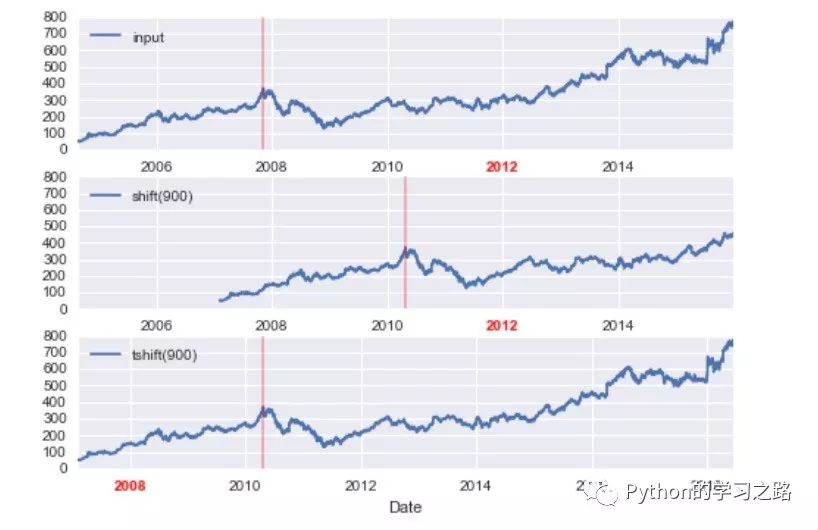
我们可以发现,对于shift 900 days,前面的数据缺失为NA,而对于tshift则是通过索引移动900 days。
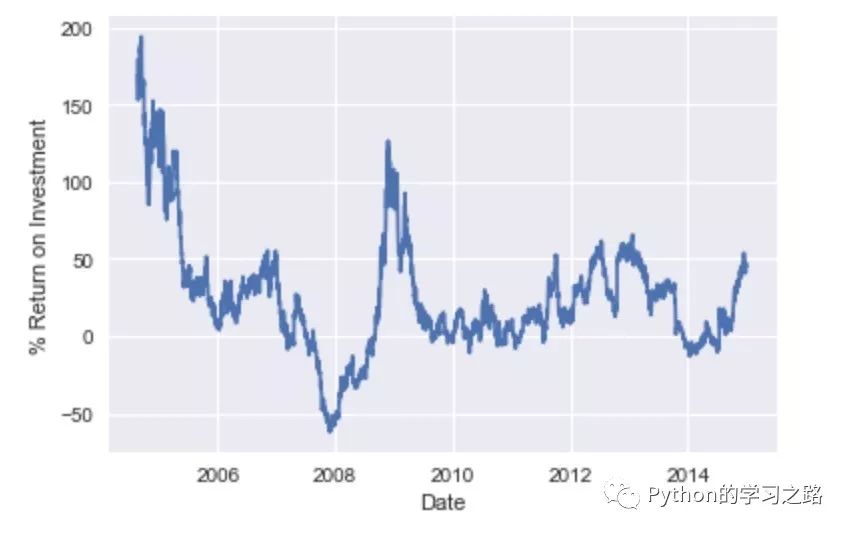
简单的例子运用:
1#投资一年的收益率
2ROI = 100 * (goog.tshift(-365) / goog - 1)
3ROI.plot()
4plt.ylabel('% Return on Investment')
Rolling windows
滚动窗口统计是pandas提供的另一个非常方便的功能,比如我们经常需要算移动平均值和标准差等。
1# 一年的rolling mean 和 rolling deviation
2rolling = goog.rolling(365, center=True)
3data = pd.DataFrame({'input': goog,
4                    'one-year rolling_mean': rolling.mean(),
5                    'one-year rolling_std': rolling.std()})
6ax = data.plot(style=['-', '--', ':'])
7ax.lines[0].set_alpha(0.3)
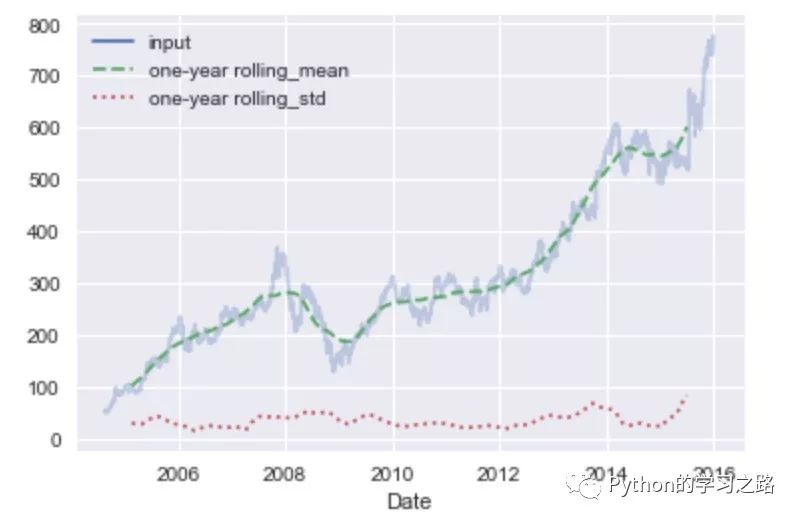
更多的细节学习可以参考http://pandas.pydata.org/pandas-docs/stable/timeseries.html
Example
我们使用的数据可以从https://data.seattle.gov/Transportation/Fremont-Bridge-Hourly-Bicycle-Counts-by-Month-Octo/65db-xm6k这里直接下载,数据内容Seattle’s Fremont Bridge每小时自行车的数量。
 1path = '/Users/minjiayong/Desktop/'
 2data = pd.read_csv(path + 'data.csv', index_col='Date', parse_dates=True)
 3data.head()
 4>>> out: Fremont Bridge East Sidewalk    Fremont Bridge West Sidewalk
 5Date
 62012-10-03 00:00:00    9.0 4.0
 72012-10-03 01:00:00    6.0 4.0
 82012-10-03 02:00:00    1.0 1.0
 92012-10-03 03:00:00    3.0 2.0
102012-10-03 04:00:00    1.0 6.0
11#为了方便,改变columns name
12data.columns = ['West', 'East']
13#求和,记为新列Total
14data['Total'] = data.eval('West + East')
15#一些统计总结
16data.dropna().describe()
17>>> out: West    East    Total
18count    53271.000000    53271.000000    53271.000000
19mean    57.434401   54.368549   111.802951
20std    82.795998   71.282743   140.682271
21min    0.000000    0.000000    0.000000
2225%    7.000000    7.000000    15.000000
2350%    29.000000   30.000000   61.000000
2475%    70.000000   72.000000   146.000000
25max    717.000000  698.000000  957.000000
26## 可视化数据
27data.plot()
28plt.ylabel('Hourly Bicycle Count');
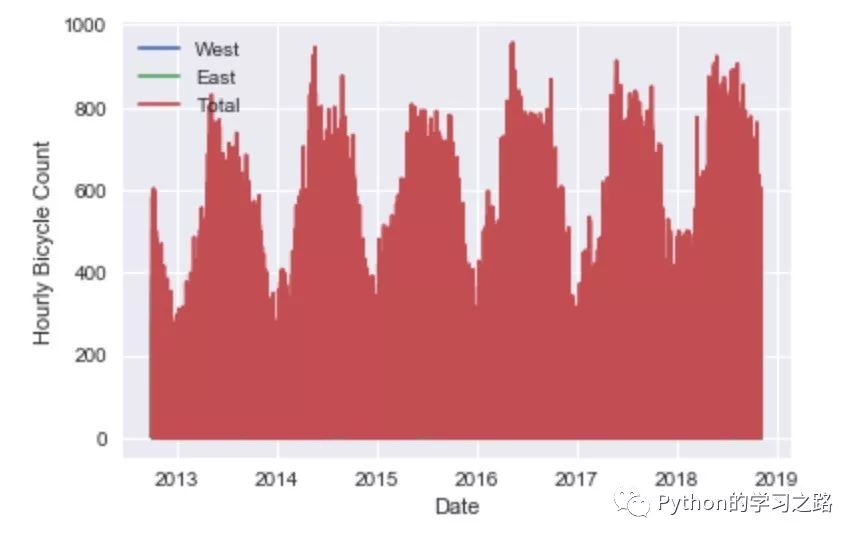
我们看到数据非常密集,肉眼无法得到有用的信息,因此我们可以尝试一下以week为周期对数据进行采样。
1weekly = data.resample('W').sum()
2weekly.plot(style=[':', '--', '-'])
3plt.ylabel('Weekly bicycle count')
4plt.legend(loc = 2)
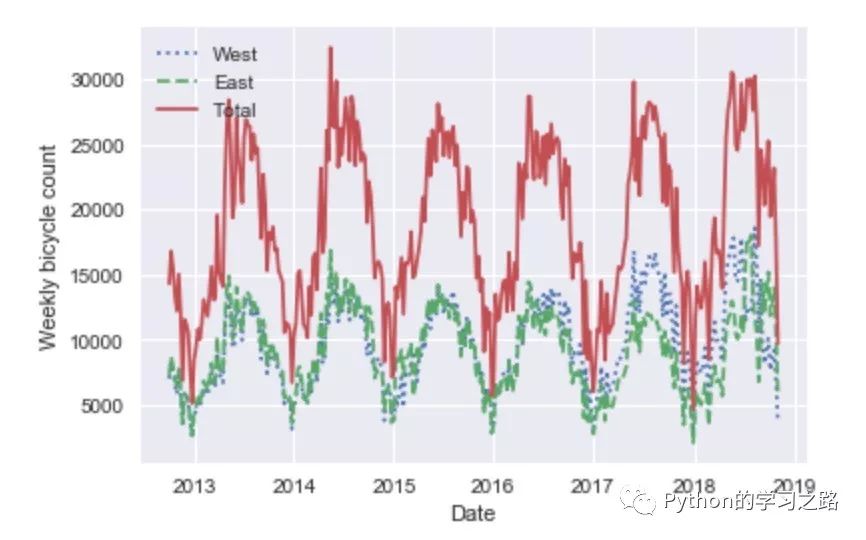
我们还可以使用rolling_mean,即移动平均值的方法来展示我们的数据。
1daily = data.resample('D').sum()
2            daily.rolling(30, center=True).sum().plot(style=[':', '--', '-'])
3            plt.ylabel('mean hourly count')
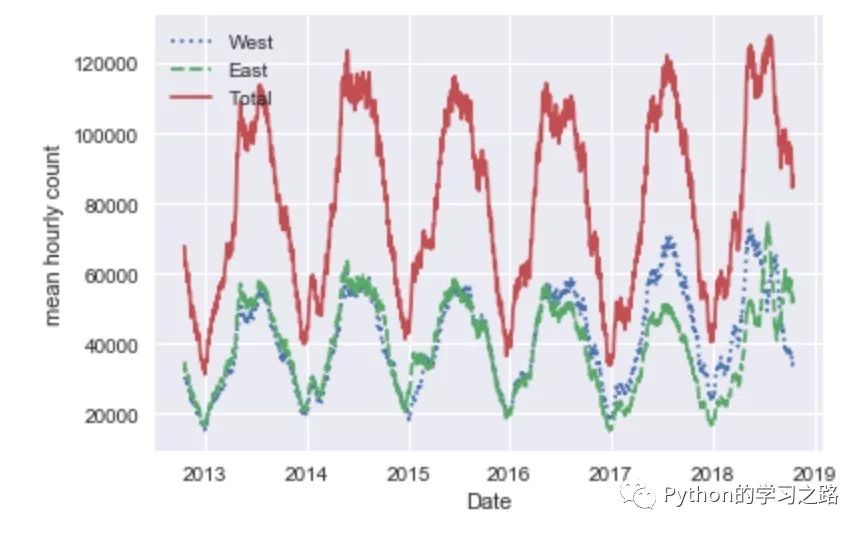
我们可以看到,结果呈现锯齿状,这是由于窗口的切断造成的,因此我们可以继续使用窗口函数获得更加平滑的rolling_mean。这里我们使用的窗口宽度为50 days,Gaussian的窗口宽度为10 days。
1 daily.rolling(50, center=True,
2 win_type='gaussian').sum(std=10).plot(style=[':', '--', '-'])
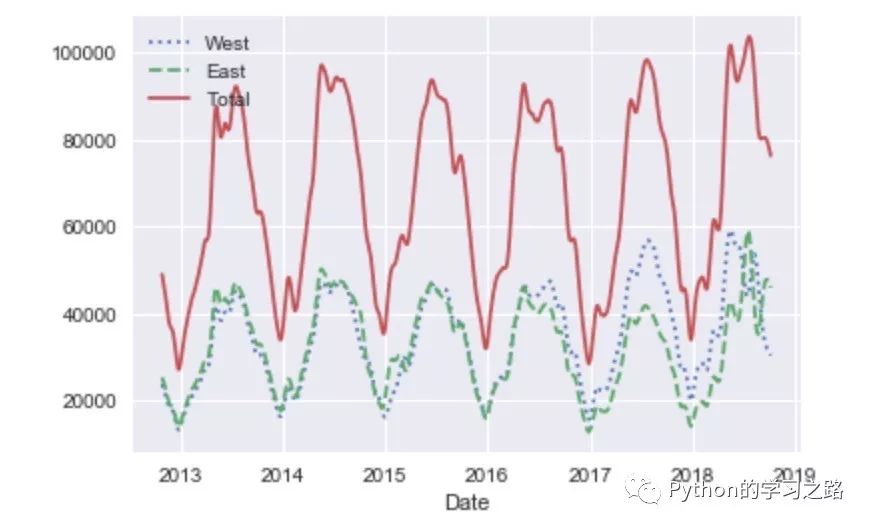
正如我们所想,曲线都变得平滑了!
我们可以继续探索一下这个数据,比如看一下每小时平均通过的自行车的数量。
1import numpy as np
2by_time = data.groupby(data.index.time).mean()
3hourly_ticks = 4 * 60 * 60 * np.arange(6)
4by_time.plot(xticks=hourly_ticks, style=[':', '--', '-'])
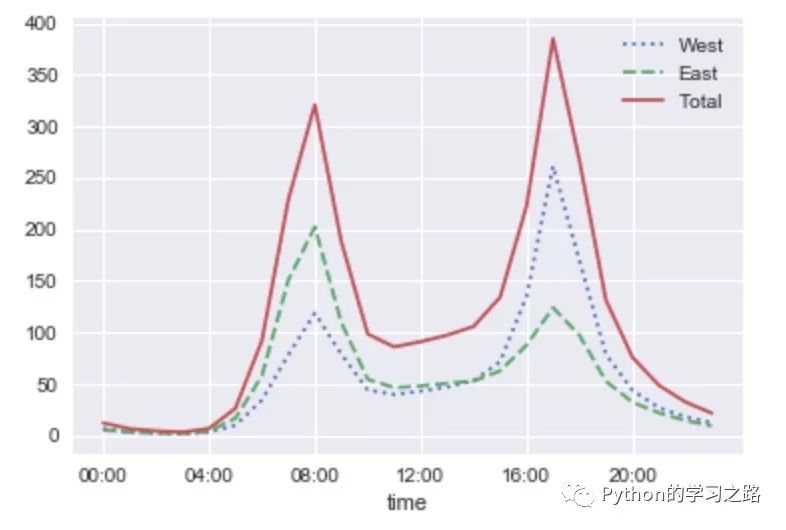
图中的曲线都是很明显的双峰分布,早上8点和晚上5点都是峰值,这两个时间点平均的自行车数量比较多。
同时我们也可以看一下这种数据是否星期分布的效应:
1by_weekday = data.groupby(data.index.dayofweek).mean()
2by_weekday.index = ['Mon', 'Tues', 'Wed', 'Thurs', 'Fri', 'Sat', 'Sun']
3by_weekday.plot(style=[':', '--', '-'])
对于每周的自行车的通过数量的平均数,不同的日期也有着明显的不同,在Sat和Sun这两天急剧下降,大于缩小了1倍左右。
既然如此,我们何不将两个特征结合起来,即单独的分析weekday和weekend。看看我们能得到什么有趣的结论。
1weekend = np.where(data.index.weekday < 5, 'Weekday', 'Weekend')
2by_time = data.groupby([weekend, data.index.time]).mean()
3import matplotlib.pyplot as plt
4fig, ax = plt.subplots(1, 2, figsize=(14, 5))
5by_time.ix['Weekday'].plot(ax=ax[0], title='Weekdays',
6                                       xticks=hourly_ticks, style=[':', '--', '-'])
7by_time.ix['Weekend'].plot(ax=ax[1], title='Weekends',
8                                       xticks=hourly_ticks, style=[':', '--', '-'])
我们在左边的图中可以看到一个双峰分布,而右边的图则是单峰分布,这表明在weekday,有两个时间段存在峰值,自行车的数量比较多;而在weekend中,只有一个峰值存在,与我们前面所看的Average hourly counts不太一样。有兴趣的可以进一步的对该数据集进行深入的分析,有很多有趣的结论等着你去发现哦!
以上是关于Pandas 处理时间序列数据的主要内容,如果未能解决你的问题,请参考以下文章