R语言基于DynNom包绘制动态列线图
Posted
tags:
篇首语:本文由小常识网(cha138.com)小编为大家整理,主要介绍了R语言基于DynNom包绘制动态列线图相关的知识,希望对你有一定的参考价值。
参考技术A 以下为该包的帮助文件内容Dynamic nomogram to visualise statistical models
Description
DynNom is a generic function to display the results of statistical model objects as a dynamic nomogram in an 'RStudio' panel or web browser. DynNom supports a large number of model objects from a variety of packages.
Usage
DynNom(model, data = NULL, clevel = 0.95, m.summary = c("raw", "formatted"),
covariate = c("slider", "numeric"), ptype = c("st", "1-st"),
DNtitle = NULL, DNxlab = NULL, DNylab = NULL, DNlimits = NULL,
KMtitle = NULL, KMxlab = NULL, KMylab = NULL)
DynNom.core(model, data, clevel, m.summary, covariate, DNtitle, DNxlab, DNylab, DNlimits)
DynNom.surv(model, data, clevel, m.summary, covariate,
ptype, DNtitle, DNxlab, DNylab, KMtitle, KMxlab, KMylab)
Arguments
model
an lm, glm, coxph, ols, Glm, lrm, cph, mgcv::gam or gam::gam model objects.
data
a dataframe of the accompanying dataset for the model (if required).
clevel
a confidence level for constructing the confidence interval. If not specified, a 95% level will be used.
m.summary
an option to choose the type of the model output represented in the 'Summary Model' tab. "raw" (the default) returns an unformatted summary of the model; "formatted" returns a formatted table of the model summary using stargazer package.
covariate
an option to choose the type of input control widgets used for numeric values. "slider" (the default) picks out sliderInput; "numeric" picks out numericInput.
ptype
an option for coxph or cph model objects to choose the type of plot which displays in "Survival plot" tab. "st" (the default) returns plot of estimated survivor probability (S(t)). "1-st" returns plot of estimated failure probability (1-S(t)).
DNtitle
a character vector used as the app's title. If not specified, "Dynamic Nomogram" will be used.
DNxlab
a character vector used as the title for the x-axis in "Graphical Summary" tab. If not specified, "Probability" will be used for logistic model and Cox proportional model objects; or "Response variable" for other model objects.
DNylab
a character vector used as the title for the y-axis in "Graphical Summary" tab (default is NULL).
DNlimits
a vector of 2 numeric values used to set x-axis limits in "Graphical Summary" tab. Note: This also removes the 'Set x-axis ranges' widget in the sidebar panel.
KMtitle
a character vector used as KM plot's title in "Survival plot" tab. If not specified, "Estimated Survival Probability" for ptype = "st" and "Estimated Probability" for ptype = "1-st" will be used.
KMxlab
a character vector used as the title for the x-axis in "Survival plot" tab. If not specified, "Follow Up Time" will be used.
KMylab
a character vector used as the title for the y-axis in "Survival plot" tab. If not specified, "S(t)" for ptype = "st" and "F(t)" for ptype = "1-st" will be used.
Value
A dynamic nomogram in a shiny application providing individual predictions which can be used as a model visualisation or decision-making tools.
The individual predictions with a relative confidence interval are calculated using the predict function, displaying either graphically as an interactive plot in the Graphical Summary tab or a table in the Numerical Summary tab. A table of model output is also available in the Model Summary tab. In the case of the Cox proportional hazards model, an estimated survivor/failure function will be additionally displayed in a new tab.
Please cite as:
Jalali, A., Roshan, D., Alvarez-Iglesias, A., Newell, J. (2019). Visualising statistical models using dynamic nomograms. R package version 5.0.
Author(s)
Amirhossein Jalali, Davood Roshan, Alberto Alvarez-Iglesias, John Newell
Maintainer: Amirhossein Jalali a.jalali2@nuigalway.ie
References
Banks, J. 2006. Nomograms. Encyclopedia of Statistical Sciences. 8.
Easy web applications in R. http://shiny.rstudio.com
Frank E Harrell Jr (2017). rms: Regression Modeling Strategies. R package version 4.5-0. https://CRAN.R-project.org/package=rms
See Also
DNbuilder, getpred.DN
R语言为广义线性模型绘制列线图(nomogram)实战
R语言为广义线性模型绘制列线图(nomogram)实战

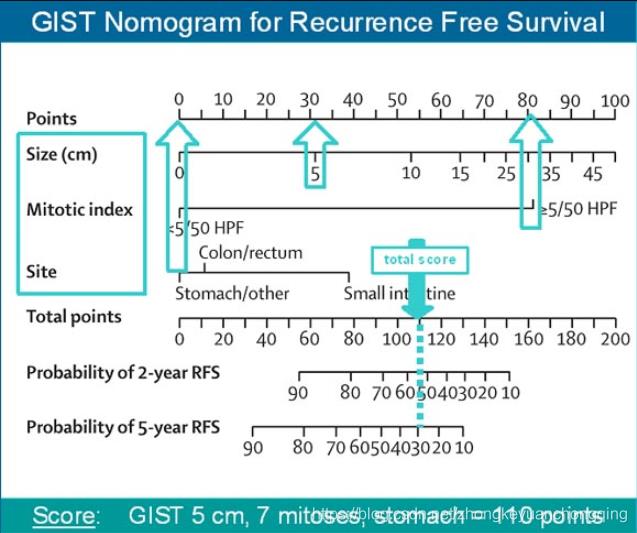
我们来看图说话:

gist是一种胃肠道间质瘤,作者构建了无复发生存率的logistic回归模型。
并构建了如下的列线图或者nomogram
现在假设新来了以为患者:我们知道的信息如下,size为5,Mltotic index 为最右侧值、site为最左侧值;
好了开始查表,就是查nomogram图。
那么如果size对应的是5,那么他对应的分数就是30,MItotic index为最右侧值,则对应的分数为80分,而site对应的是最左侧、则它对应的得分为0分;
那么他们的家和就是:30+80+0=110,
以上是关于R语言基于DynNom包绘制动态列线图的主要内容,如果未能解决你的问题,请参考以下文章