highcharts做柱状图,怎样设置柱子宽度
Posted
tags:
篇首语:本文由小常识网(cha138.com)小编为大家整理,主要介绍了highcharts做柱状图,怎样设置柱子宽度相关的知识,希望对你有一定的参考价值。
可以通过设置plotOptions内对应series的pointWidth也就是数据点的宽度值加以控制,完整代码如下所示:view sourceprint?
01.$(function ()
02.$('#container').highcharts(
03.chart:
04.type: 'bar'
05.,
06.xAxis:
07.categories: ['Jan', 'Feb', 'Mar']
08.,
09.
10.plotOptions:
11.series:
12.pointWidth: 3 //柱子的宽度值 单位为px
13.
14.,
15.credits:
16.text: 'highcharts的博客',
17.href: 'http://www.stepday.com/myblog/?highcharts',
18.position:
19.align: 'right', //水平居右
20.verticalAlign: 'bottom' //垂直底部
21.,
22.style:
23.cursor: 'pointer', //鼠标样式为手型
24.color: '#FF0000', //字体颜色
25.fontSize: '10px' //字体大小
26.
27.,
28.series: [
29.data: [29.9, 71.5, 106.4]
30.]
31.);
32.); 参考技术A
设置 plotOptions.column.pointWidth 即可,
// ...
plotOptions:
column:
pointWidth:20
// 见 API 文档 http://www.hcharts.cn/api/index.php#plotOptions.column.pointWidth
// ...
);
highchart 柱状图,列宽自适应(x轴是时间的特殊情况)
1、柱子列宽自适属性:
pointWidth:25, //柱子宽度,如果设定该值,则下面2个属性无效
pointPadding: 0.4,//每列之间的距离值,默认此值为0.1
groupPadding: 0,//每个值之间的间距,其实和poingPadding有一样的效果。不过这个主要是用于对付存在分组的情况
2、x轴属性设置里面,需要把间隔固定死,否则会出现柱子重叠情况
//表示时间间隔,4小时(如果不固定死,则数据源的量变多时,柱子会出现重叠情况)
tickInterval: 4 * 3600 * 1000,
3、样例代码如下:
var chart = null;
// 获取 CSV 数据并初始化图表
$.getJSON(‘https://data.jianshukeji.com/jsonp?filename=json/usdeur.json&callback=?‘, function (csv) {
    chart = Highcharts.chart(‘container‘, {
        chart: {
            type: ‘column‘,//柱状图column,曲线用line
            zoomType: ‘x‘,//用户鼠标放缩操作
            spacingLeft: 0,//左侧距离
            spacingRight: 0//右侧距离
        },
        title: {
            text: ‘空气质量PM2.5分布‘,
            style: {
                color: ‘#000000‘,
                fontSize: ‘18px‘,
                fontFamily: ‘微软雅黑‘
            },
        },
        subtitle: {
            text: ‘副标题‘
        },
        xAxis: {//x轴的格式
            type: ‘datetime‘,
            //表示时间间隔,4小时(如果不固定死,则数据源的量变多时,柱子会出现重叠情况)
            tickInterval:  4 * 3600 * 1000,
            labels: { style: { fontSize: ‘14px‘, color: ‘#000000‘, } },
            dateTimeLabelFormats: {
                millisecond: ‘%H:%M:%S.%L‘,
                second: ‘%H:%M:%S‘,
                minute: ‘%H:%M‘,
                hour: ‘%H时‘,
                day: ‘%m月%d日‘,
                week: ‘%m-%d‘,
                month: ‘%Y-%m‘,
                year: ‘%Y‘
            }
        },
        yAxis: [{
            title: {//y轴的标题
                text: ‘PM2.5浓度‘,
                style: {
                    color: ‘#000000‘,
                    fontSize: ‘14px‘,
                },
            },
            labels: {//y轴坐标和单位
                format: ‘{value} ug/m3‘,
                style: {
                    color: ‘#000000‘,
                    fontSize: ‘14px‘,
                }
            },
            min: 0
        }],
        legend: {//图例
            align: ‘center‘,
            verticalAlign: ‘bottom‘,
            y: 20,
            floating: true,
            borderWidth: 1
        },
        tooltip: {//鼠标提示框
            shared: true,
            crosshairs: true,
            useHTML: true,
            // 时间格式化字符
            // 默认会根据当前的数据点间隔取对应的值
            // 当前图表中数据点间隔为 1小时,所以配置hour值即可
            dateTimeLabelFormats: {
                day: ‘%Y-%m-%d %H时‘
            }
        },
        credits: {
            enabled: false
        },
        plotOptions: {
            series: {
                marker: {
                    enabled: true,
                    radius: 3
                },
                // 关闭鼠标跟踪,对应的提示框、点击事件会失效
                enableMouseTracking: true,
                turboThreshold: 0
            },
            column: {
                dataLabels: {
                    enabled: true,
                    style: {
                        color: ‘#555‘,
                        fontSize: ‘12px‘,
                        fontFamily: ‘宋体‘,
                        textShadow: false,
                        textOutline: "none"
                    }
                },
                //pointWidth:25, //柱子宽度,如果设定该值,则下面2个属性无效
                pointPadding: 0.4,//每列之间的距离值,默认此值为0.1
                groupPadding: 0,//每个值之间的间距,其实和poingPadding有一样的效果。不过这个主要是用于对付存在分组的情况
                borderWidth: 1,
                shadow: false
            }
        },
        series: [{
            borderRadius: 7,
            color:‘#ff0000‘,
            name: ‘PM2.5‘,
            data: [
                {x:1533430800000,y:39},
                {x:1533427200000,y:50},
                {x:1533423600000,y:50},
                {x:1533420000000,y:45},
                {x:1533416400000,y:45},
                {x:1533412800000,y:45},
                {x:1533409200000,y:45},
                {x:1533405600000,y:45},
                {x:1533402000000,y:46},
                {x:1533398400000,y:51},
                {x:1533394800000,y:45},
                {x:1533391200000,y:46},
                {x:1533387600000,y:38},
                {x:1533384000000,y:42},
                {x:1533380400000,y:47},
                {x:1533376800000,y:46},
                {x:1533373200000,y:81},
                {x:1533369600000,y:41},
                {x:1533366000000,y:41},
                {x:1533362400000,y:45},
                {x:1533358800000,y:47},
                {x:1533355200000,y:51},
                {x:1533351600000,y:46},
                {x:1533348000000,y:51},
                {x:1533344400000,y:50},
            ]
        }]
    });
});
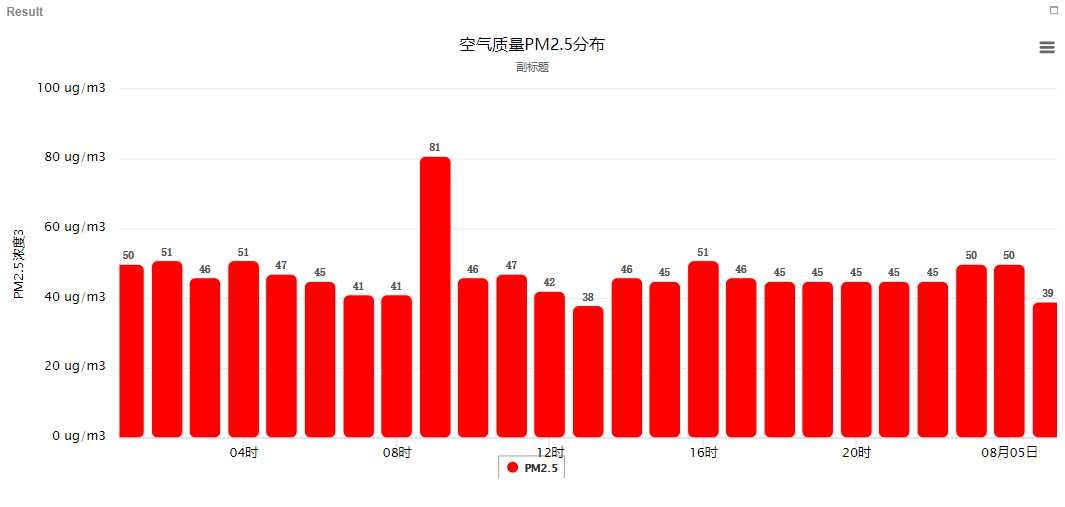
4、效果图如下:

以上是关于highcharts做柱状图,怎样设置柱子宽度的主要内容,如果未能解决你的问题,请参考以下文章