Echart+SpringMVC实战演示
Posted 大龄文艺程序猿
tags:
篇首语:本文由小常识网(cha138.com)小编为大家整理,主要介绍了Echart+SpringMVC实战演示相关的知识,希望对你有一定的参考价值。
一、准备工作:
1、Echart下载:http://echarts.baidu.com/download.html
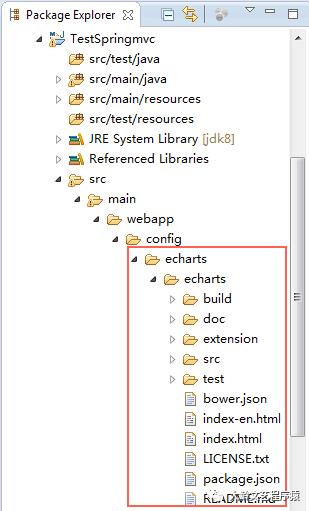
2、新建MAVEN工程:
3、前端代码:
<!DOCTYPE html>
<%@ page language="java" pageEncoding="UTF-8"%>
<html lang="en">
<head>
<meta charset="utf-8">
<meta http-equiv="X-UA-Compatible" content="IE=edge">
<meta name="viewport" content="width=device-width, initial-scale=1.0">
<meta name="description" content="ECharts">
<meta name="author" content="kener.linfeng@gmail.com">
<title>ECharts · 前后台交互Demo</title>
<% request.setAttribute("ctx", request.getContextPath() ) ; %>
<link rel="shortcut icon" href="${ctx}/config/echarts/echarts/doc/asset/ico/favicon.png">
<link href="${ctx}/config/echarts/echarts/doc/asset/css/font-awesome.min.css" rel="stylesheet">
<link href="${ctx}/config/echarts/echarts/doc/asset/css/bootstrap.css" rel="stylesheet">
<link href="${ctx}/config/echarts/echarts/doc/asset/css/carousel.css" rel="stylesheet">
<link href="${ctx}/config/echarts/echarts/doc/asset/css/echartsHome.css" rel="stylesheet">
<!-- HTML5 shim and Respond.js IE8 support of HTML5 elements and media queries -->
<!--[if lt IE 9]>
<script ></script>
<script ></script>
<![endif]-->
<!-- -->
<script ></script>
<script ></script>
<script ></script>
<link href="${ctx}/config/echarts/echarts/doc/asset/css/codemirror.css" rel="stylesheet">
<link href="${ctx}/config/echarts/echarts/doc/asset/css/monokai.css" rel="stylesheet">
</head>
<body>
<div id="main" class="main"></div>//存放图表的div
<!-- ECharts单文件引入 -->
<script ></script>
<script type="text/javascript" language="javascript">
//调用画图方法进行画图
DrawEChart(echarts);
//创建绘制ECharts图表的方法
function DrawEChart(echarts) {
var myChart;
alert('DrawEChart()');
myChart = echarts.init(document.getElementById('main'));
myChart.showLoading({
text : "图表数据正在努力加载..."
});
//定义图表属性options
var options = {
title : {
text : "未来一周气温变化",
subtext : "纯属虚构",
sublink : "http://www.baidu.com"
},
tooltip : {
trigger : 'axis'
},
legend : {
data : [ "最高气温" ]
},
toolbox : {
show : true,
feature : {
mark : {
show : true
},
dataView : {
show : true,
readOnly : false
},
magicType : {
show : true,
type : [ 'line', 'bar' ]
},
restore : {
show : true
},
saveAsImage : {
show : true
}
}
},
calculable : true,
xAxis : [ {
type : 'category',
boundaryGap : false,
data : [ '1', '2', '3', '4', '5', '6', '7' ]
} ],
yAxis : [ {
type : 'value',
axisLabel : {
formatter : '{value} °C'
},
splitArea : {
show : true
}
} ],
grid : {
width : '90%'
},
series : [ {
name : '最高气温',
type : 'line',
data : [ 11, 22, 33, 44, 55, 33, 44 ],//必须是Integer类型的,String计算平均值会出错
markPoint : {
data : [ {
type : 'max',
name : '最大值'
}, {
type : 'min',
name : '最小值'
} ]
},
markLine : {
data : [ {
type : 'average',
name : '平均值'
} ]
}
} ]
};
myChart.setOption(options); //先把可选项注入myChart中
myChart.hideLoading();
alert('ending');
//设置延迟
setTimeout( function getChartData() {
alert('getChartData()' + options);
//获得图表的options对象
//var options = myChart.getOption();
//alert(options),
//通过Ajax获取数据
$.ajax({
url : '${ctx}/test/echarts',//springmvc的controller的请求路径
type : 'post',
contentType: "json",
data : {},
//data: {"name":"zhou","age":"23"},
async : true, //同步执行
dataType : 'json', //返回数据形式为json
success : function(result) {
if (result) {
alert('requestSuccess');
//请求成功将数据设置到相应的位置上
options.legend.data = result.legend;
options.xAxis[0].data = result.category;
options.series[0].data = result.series[0].data;
myChart.hideLoading();
myChart.setOption(options);
}
},
error : function(xmlHttpRequest,errorMsg,exceptionObject) {
alert("requestError");
alert('xmlHttpRequest>>>>>' + xmlHttpRequest + ' errorMsg>>>>>' + errorMsg + ' exceptionObject>>>>>' + exceptionObject);
myChart.hideLoading();
}
});
} ,100);
getChartData(myChart);//aja后台交互
};
</script>
<!-- Le javascript
================================================== -->
<!-- Placed at the end of the document so the pages load faster -->
<script ></script>
<script type="text/javascript" ></script>
<script ></script>
<script ></script>
</body>
</html>
4、配置文件:
1)web.xml
<?xml version="1.0" encoding="UTF-8"?>
<web-app xmlns:xsi="http://www.w3.org/2001/XMLSchema-instance"
xmlns="http://java.sun.com/xml/ns/javaee" xmlns:web="http://java.sun.com/xml/ns/javaee/web-app_2_5.xsd"
xsi:schemaLocation="http://java.sun.com/xml/ns/javaee http://java.sun.com/xml/ns/javaee/web-app_3_0.xsd"
id="WebApp_ID" version="3.0">
<display-name>SpringMVCTest</display-name>
<!-- 配置 Spring MVC DispatchcerServlet 前端控制器 -->
<servlet>
<servlet-name>springmvc</servlet-name>
<servlet-class>org.springframework.web.servlet.DispatcherServlet</servlet-class>
<init-param>
<!-- contextConfigLocation 是参数名称,该参数的值包含 Spring MVC 的配置文件路径 -->
<param-name>contextConfigLocation</param-name>
<param-value>/WEB-INF/classes/springmvc-config.xml</param-value>
</init-param>
<!-- 在 Web 应用启动时立即加载 Servlet -->
<load-on-startup>1</load-on-startup>
</servlet>
<!-- Servlet 映射声明 -->
<servlet-mapping>
<servlet-name>springmvc</servlet-name>
<!-- 监听当前域的所有请求 -->
<url-pattern>/</url-pattern>
</servlet-mapping>
<!-- 添加 register.jsp 为首页 -->
<welcome-file-list>
<welcome-file>index.jsp</welcome-file>
</welcome-file-list>
</web-app>
2)springMVC配置文件
<?xml version="1.0" encoding="UTF-8"?>
<beans xmlns="http://www.springframework.org/schema/beans"
xmlns:xsi="http://www.w3.org/2001/XMLSchema-instance" xmlns:context="http://www.springframework.org/schema/context"
xmlns:mvc="http://www.springframework.org/schema/mvc"
xsi:schemaLocation="http://www.springframework.org/schema/beans http://www.springframework.org/schema/beans/spring-beans-4.2.xsd
http://www.springframework.org/schema/context http://www.springframework.org/schema/context/spring-context-4.2.xsd
http://www.springframework.org/schema/mvc http://www.springframework.org/schema/mvc/spring-mvc-4.2.xsd">
<mvc:annotation-driven/>
<context:component-scan base-package="com.test.springmvc.controller" />
<mvc:resources mapping="/config/**" location="/config/" />
<!-- 配置自动扫描的包,完成 Bean 的创建和自动依赖注入的功能 -->
<context:annotation-config />
<!-- 配置视图解析器 -->
<bean class="org.springframework.web.servlet.view.InternalResourceViewResolver">
<property name="prefix" value="/"></property>
<property name="suffix" value=".jsp"></property>
</bean>
</beans>
5、Controller代码:
package com.test.springmvc.controller;
import java.util.ArrayList;
import java.util.Arrays;
import java.util.List;
import javax.servlet.http.HttpServletRequest;
import javax.servlet.http.HttpServletResponse;
import org.springframework.stereotype.Controller;
import org.springframework.web.bind.annotation.RequestBody;
import org.springframework.web.bind.annotation.RequestMapping;
import org.springframework.web.bind.annotation.RequestMethod;
import org.springframework.web.bind.annotation.ResponseBody;
import com.alibaba.fastjson.JSON;
import com.alibaba.fastjson.JSONObject;
import com.test.springmvc.entity.EchartData;
import com.test.springmvc.entity.Series;
@Controller
@RequestMapping(value = "/test")
public class EchartController {
@RequestMapping(value = "/echarts")
public @ResponseBody String echarts() {
System.out.println("进入echartsHandler方法体>>>>>>>>>>>>>>>>>>>>>>>>>");
// String machineIP = RequestJsonUtils.getMachineIP(requestJson);
// String appTag = RequestJsonUtils.getAppTag(requestJson);
List<String> legend = new ArrayList<String>(Arrays.asList(new String[]{"最高气温"}));//数据分组
List<String> category = new ArrayList<String>(Arrays.asList(new String []{"周一","周二","周三","周四","周五","周六","周日"}));//横坐标
List<Series> series = new ArrayList<Series>();//纵坐标
series.add(new Series("最高气温", "line",new ArrayList<Integer>(Arrays.asList(21,23,28,26,21,33,44))));
EchartData data=new EchartData(legend, category, series);
System.out.println("echartsHandler返回的字符串>>>>>>>>>>>>>>>" + JSON.toJSONString(data));
return JSON.toJSONString(data);
}
}
以上是关于Echart+SpringMVC实战演示的主要内容,如果未能解决你的问题,请参考以下文章