可视化篇:Echarts个人轨迹可视化实现
Posted 杨铖
tags:
篇首语:本文由小常识网(cha138.com)小编为大家整理,主要介绍了可视化篇:Echarts个人轨迹可视化实现相关的知识,希望对你有一定的参考价值。
写在最前
下面是《可视化篇:效果图》中第8、9张的实现说明
其中:
1. 个人轨迹的可视化是echart通过调用百度地图API后实现,关于Echarts如何调用百度地图API,请参考上一篇文章《Echarts引入百度地图》
2. 下图展示的个人轨迹均为虚拟数据
3. 本文只做单用户轨迹展示说明,并未深入探讨批量用户轨迹的可视化及优化
4.使用工具为:Echarts
1.Echart版本说明及模块化文件引入
- 目前百度搜索能看到的有echart2和echart3,由于echart3已不提供百度地图实例化的样本(若强行用echart3,需自行写好相关js脚本),所以下文是基于echart2,下载地址为:http://echarts.baidu.com/build/echarts-2.2.7.zip
- 模块化文件的引入主要有main.js,map.js,还有echart.js
require.config(
        paths:
            echarts: "echarts",
        ,
    );

    require(
    [
        "echarts",
        "echarts/chart/main",
        "echarts/chart/map",
    ],
其中:
main.js文件对应在下载的echart2压缩包目录echarts-2.2.7\\extension\\BMap\\src下,该文件是杨骥(echart团队)写的百度地图在echart上的扩展文件
map.js文件对应目录为:build\\dist\\chart,再声明一次,引入百度地图时,dist目录需全部复制到开发文件相应目录下
echarts.js同样存在于dist文件
此处详细参见《Echarts引入百度地图》一文。
2.个人轨迹展示的思考及实现
2.1 对于个人轨迹的可视化,最初的设想是:
在百度地图上,搭配时间轴timeline,随着时间的变化用户轨迹的演变,后来在用echart写时发现timeline属性始终对应不到options列表,无法渲染options下用户的轨迹参数列表,再后来与R REmap包作者交谈中进一步确认,echart中timeline目前还无办法在百度地图上渲染,这里应该知会一下echart团队的,下面就不对timeline使用做过多说明了。
除上述不同时间不同地点外,为更好展示轨迹线下的意义,还需要做进一步工作,即不同时间不同地点不同事件,如此对于个人轨迹才有比较契合展示。
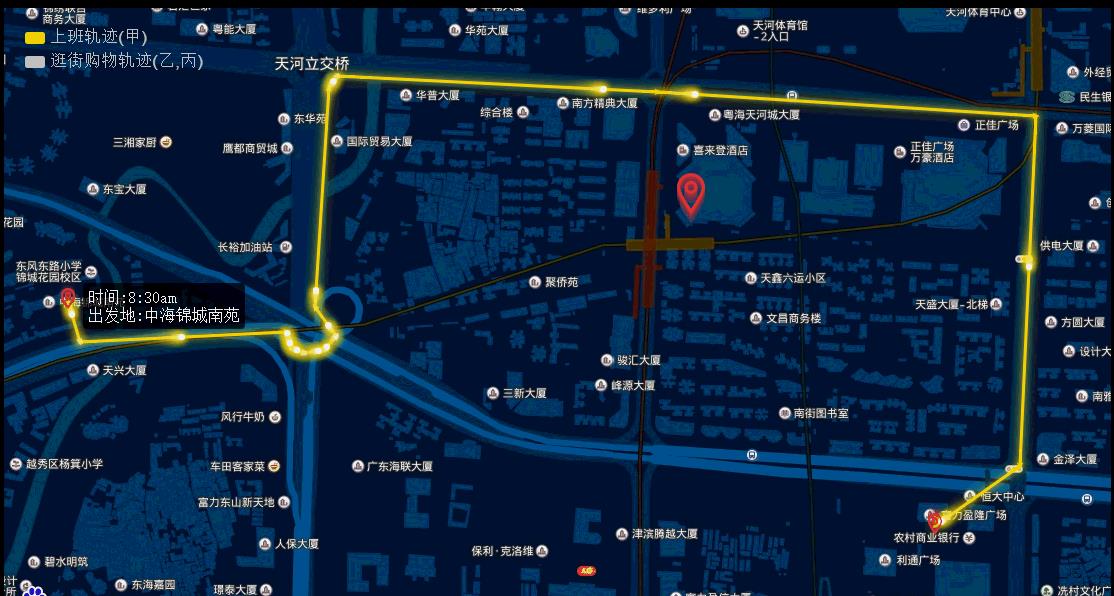
最终效果如下:
上班场景:
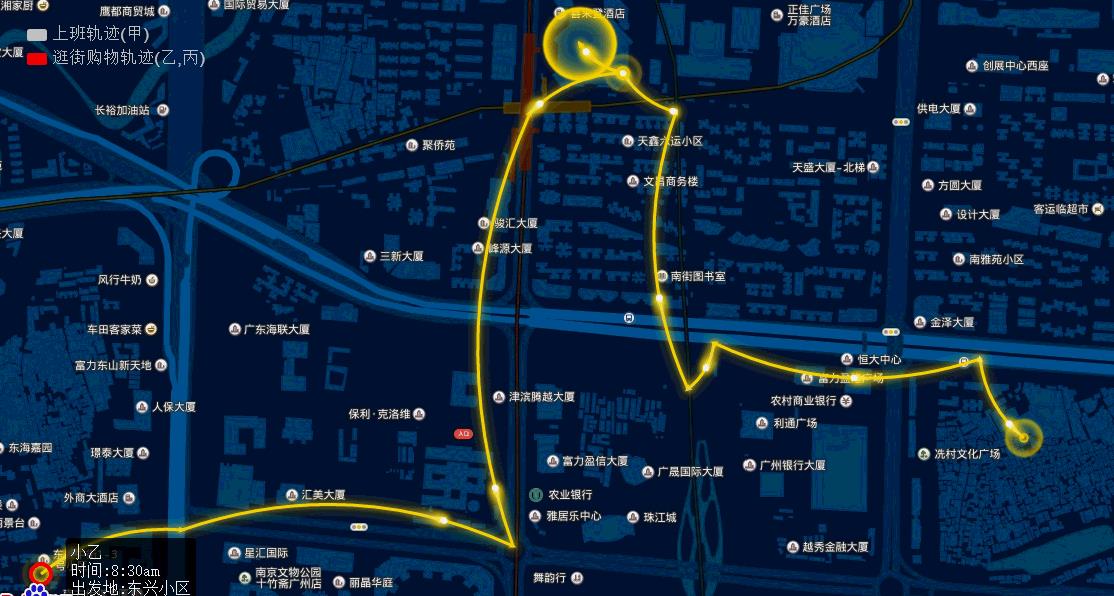
同行逛街:
2.2 个人轨迹的echart实现
2.2.1 为实例化百度地图背景构建一个容器
<head>
        <meta charset="utf-8">
        <style type="text/css">
            body
                margin: 0;

            #main
                height: 100%;

        </style>
    </head>
    <body>
        <div id="main"></div>
Margin设为0则与浏览器无边界融合,div属性容器id,后面js脚本里需要用到该属性,并将echart填充到该容器里,当然,div可以有多个,故可以填充多个echart实例。
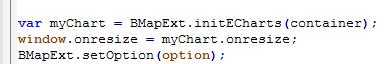
实例化后再js脚本里调用echart api即可:
        var BMapExt = new BMapExtension($('#main')[0], BMap, echarts,
            enableMapClick: false
        );
        var map = BMapExt.getMap();
        var container = BMapExt.getEchartsContainer();

        var startPoint =
            x: 113.328755, //天河城
            y: 23.135588
        ;

        var point = new BMap.Point(startPoint.x, startPoint.y);
        map.centerAndZoom(point, 17);
        map.enableScrollWheelZoom(true);
上图中的方法都封装在main.js中,使用的时候按上图调用即可,其中css样式对应之前的容器大小,BMapExt为初始化的地图对象,具体可看main.js源码,中间getMap,getEchartsContainer为获取地图实例及echart实例对象,BMap.Point是定义当前打开地图的中心点,最下面两个函数则定义了地图的缩放等级及是否可以滚动缩放。
2.2.2 修改百度地图背景
此处可根据需求自行修改,可以通过修改map.setMapStyle函数里百度地图的styleJson达到目的,具体如下:
有两种方法可以定义自己的styleJson:
1.通过http://developer.baidu.com/map/custom/list.htm
该地址为百度对外开放的地图自定义地址,全过程鼠标即可完成自己的模板,最后导出json文件在自己的开发文档中引用即可。
2.修改下面代码
styleJson: [

                    'featureType': 'land',
                    'elementType': 'geometry',
                    'stylers':
                              'color': '#081734'

          ,

                    'featureType': 'building',
                    'elementType': 'geometry',
                    'stylers':
                              'color': '#04406F'

          ,

                    'featureType': 'building',
                    'elementType': 'labels',
                    'stylers':
                    'visibility': 'off'

          ,

                    'featureType': 'highway',
                    'elementType': 'geometry',
                    'stylers':
                    'color': '#015B99'

          ,

                    'featureType': 'highway',
                    'elementType': 'labels',
                    'stylers':
                    'visibility': 'off'

          ,

                    'featureType': 'arterial',
                    'elementType': 'geometry',
                    'stylers':
                    'color':'#003051'

          ,

                    'featureType': 'arterial',
                    'elementType': 'labels',
                    'stylers':
                    'visibility': 'off'

          ,

                    'featureType': 'green',
                    'elementType': 'geometry',
                    'stylers':
                    'visibility': 'off'

          ,

                    'featureType': 'water',
                    'elementType': 'geometry',
                    'stylers':
                              'color': '#044161'

          ,

                    'featureType': 'subway',
                    'elementType': 'geometry.stroke',
                    'stylers':
                    'color': '#003051'

          ,

                    'featureType': 'subway',
                    'elementType': 'labels',
                    'stylers':
                    'visibility': 'off'

          ,

                    'featureType': 'railway',
                    'elementType': 'geometry',
                    'stylers':
                    'visibility': 'off'

          ,

                    'featureType': 'railway',
                    'elementType': 'labels',
                    'stylers':
                    'visibility': 'off'

          ,

                    'featureType': 'all',
                    'elementType': 'labels.text.stroke',
                    'stylers':
                              'color': '#313131'

          ,

                    'featureType': 'all',
                    'elementType': 'labels.text.fill',
                    'stylers':
                              'color': '#FFFFFF'

          ,

                    'featureType': 'manmade',
                    'elementType': 'geometry',
                    'stylers':
                    'visibility': 'off'

          ,

                    'featureType': 'manmade',
                    'elementType': 'labels',
                    'stylers':
                    'visibility': 'off'

          ,

                    'featureType': 'local',
                    'elementType': 'geometry',
                    'stylers':
                    'visibility': 'off'

          ,

                    'featureType': 'local',
                    'elementType': 'labels',
                    'stylers':
                    'visibility': 'off'

          ,

                    'featureType': 'subway',
                    'elementType': 'geometry',
                    'stylers':
                              'lightness': -65

          ,

                    'featureType': 'railway',
                    'elementType': 'all',
                    'stylers':
                              'lightness': -40

          ,

                    'featureType': 'boundary',
                    'elementType': 'geometry',
                    'stylers':
                              'color': '#8b8787',
                              'weight': '1',
                              'lightness': -29


    ]
下面为修改前后对比:
修改前
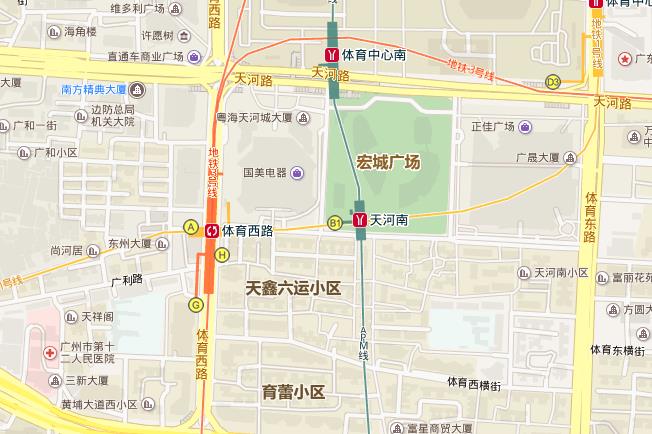
修改后
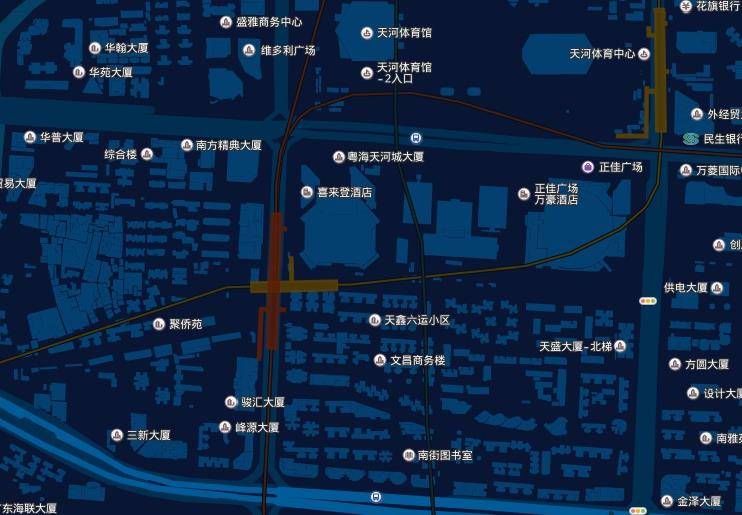
2.2.3 Echart介入
1. option对象
Echart中所有的属性参数都是存放于option对象中具体,最后通过setOption方法即可将自己定义的option实例化,部分如下:
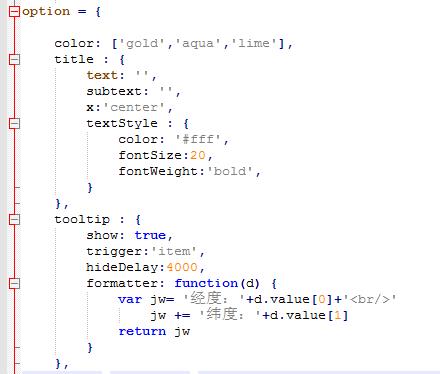
具体参数设置参考echart2配置文 档:http://echarts.baidu.com/echarts2/doc/doc.html
2. timeline属性
Timeline属性为option对象最外层,且timeline属性下的data参数定义的数组,对应着option对象里options属性下的每一个参数列,由于echart暂不支持百度地图上timeline,故不再细说。
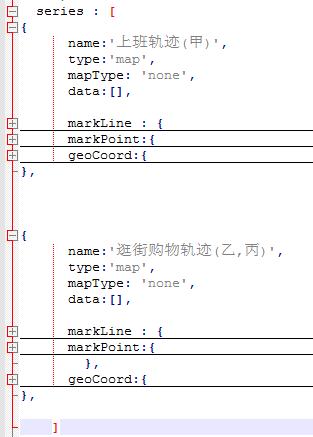
3. legend属性
Legend属性定义series下不同数组,其仍为opion下options中同个数组。具体表现为不同标签控制不同的图形映射,如下图:

上图对应的legend参数如下:
    color:['gold','red'],
    legend:
        data:['上班轨迹(甲)','逛街购物轨迹(乙,丙)'],
        x:'left',
        orient:'vertical',
        padding:[30,15,15,30],
        textStyle:
            fontSize:17,
            color:'rgb(204,204,204)',
        ,
        selected:
            '上班轨迹(甲)':true,
            '逛街购物轨迹(乙,丙)':false,
        ,
        selectedMode:'single',
    ,
其中data数组中定义的两个对象分别对应series下两个数组:
4. geoCoord属性
该属性对应实例化的点的经纬度,自定义的中文名似乎总是出错,单有批量的点时,建议换成英文+数字的名字,此外geoCoord同时控制着下文的markLine和markPoint,且geoCoord与markLine,markPoint属性平级。
      geoCoord:
                 'p1':[113.317568,23.135959],
                 'p2':[113.317783,23.135278],
                 'p3':[113.321489,23.135432],
                 'p4':[113.321525,23.135282],
                 'p5':[113.321592,23.13517],
                 'p6':[113.321799,23.135083],
                 'p7':[113.322158,23.135141],
                 'p8':[113.322374,23.135378],
                 'p9':[113.321992,23.135847],
                 'p10':[113.322243,23.13949],
                 'p11':[113.322396,23.1397],
                 'p12':[113.328163,23.13943],
                 'p13':[113.334945,23.139033],
                 'p14':[113.334658,23.133217],
                 'p15':[113.33313,23.13222],
                 'p16':[113.328755, 23.137588]
    ,
5. markLine,markPoint属性
此处markLine参数为实现轨迹的关键,其中data参数控制轨迹的迁徙方向,第一个name表示起点,第二个表示终点,此外还可以添加color,value等其他属性,来控制线的颜色及点的大小。
markPoint参数为实现相关点的效果,其中data参数控制对应的点,其他参数与markLine大同小异。
     markLine :
      Symbol:['none', 'arrow'],
      symbolSize:['0', '0.1'],
      smooth:true,
      smooth:0,
      effect :
          show: true,
          scaleSize: 1,
          period: 30,
          color: '#fff',
          shadowBlur: 10
      ,
      itemStyle :
          color: 'red',
          normal:
              color:function(param)
              return(param.data[0].value.colorValue);
              ,
              borderWidth:3,
              lineStyle:
                  type: 'solid',
                  width: 3,
                  shadowBlur: 10
              ,
              label:show:false,value:'天河城'

      ,

    data : [
                [name:'p1', name:'p2',value:colorValue:'gold'],
                [name:'p2', name:'p3',value:colorValue:'gold'],
                [name:'p3', name:'p4',value:colorValue:'gold'],
                [name:'p4', name:'p5',value:colorValue:'gold'],
                [name:'p5', name:'p6',value:colorValue:'gold'],
                [name:'p6', name:'p7',value:colorValue:'gold'],
                [name:'p7', name:'p8',value:colorValue:'gold'],
                [name:'p8', name:'p9',value:colorValue:'gold'],
                [name:'p9', name:'p10',value:colorValue:'gold'],
                [name:'p10', name:'p11',value:colorValue:'gold'],
                [name:'p11', name:'p12',value:colorValue:'gold'],
                [name:'p12', name:'p13',value:colorValue:'gold'],
                [name:'p13', name:'p14',value:colorValue:'gold'],
                [name:'p14', name:'p15',value:colorValue:'gold']
        ]
        ,
上面为markLine明细,下面为markPoint明细:
      markPoint:
            symbol:'image://./image/location.svg',
            symbolSize:function(v)
                return v/5
            ,
            effect:
                show:true,
                type:'bounce',
                period:3,
            ,
            itemStyle:
                normal:
                    label:
                        show:false,
                    ,
                ,
                emphasis:
                    label:
                        show:false,
                    ,
                ,
            ,
            data:[
               name:'p1',value:50,
                   tooltip:
                       formatter:'时间:8:30am<br/>出发地:中海锦城南苑'
                   ,
               ,
               name:'p16',value:100,
                   tooltip:
                       formatter:'天河城<br/>经度:113.328755<br/>纬度:23.137588'
                   ,
               ,
               name:'p15',value:50,
                   tooltip:
                       formatter:'时间:10:00am<br/>目的地:富力盈隆广场'
                   ,
               ,
            ],
        ,
其中symbol处为另外下载的图片,可自定义点的图标。
6. tooltip属性
该属性控制悬浮提示框,即对应上文不同时间不同地点不同事中的不同事的体现,tooltip可以放置于markPoint的data数组中:
            data:[
               name:'p1',value:50,
                   tooltip:
                       formatter:'时间:8:30am<br/>出发地:中海锦城南苑'
                   ,
               ,
               name:'p16',value:100,
                   tooltip:
                       formatter:'天河城<br/>经度:113.328755<br/>纬度:23.137588'
                   ,
               ,
               name:'p15',value:50,
                   tooltip:
                       formatter:'时间:10:00am<br/>目的地:富力盈隆广场'
                   ,
               ,
            ],
也可以放置于option对象的最外层,与markLine,markPoint 平级:
    tooltip :
        show: true,
        trigger:'item',
        hideDelay:4000,
        formatter: function(d)
            var jw= '经度:'+d.value[0]+'<br/>'
                jw += '纬度:'+d.value[1]
            return jw

    ,
该方法控制的是批量的提示框,如果想做到相对自由的自定义,建议用第一种tooltip方法。
7. 其他属性
具体参见文末代码.
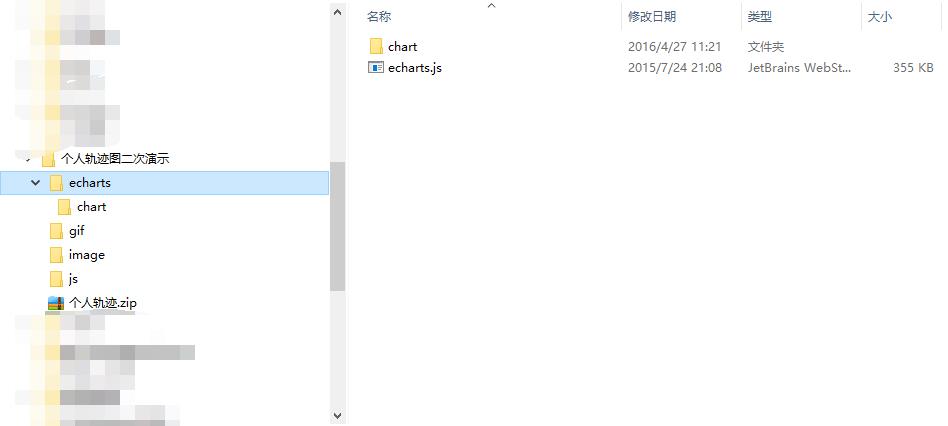
2.3 开发文档结构
总的目录:
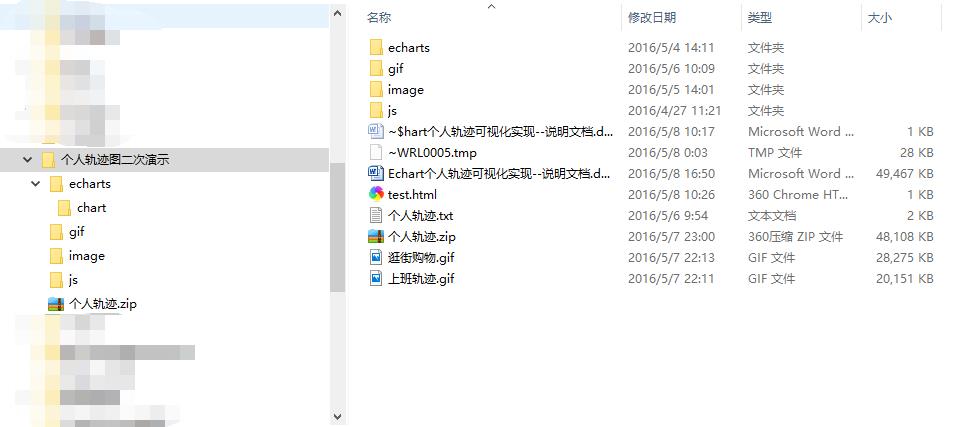
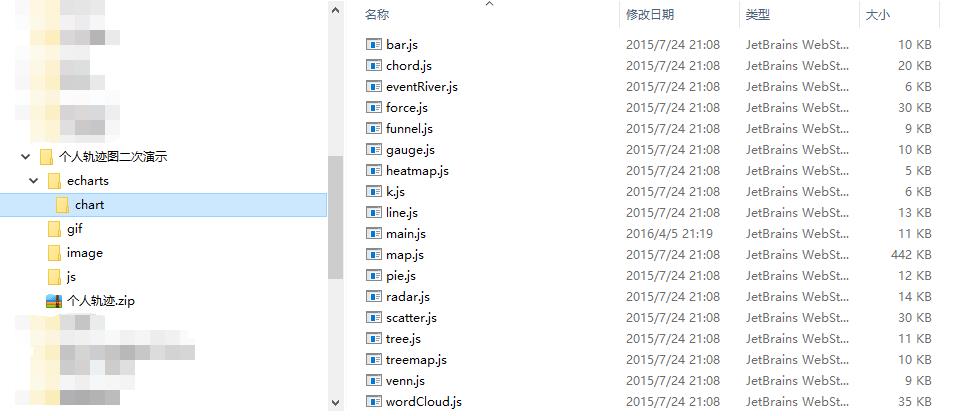
Echars目录:
Echarts/chart目录:
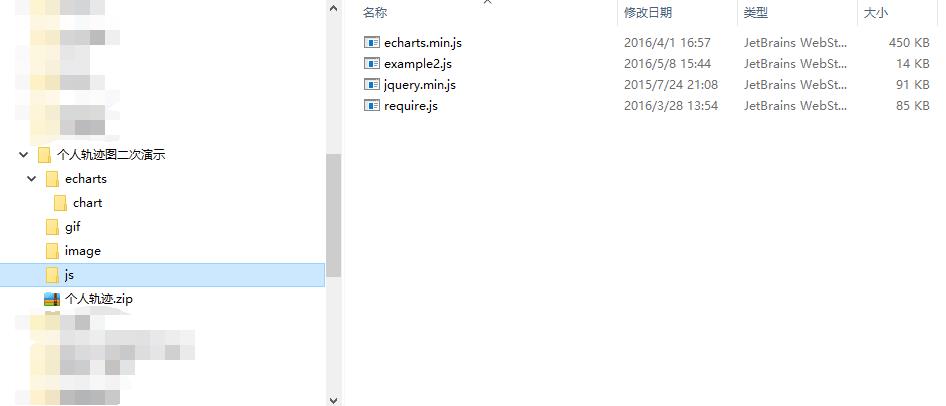
Js目录:
2.4 实现全代码:
首页:
<html>
    <head>
        <meta charset="utf-8">
        <style type="text/css">
            body
                margin: 0;

            #main
                height: 100%;

        </style>
    </head>
    <body>
        <div id="main"></div>

        <script src="./echarts/echarts.js"></script>
        <script type="text/javascript" src="http://api.map.baidu.com/api?v=2.0&ak=53oVIOgmSIejwV7EfphpgTynOZbIiVYu"></script>
        <script src="./js/jquery.min.js"></script>
        <script src="./js/require.js"></script>
        <script src="./js/example2.js"></script>
    </body>
</html>
echarts样式+百度背景代码:
(function ()
    require.config(
        paths:  echarts: "echarts", ,
    );

    require(
    [
        "echarts",
        "echarts/chart/main",
        "echarts/chart/map",
    ],
    function (echarts, BMapExtension)
        $('#main').css( height:$('body').height(), width:$('body').width() );

        // 初始化地图
        var BMapExt = new BMapExtension($('#main')[0], BMap, echarts, enableMapClick: false );
        var map = BMapExt.getMap();
        var container = BMapExt.getEchartsContainer();

        var startPoint =  x: 113.328755, //天河城 y: 23.135588 ;

        var point = new BMap.Point(startPoint.x, startPoint.y);
        map.centerAndZoom(point, 17);
        map.enableScrollWheelZoom(true);
        // 地图自定义样式
        map.setMapStyle( styleJson: [  'featureType': 'land', //调整土地颜色 'elementType': 'geometry', 'stylers':  'color': '#081734'  ,  'featureType': 'building', //调整建筑物颜色 'elementType': 'geometry', 'stylers':  'color': '#04406F'  ,  'featureType': 'building', //调整建筑物标签是否可视 'elementType': 'labels', 'stylers':  'visibility': 'off'  ,  'featureType': 'highway', //调整高速道路颜色 'elementType': 'geometry', 'stylers':  'color': '#015B99'  ,  'featureType': 'highway', //调整高速名字是否可视 'elementType': 'labels', 'stylers':  'visibility': 'off'  ,  'featureType': 'arterial', //调整一些干道颜色 'elementType': 'geometry', 'stylers':  'color':'#003051'  ,  'featureType': 'arterial', 'elementType': 'labels', 'stylers':  'visibility': 'off'  ,  'featureType': 'green', 'elementType': 'geometry', 'stylers':  'visibility': 'off'  ,  'featureType': 'water', 'elementType': 'geometry', 'stylers':  'color': '#044161'  ,  'featureType': 'subway', //调整地铁颜色 'elementType': 'geometry.stroke', 'stylers':  'color': '#003051'  ,  'featureType': 'subway', 'elementType': 'labels', 'stylers':  'visibility': 'off'  ,  'featureType': 'railway', 'elementType': 'geometry', 'stylers':  'visibility': 'off'  ,  'featureType': 'railway', 'elementType': 'labels', 'stylers':  'visibility': 'off'  ,  'featureType': 'all', //调整所有的标签的边缘颜色 'elementType': 'labels.text.stroke', 'stylers':  'color': '#313131'  ,  'featureType': 'all', //调整所有标签的填充颜色 'elementType': 'labels.text.fill', 'stylers':  'color': '#FFFFFF'  ,  'featureType': 'manmade', 'elementType': 'geometry', 'stylers':  'visibility': 'off'  ,  'featureType': 'manmade', 'elementType': 'labels', 'stylers':  'visibility': 'off'  ,  'featureType': 'local', 'elementType': 'geometry', 'stylers':  'visibility': 'off'  ,  'featureType': 'local', 'elementType': 'labels', 'stylers':  'visibility': 'off'  ,  'featureType': 'subway', 'elementType': 'geometry', 'stylers':  'lightness': -65  ,  'featureType': 'railway', 'elementType': 'all', 'stylers':  'lightness': -40  ,  'featureType': 'boundary', 'elementType': 'geometry', 'stylers':  'color': '#8b8787', 'weight': '1', 'lightness': -29   ] );

option =  color: ['gold','aqua','lime'], title :  text: '', subtext: '', x:'center', textStyle :  color: '#fff', fontSize:20, fontWeight:'bold',  , tooltip :  show: true, trigger:'item', hideDelay:4000, formatter: function(d)  var jw= '经度:'+d.value[0]+'<br/>' jw += '纬度:'+d.value[1] return jw  , color:['gold','red'], legend: data:['上班轨迹(甲)','逛街购物轨迹(乙,丙)'], x:'left', orient:'vertical', padding:[30,15,15,30], textStyle: fontSize:17, color:'rgb(204,204,204)', , selected: '上班轨迹(甲)':true, '逛街购物轨迹(乙,丙)':false, , selectedMode:'single', , /* toolbox:  show : true, orient : 'vertical', x: 'right', y: 'center', feature :  mark : show: true, dataView : show: true, readOnly: false, restore : show: true, saveAsImage : show: true  ,*/ series : [  name:'上班轨迹(甲)', type:'map', mapType: 'none', data:[], markLine :  Symbol:['none', 'arrow'], symbolSize:['0', '0.1'], smooth:true, smooth:0, effect :  show: true, scaleSize: 1, period: 30, color: '#fff', shadowBlur: 10 , itemStyle :  color: 'red', normal:  color:function(param) return(param.data[0].value.colorValue); , borderWidth:3, lineStyle:  type: 'solid', width: 3, shadowBlur: 10 , label:show:false,value:'天河城'  , data : [ [name:'p1', name:'p2',value:colorValue:'gold'], [name:'p2', name:'p3',value:colorValue:'gold'], [name:'p3', name:'p4',value:colorValue:'gold'], [name:'p4', name:'p5',value:colorValue:'gold'], [name:'p5', name:'p6',value:colorValue:'gold'], [name:'p6', name:'p7',value:colorValue:'gold'], [name:'p7', name:'p8',value:colorValue:'gold'], [name:'p8', name:'p9',value:colorValue:'gold'], [name:'p9', name:'p10',value:colorValue:'gold'], [name:'p10', name:'p11',value:colorValue:'gold'], [name:'p11', name:'p12',value:colorValue:'gold'], [name:'p12', name:'p13',value:colorValue:'gold'], [name:'p13', name:'p14',value:colorValue:'gold'], [name:'p14', name:'p15',value:colorValue:'gold'] ] , markPoint: symbol:'image://./image/location.svg', symbolSize:function(v) return v/5 , effect: show:true, type:'bounce', period:3, , itemStyle: normal: label: show:false, , , emphasis: label: show:false, , , , data:[ name:'p1',value:50, tooltip: formatter:'时间:8:30am<br/>出发地:中海锦城南苑' , , name:'p16',value:100, tooltip: formatter:'天河城<br/>经度:113.328755<br/>纬度:23.137588' , , name:'p15',value:50, tooltip: formatter:'时间:10:00am<br/>目的地:富力盈隆广场' , , ], , geoCoord: 'p1':[113.317568,23.135959], 'p2':[113.317783,23.135278], 'p3':[113.321489,23.135432], 'p4':[113.321525,23.135282], 'p5':[113.321592,23.13517], 'p6':[113.321799,23.135083], 'p7':[113.322158,23.135141], 'p8':[113.322374,23.135378], 'p9':[113.321992,23.135847], 'p10':[113.322243,23.13949], 'p11':[113.322396,23.1397], 'p12':[113.328163,23.13943], 'p13':[113.334945,23.139033], 'p14':[113.334658,23.133217], 'p15':[113.33313,23.13222], 'p16':[113.328755, 23.137588]  ,  name:'逛街购物轨迹(乙,丙)', type:'map', mapType: 'none', data:[], markLine :  Symbol:['none', 'arrow'], symbolSize:['0', '0.1'], smooth:true, smooth:20, effect :  show: true, scaleSize: 1, period: 30, color: '#fff', shadowBlur: 10 , itemStyle :  color: 'red', normal:  color:function(param) return(param.data[0].value.colorValue); , borderWidth:3, lineStyle:  type: 'solid', width: 3, shadowBlur: 10 , label:show:false,value:'天河城'  , data : [ [name:'s1', name:'s2',value:colorValue:'gold'], [name:'s2', name:'s3',value:colorValue:'gold'], [name:'s3', name:'s4',value:colorValue:'gold'], [name:'s4', name:'s10',value:colorValue:'gold'], [name:'s10', name:'s11',value:colorValue:'gold'], [name:'s5', name:'s6',value:colorValue:'gold'], [name:'s6', name:'s7',value:colorValue:'gold'], [name:'s7', name:'s8',value:colorValue:'gold'], [name:'s8', name:'s9',value:colorValue:'gold'], [name:'s9', name:'s10',value:colorValue:'gold'], [name:'s10', name:'s11',value:colorValue:'gold'], ] , markPoint: symbol以上是关于可视化篇:Echarts个人轨迹可视化实现的主要内容,如果未能解决你的问题,请参考以下文章