Aspose.Words生成饼图,柱状图,NET Core环境
Posted 棉晗榜
tags:
篇首语:本文由小常识网(cha138.com)小编为大家整理,主要介绍了Aspose.Words生成饼图,柱状图,NET Core环境相关的知识,希望对你有一定的参考价值。

开发环境
- C#
- .NET6
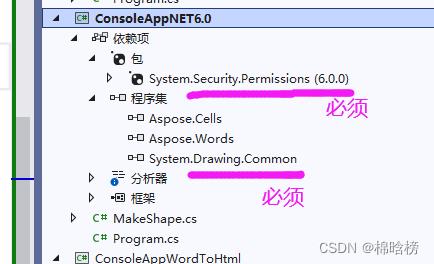
需要引用的组件
- System.Drawing.Common
- System.Security.Permissions
- Aspose.Words 22.5
参考代码:
Program.cs
// See https://aka.ms/new-console-template for more information
using Aspose.Words;
using ConsoleAppNET6._0;
using System;
using System.Data;

Console.WriteLine("Hello, World!");

//注册编码提供程序
System.Text.Encoding.RegisterProvider(System.Text.CodePagesEncodingProvider.Instance);

string file = Path.Combine(AppDomain.CurrentDomain.BaseDirectory, "1223.docx");

//测试生成饼图
Aspose.Words.Document doc = new Aspose.Words.Document();
DocumentBuilder builder = new DocumentBuilder(doc);

//builder.Writeln("普通饼图:");
MakeShape.AddPieChart(builder, "饼图测试1");

builder.Writeln();
//builder.Writeln("3D饼图:");
//AddPie3dChart(builder);
//柱状图
MakeShape.ColumnChart(builder);

//string file = Path.Combine(AppDomain.CurrentDomain.BaseDirectory, "1223.docx");
doc.Save(file, SaveFormat.Docx);

Console.WriteLine("图表生成成功");
MakeShape.cs
 using System;
using System.Collections.Generic;
using System.Linq;
using Aspose.Words;
using Aspose.Words.Drawing.Charts;
using System.Drawing;
using System.Drawing.Drawing2D;

namespace ConsoleAppNET6._0

    public class MakeShape


        /// <summary>
        /// 饼图
        /// </summary>
        /// <param name="builder"></param>
        /// <param name="title"></param>
        public static void AddPieChart(DocumentBuilder builder, string title)

            var shape = builder.InsertChart(Aspose.Words.Drawing.Charts.ChartType.Pie, 400, 330);

            //shape.FillColor = Color.Green;//控制的是饼图外的颜色

            Aspose.Words.Drawing.Charts.Chart chart = shape.Chart;

            Aspose.Words.Drawing.Charts.ChartSeriesCollection seriesCollection = chart.Series;
            seriesCollection.Clear();//清除默认
            类别
            //var categories = new string[]
            //
            //    "五金", "塑料", "橡胶", "陶瓷"
            //;
            值
            //var values = new double[]
            //
            //    20, 20, 30, 40
            //;

            var categories = new string[]

                "连通率", "未连通率"
            ;
            var values = new double[]

                91.5, 8.5
            ;

            chart.Legend.Position = Aspose.Words.Drawing.Charts.LegendPosition.Right;//显示在右边
            //添加数据
            var chatSeries = seriesCollection.Add(title, categories, values);

            int index = 1;
            foreach (var item in chatSeries.DataPoints)

                //item.Bubble3D = true;//无效
                // item.Format.Fill.BackColor = Color.Green;//无效
                //18.7 版本不支持设置颜色
                // 22版本支持修改颜色
                item.Format.Fill.ForeColor = Color.FromArgb(27, 233, 0); //绿色,连通率,大占比的
                if (index % 2 == 0)

                    // 扇区的颜色,没连通的占比
                    item.Format.Fill.ForeColor = Color.FromArgb(255, 0, 193);
                    //   item.Format.Fill.ForeColor = Color.Yellow;// 扇区的颜色

                //item.Format.Stroke.Color = Color.Red;//饼图分界线颜色
                index++;

            chatSeries.Bubble3D = true;

            //设置数据显示
            SetChartSeriesDataLabel(chatSeries, categories.Count());


        /// <summary>
        /// 设置显示文本样式
        /// </summary>
        /// <param name="chatSeries"></param>
        /// <param name="count"></param>
        public static void SetChartSeriesDataLabel(Aspose.Words.Drawing.Charts.ChartSeries chatSeries, int count)

            Aspose.Words.Drawing.Charts.ChartDataLabelCollection dataLabelCollection = chatSeries.DataLabels;
            for (int i = 0; i < count; i++)

                Aspose.Words.Drawing.Charts.ChartDataLabel chartDataLabel = dataLabelCollection.Add(i);
                chartDataLabel.ShowLegendKey = true;
                chartDataLabel.ShowLeaderLines = true;
                chartDataLabel.ShowCategoryName = true;
                chartDataLabel.ShowPercentage = true;
                chartDataLabel.ShowSeriesName = false;
                chartDataLabel.ShowValue = true;
                chartDataLabel.Separator = "  ";


        public static void SetChartSeriesDataLabel_zhu(Aspose.Words.Drawing.Charts.ChartSeries chatSeries, int count)

            Aspose.Words.Drawing.Charts.ChartDataLabelCollection dataLabelCollection = chatSeries.DataLabels;

            for (int i = 0; i < count; i++)

                Aspose.Words.Drawing.Charts.ChartDataLabel chartDataLabel = dataLabelCollection.Add(i);

                //柱子顶部那个小颜色方框,在数字前面
                //chartDataLabel.ShowLegendKey = true;

                //chartDataLabel.ShowLeaderLines = true;
                //chartDataLabel.ShowCategoryName = true;

                //chartDataLabel.ShowPercentage = true;

                //柱子名称
                //chartDataLabel.ShowSeriesName = true;

                chartDataLabel.ShowValue = true;
                chartDataLabel.Separator = "  ";


        /// <summary>
        /// 生成柱状图
        /// </summary>
        /// <param name="builder"></param>
        public static void ColumnChart(DocumentBuilder builder)

            Aspose.Words.Drawing.Shape shape = builder.InsertChart(Aspose.Words.Drawing.Charts.ChartType.Column, 400, 250);

            // Chart property of Shape contains all chart related options.
            Aspose.Words.Drawing.Charts.Chart chart = shape.Chart;

            //builder.ParagraphFormat.LineSpacing = 200.0d;// 设置行间距

            // Get chart series collection.
            Aspose.Words.Drawing.Charts.ChartSeriesCollection seriesColl = chart.Series;
            // Check series count.
            Console.WriteLine(seriesColl.Count);

            // Delete default generated series.
            seriesColl.Clear();

            //两个柱状图
            // Create category names array, in this example we have two categories.
            //string[] categories = new string[]  "AW Category 1", "AW Category 2" ;

             Adding new series. Please note, data arrays must not be empty and arrays must be the same size.
            //seriesColl.Add("AW Series 1", categories, new double[]  1, 2 );
            //seriesColl.Add("AW Series 2", categories, new double[]  3, 4 );
            //seriesColl.Add("AW Series 3", categories, new double[]  5, 6 );
            //seriesColl.Add("AW Series 4", categories, new double[]  7, 8 );
            //seriesColl.Add("AW Series 5", categories, new double[]  9, 10 );

            List<ChartSeries> series = new List<ChartSeries>();

            string[] categories = new string[]  "文章内容审查统计不通过数" ;
            var chatSeries = seriesColl.Add("房地产", categories, new double[]  1 );
            series.Add(chatSeries);

            chatSeries = seriesColl.Add("商业联系", categories, new double[]  3 );
            series.Add(chatSeries);

            chatSeries = seriesColl.Add("广告", categories, new double[]  5 );
            series.Add(chatSeries);

            chatSeries = seriesColl.Add("涉政", categories, new double[]  10 );
            series.Add(chatSeries);

            foreach (var item in series)

                //设置数据显示
                SetChartSeriesDataLabel_zhu(item, 1);
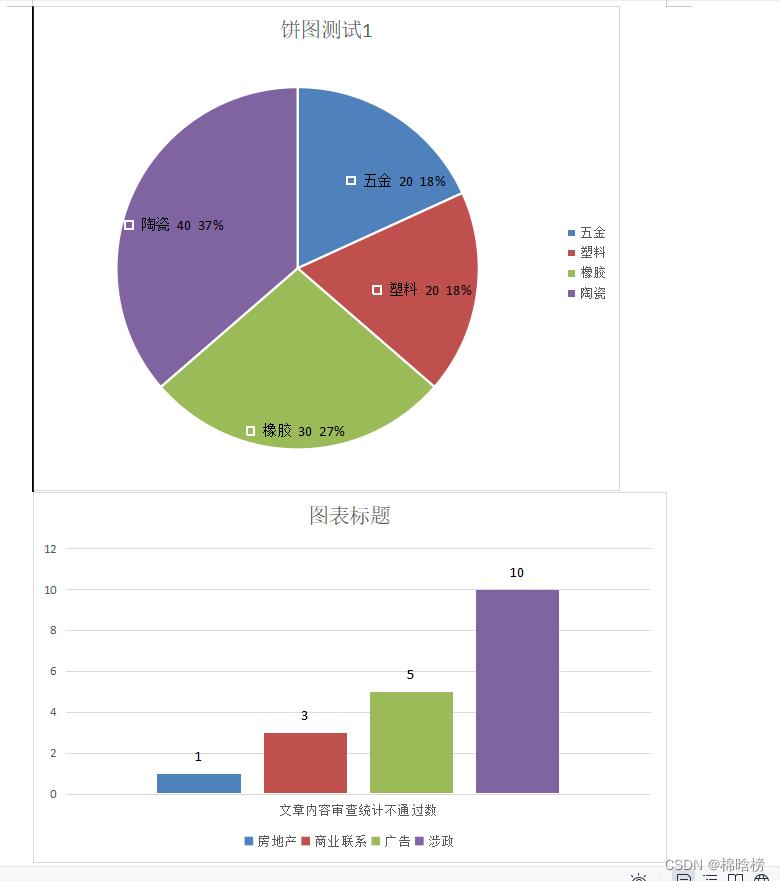
效果图:

以上是关于Aspose.Words生成饼图,柱状图,NET Core环境的主要内容,如果未能解决你的问题,请参考以下文章