性能监控之Telegraf+InfluxDB+Grafana linux服务器实时监控
Posted zuozewei
tags:
篇首语:本文由小常识网(cha138.com)小编为大家整理,主要介绍了性能监控之Telegraf+InfluxDB+Grafana linux服务器实时监控相关的知识,希望对你有一定的参考价值。

文章目录
一、引言
JMeter的PerfMonMetricsCollector插件支持收集服务器的性能指标,但是我们很少使用它,因为它收集起来的性能损耗太大了,另外,我们也需要收集JMeter的测试结果数据,在上文中,我们已经可以使用inflluxDB来存储性能测试结果,因此,我们也可以将服务器的性能数据存储到influxDB,那么通过Grafana我们可以实时得到一个炫酷的可视化看板。
二、目标
收集Linux APP服务器的性能指标:
- List item
- cpu
- disk
- disk.io
- processes
- swap memory usage
- memory usage
- system load and uptime
- network interface usage
- inodes usage
三、解决方案
1、Telegraf
除非我自己修改JMeter源码,否则JMeter不会把收集的性能数据持久化到数据库的,但这样的成本太高,因此,我们选择更简单成本低的Telegraf作为采集服务。
Telegraf 是一个用 Go 编写的代理程序,可收集系统和服务的统计数据,并写入到InfluxDB 数据库。Telegraf 具有内存占用小的特点,通过插件系统可轻松添加支持其他服务的扩展。
TICK家族

官网地址:https://www.influxdata.com/time-series-platform/telegraf/
2、整体设计
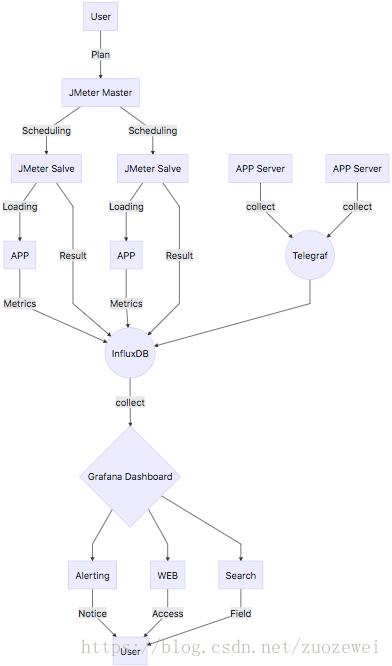
四、Telegraf&InfluxDB集成
1、下载安装
[root@zuozewei ~]# wget https://dl.influxdata.com/telegraf/releases/telegraf-1.7.4-1.x86_64.rpm
[root@zuozewei ~]# yum localinstall telegraf-1.7.4-1.x86_64.rpm
2、创建influxDB用户和数据库
[root@zuozewei ~]# influx
Connected to http://localhost:8086 version 1.6.2
InfluxDB shell version: 1.6.2
> create user "telegraf" with password 'telegraf'
> create database telegraf
> show databases
name: databases
name
----
_internal
jmeter
demo
test
7dgroup
telegraf
> exit
3、配置Telegraf
[root@zuozewei ~]# vim /etc/telegraf/telegraf.conf
# Configuration for sending metrics to InfluxDB
[[outputs.influxdb]]
  ## The full HTTP or UDP URL for your InfluxDB instance.
  urls = ["http://127.0.0.1:8086"]

  ## The target database for metrics; will be created as needed.
  database = "telegraf"

  ## Name of existing retention policy to write to.  Empty string writes to
  ## the default retention policy.  Only takes effect when using HTTP.
   retention_policy = ""

  ## Timeout for HTTP messages.
   timeout = "5s"

  ## HTTP Basic Auth
  username = "telegraf"
  password = "telegraf"
4、启动Telegraf
[root@zuozewei ~]# systemctl start telegraf
5、查看数据
[root@zuozewei ~]# influx
Connected to http://localhost:8086 version 1.6.2
InfluxDB shell version: 1.6.2
> use telegraf
Using database telegraf
> show measurements
> show measurements
name: measurements
name
----
cpu
disk
diskio
kernel
mem
processes
swap
system
性能数据已经成功保存~
五、InfluxDB&Grafana集成
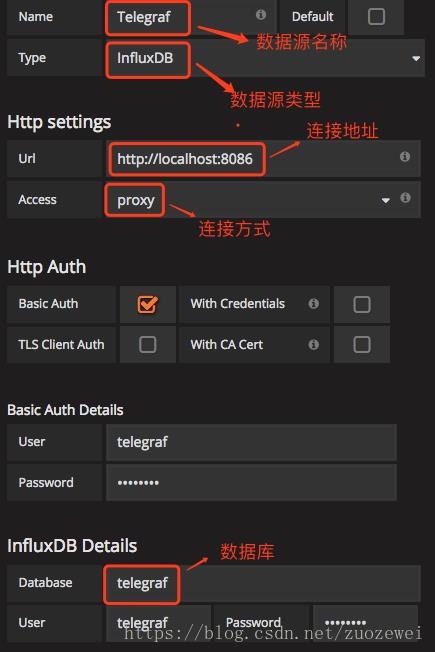
1、Grafana新建数据源
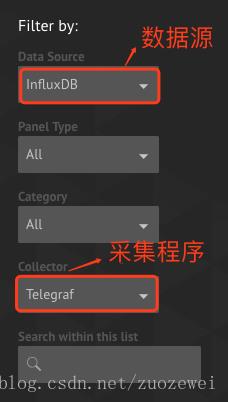
2、下载看板模板
搜索看板模板
官方看板模板库:https://grafana.com/dashboards
选择需要导入的看板模板
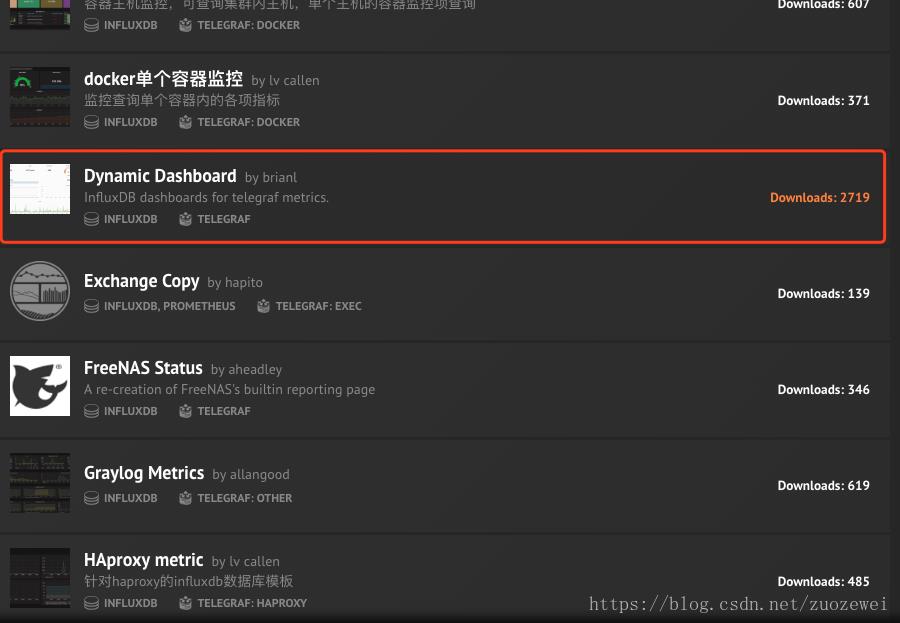
此看板地址:https://grafana.com/dashboards/79
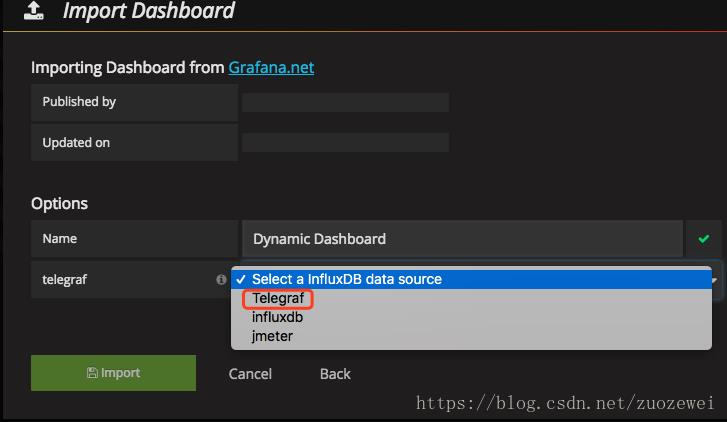
Grafana导入模板
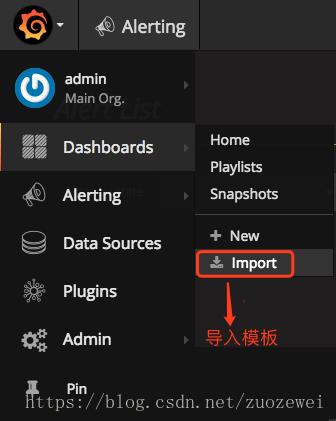
选择Telegraf数据源
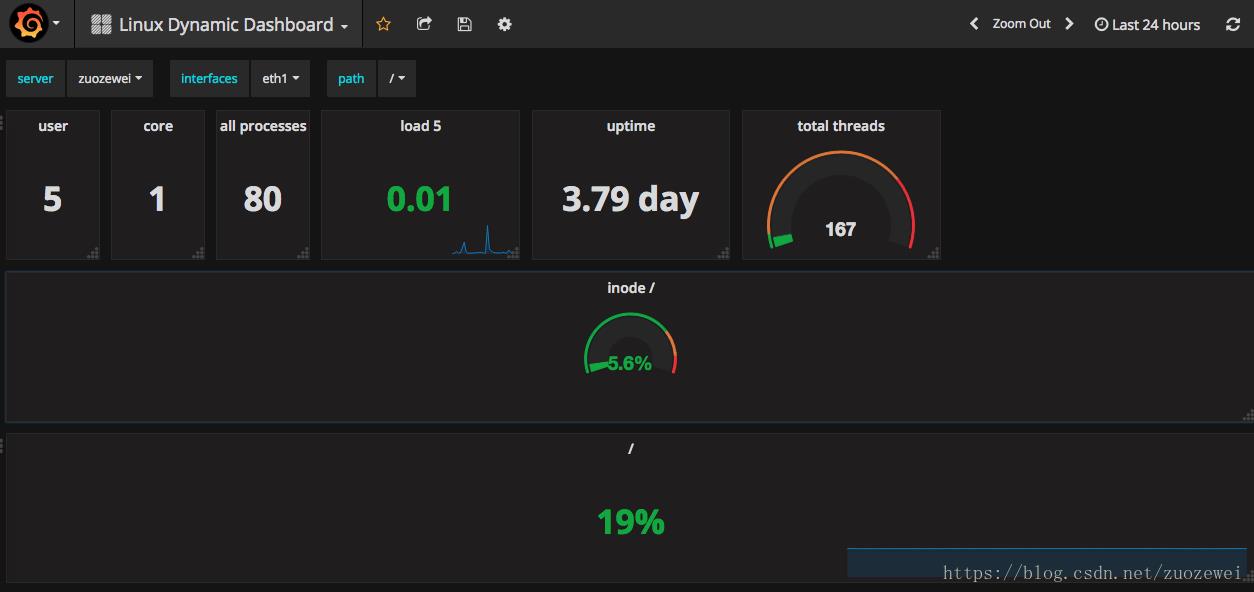
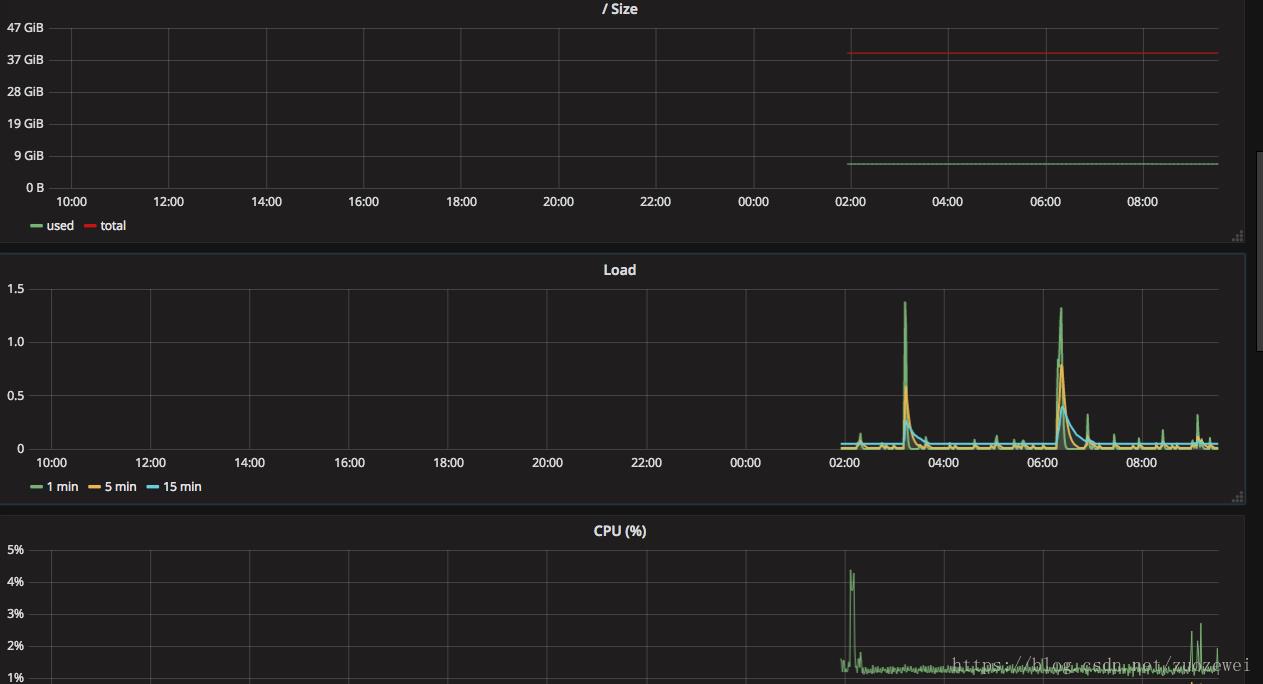
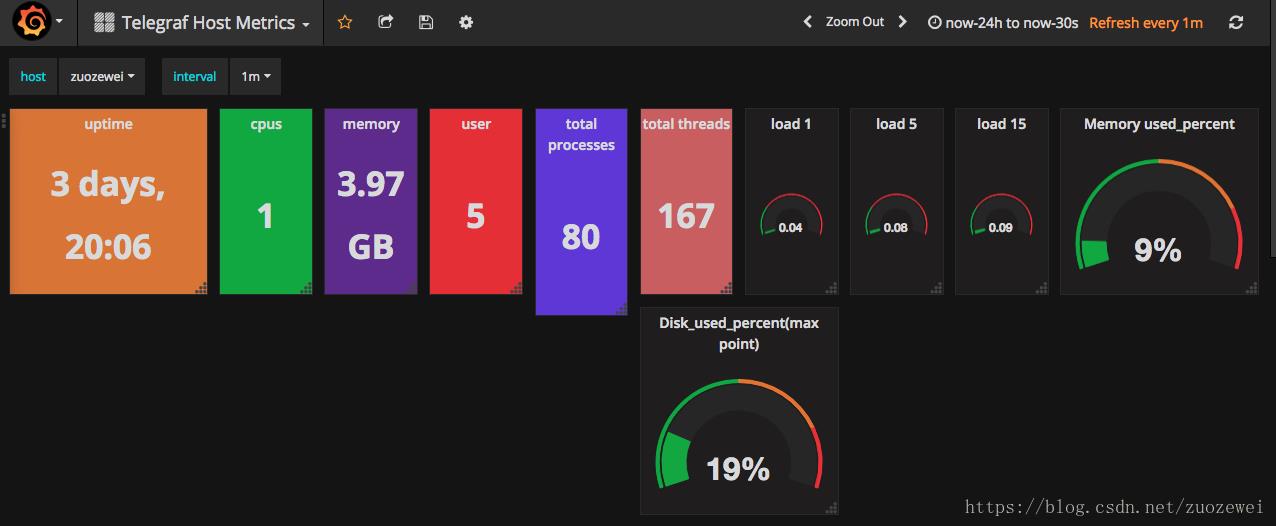
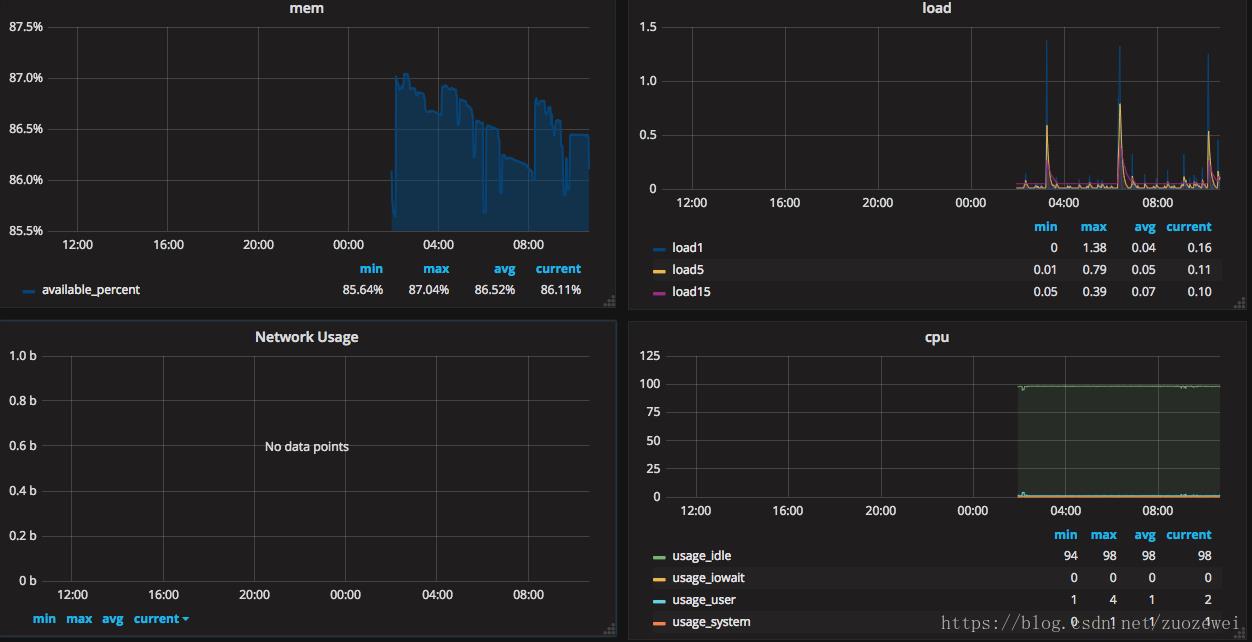
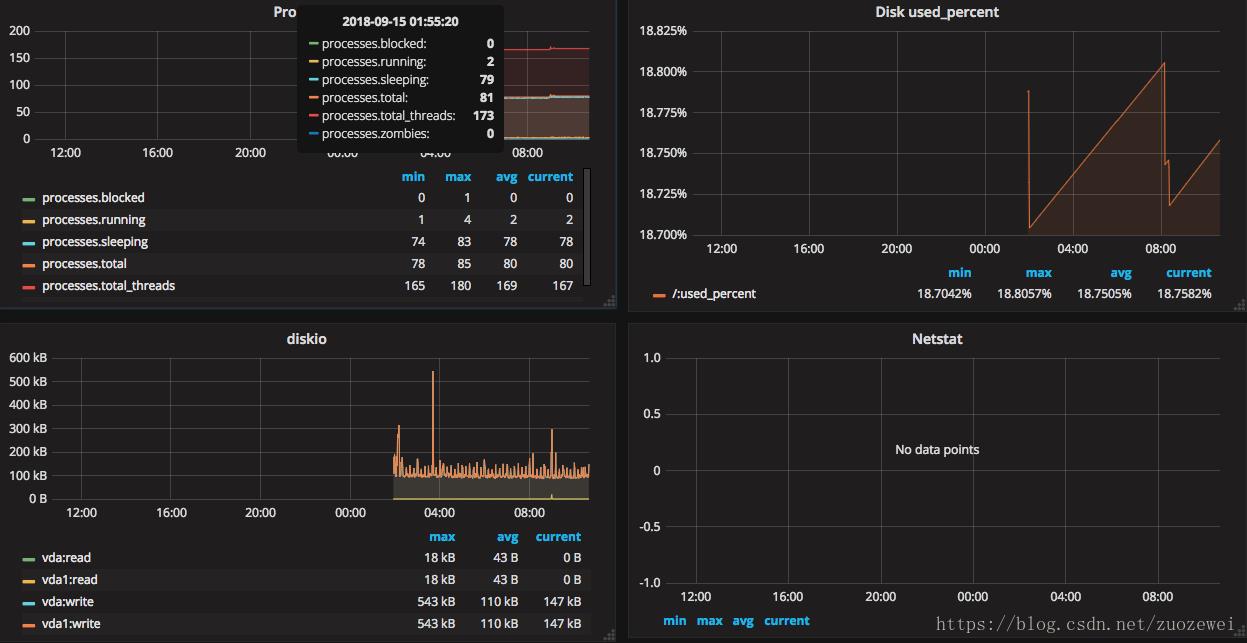
最后来张监控效果高清大图

其他看板模板效果图
模板地址:https://grafana.com/dashboards/1443
相关资源:
- https://github.com/zuozewei/blog-example/tree/master/Performance-testing/03-performance-monitoring/telegraf-Influxdb-grafana-linux
以上是关于性能监控之Telegraf+InfluxDB+Grafana linux服务器实时监控的主要内容,如果未能解决你的问题,请参考以下文章