mapbox尝鲜值之云图动画
Posted 牛老师讲GIS
tags:
篇首语:本文由小常识网(cha138.com)小编为大家整理,主要介绍了mapbox尝鲜值之云图动画相关的知识,希望对你有一定的参考价值。
概述
昨天收到了mapbox中国的推送,看到了mapboxgl的更新,此次更新版本加入了globa,终于有个球了,于是就迫不及待的今天想尝个鲜。
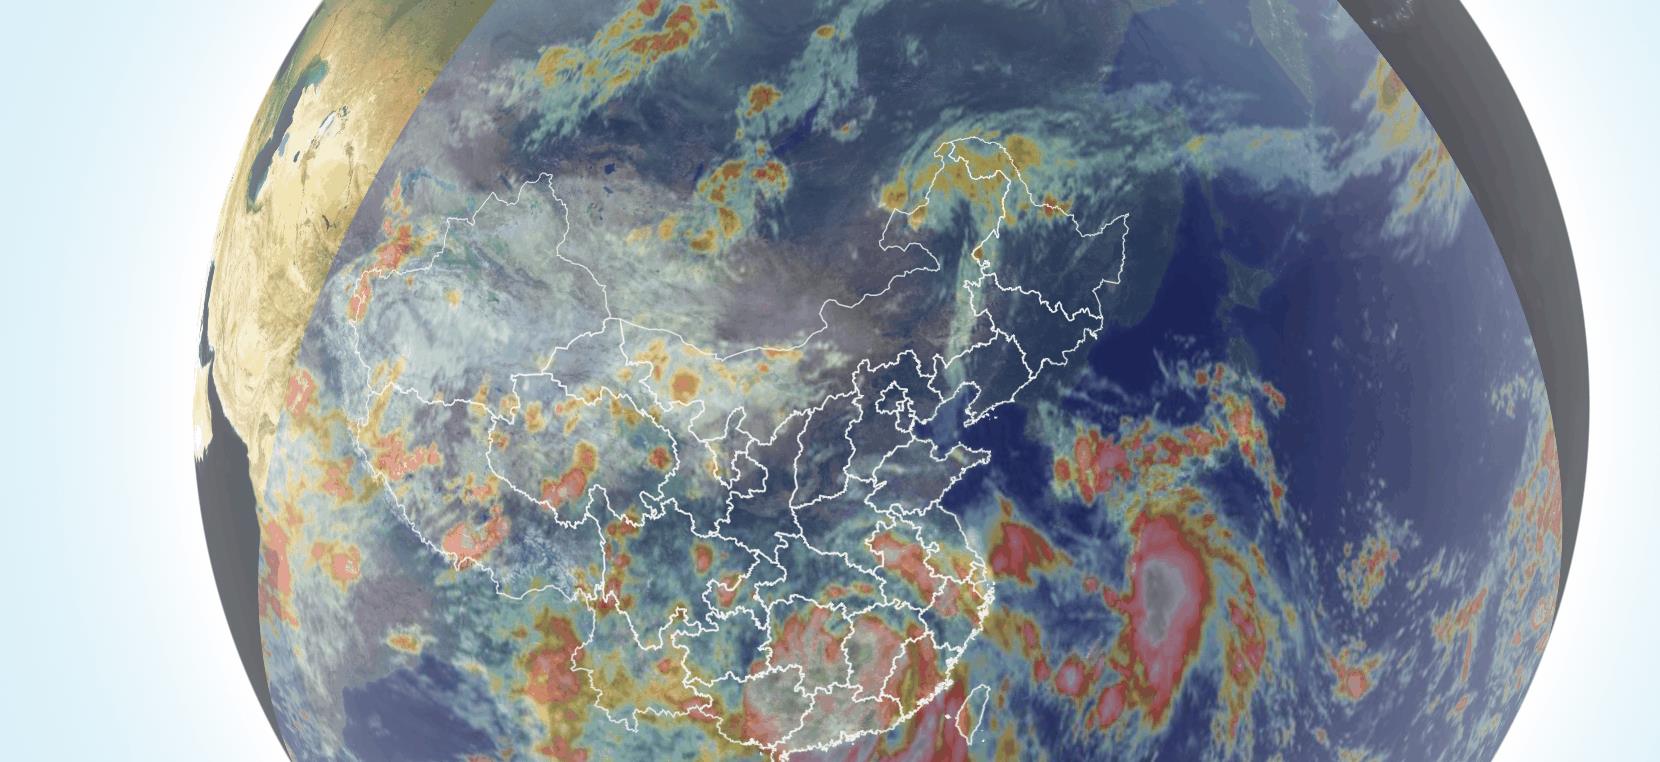
尝鲜效果
主要实现了:1.源码的编译,最新的版本为2.10.0-dev;2、三维球展示;3、由于最近台风活动比较频繁,所以加入了云图动画。实现后效果图如下:
实现
1. 源码编译
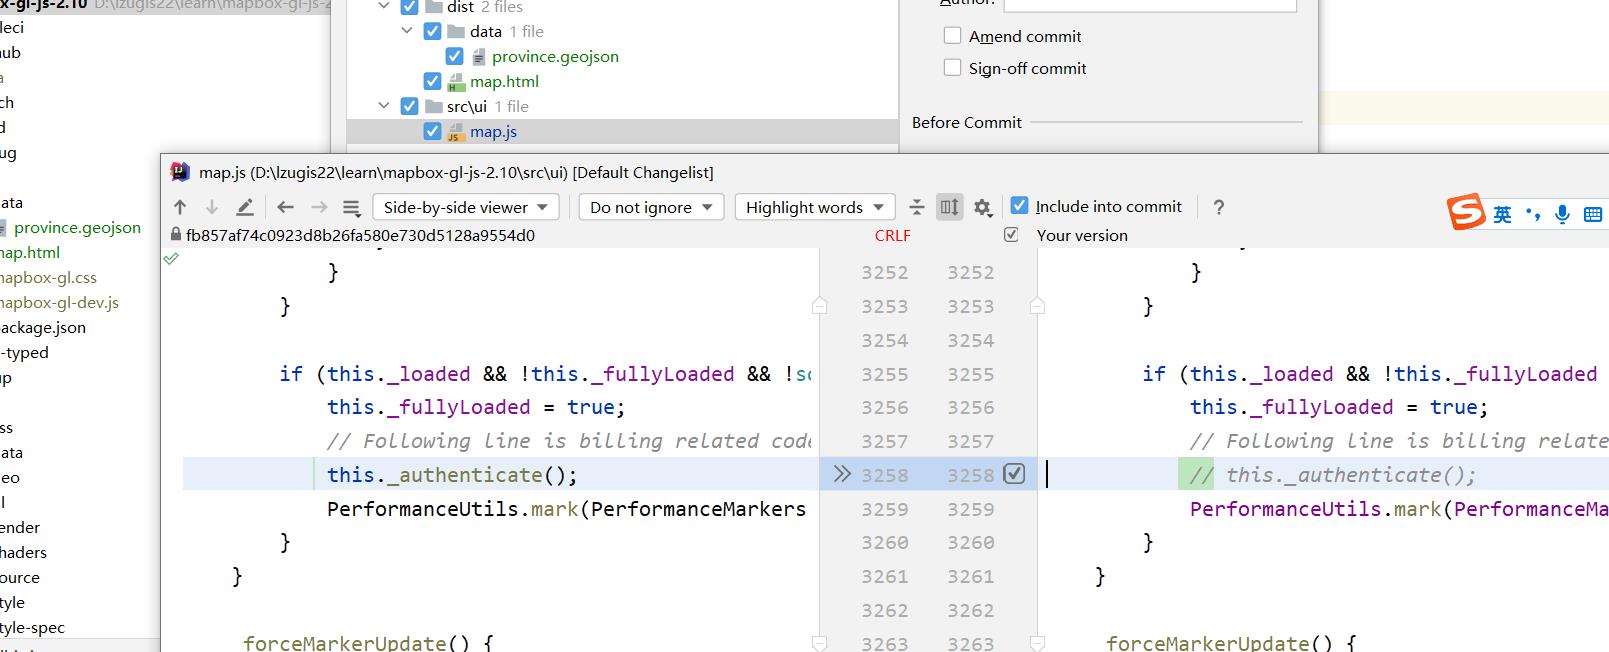
从github上clone源代码,安装依赖,修改源码,取消accessToken的认证。修改src/ui/map.js,注释3258行即可。
运行命令npm run build-css编译css,运行命令npm run build-dev编译开发版,运行命令npm run build-prod-min编译压缩部署版。
2.三维球展示
在之前的版本中map初始化的时候加入了projection这个参数,此次更新中,要想实现三维球只需修改该参数的值为globe即可。
const center = [116.391442, 39.903173]
map = new mapboxgl.Map(
    container: 'map',
    maxZoom: 18,
    minZoom: 0,
    zoom: 3,
    center: center,
    style: mapStyle,
    attributionControl: false,
    projection: 'globe' //三维球投影
);
3、云图动画
接口来源于网络,因为在调用的过程中发现图片存在跨域,所以用node后台做了一下转发,后台代码如下:
const express = require('express')
const request = require("request");
const router = express.Router()
const fs = require('fs')

const baseUrl = 'http://dtbank.gistinker.com'

router.get("/img", function (req, res)
    let  path  = req.query
    const imgUrl = baseUrl + path
    const filePath = './imgs/' + path.split('/').join('-')
    console.log(filePath)
    const file = fs.createWriteStream(filePath)
    request(imgUrl).pipe(file)
    file.on('finish', function()
        const buffer = fs.readFileSync(filePath)
        res.format (
            'image/jpg': function ()
                res.send(buffer);
                file.close();

        )
    )
)

module.exports = router;
前端通过imageSource实现图片的展示,通过通过new Image()实现图片加载完成后再加载下一时刻的图片,优化了动画效果。实现代码如下:
const url = 'https://dtbank.gistinker.com/api/sti/gisimg?start=&end=&tag=IR1&_=1656667444192'
fetch(url).then(res => res.json()).then(res=>
    console.log(res)
    const play = () =>
        if(index === res.length) index = 0
        let extent, time, url = res[index]
        const [xmin, ymin, xmax, ymax] = extent.split(',').map(Number)
        const coords = [
            [xmin, ymax],
            [xmax, ymax],
            [xmax, ymin],
            [xmin, ymin]
        ];
        url = url.split('https://dtbank.gistinker.com').join('http://localhost:19999/ty/img?path=')
        const img = new Image()
        img.src = url
        img.onload = () =>
            if(map.getSource('loopimage'))
                map.getSource('loopimage').updateImage(
                    url: url,
                    coordinates: coords
                )
             else
                map.addSource('loopimage',
                    type: 'image',
                    url: url,
                    coordinates: coords
                );
                map.addLayer(
                    'id': 'loopimage',
                    'source': 'loopimage',
                    'type': 'raster',
                    'paint':
                        'raster-opacity': 0.6,
                        'raster-fade-duration': 0

                , 'province-line');

            index++
            play()


    play()
)
上述示例完整代码如下:
<!doctype html>
<html lang="en">

<head>
    <meta charset="utf-8">
    <meta http-equiv="x-ua-compatible" content="ie=edge">
    <title>白天不懂夜的黑</title>
    <meta name="description" content="">
    <meta name="viewport" content="width=device-width, initial-scale=1, shrink-to-fit=no">
    <link href="./mapbox-gl.css" rel="stylesheet" />
    <style>
        body, #map
            height: 100vh;
            margin: 0;
            padding: 0;
            overflow: hidden;

    </style>
</head>

<body>
<div id="map">
</div>
<script src="./mapbox-gl-dev.js"></script>
<script>
    mapboxgl.accessToken = '';
    const mapStyle =
        "version": 8,
        "name": "Dark",
        "sources":
            "XYZTile":
                "type": "raster",
                "tiles": ['https://api.mapbox.com/v4/mapbox.satellite/z/x/y.webp?sku=1015BRyDI0Jy2'],
                "tileSize": 256
            ,
            'AMAPTile':
                "type": "raster",
                "tiles": ['http://webrd01.is.autonavi.com/appmaptile?x=x&y=y&z=z&lang=zh_cn&size=1&scale=1&style=8'],
                "tileSize": 256,
            ,
            'province':
                type: 'geojson',
                data: './data/province.geojson'

        ,
        "layers": [
            "id": "XYZTile",
            "type": "raster",
            "source": "XYZTile",
            "minzoom": 0,
            "maxzoom": 22
        ,
            'id': 'province-line',
            'source': 'province',
            "type": "line",
            "paint":
                "line-color": "#f4f4f4"

        ]
    ;
    const center = [116.391442, 39.903173]
    map = new mapboxgl.Map(
        container: 'map',
        maxZoom: 18,
        minZoom: 0,
        zoom: 3,
        center: center,
        style: mapStyle,
        attributionControl: false,
        projection: 'globe'
    );

    map.on('load', () =>
        // Add daytime fog
        map.setFog(
            'range': [-1, 2],
            'horizon-blend': 0.3,
            'color': 'white',
            'high-color': '#add8e6',
            'space-color': '#d8f2ff',
            'star-intensity': 0.0
        );

        // Add some 3D terrain
        map.addSource('mapbox-dem',
            'type': 'raster-dem',
            'url': 'mapbox://mapbox.terrain-rgb',
            'tileSize': 512,
            'maxzoom': 14
        );
        // map.setTerrain(
        //   'source': 'mapbox-dem',
        //   'exaggeration': 1.5
        // );

        let index = 0

        const url = 'https://dtbank.gistinker.com/api/sti/gisimg?start=&end=&tag=IR1&_=1656667444192'
        fetch(url).then(res => res.json()).then(res=>
            console.log(res)
            const play = () =>
                if(index === res.length) index = 0
                let extent, time, url = res[index]
                const [xmin, ymin, xmax, ymax] = extent.split(',').map(Number)
                const coords = [
                    [xmin, ymax],
                    [xmax, ymax],
                    [xmax, ymin],
                    [xmin, ymin]
                ];
                url = url.split('https://dtbank.gistinker.com').join('http://localhost:19999/ty/img?path=')
                const img = new Image()
                img.src = url
                img.onload = () =>
                    if(map.getSource('loopimage'))
                        map.getSource('loopimage').updateImage(
                            url: url,
                            coordinates: coords
                        )
                     else
                        map.addSource('loopimage',
                            type: 'image',
                            url: url,
                            coordinates: coords
                        );
                        map.addLayer(
                            'id': 'loopimage',
                            'source': 'loopimage',
                            'type': 'raster',
                            'paint':
                                'raster-opacity': 0.6,
                                'raster-fade-duration': 0

                        , 'province-line');

                    index++
                    play()


            play()
        )
    )
</script>
</body>
</html>
以上是关于mapbox尝鲜值之云图动画的主要内容,如果未能解决你的问题,请参考以下文章