geoserver图层中的维度
Posted 牛老师讲GIS
tags:
篇首语:本文由小常识网(cha138.com)小编为大家整理,主要介绍了geoserver图层中的维度相关的知识,希望对你有一定的参考价值。
概述
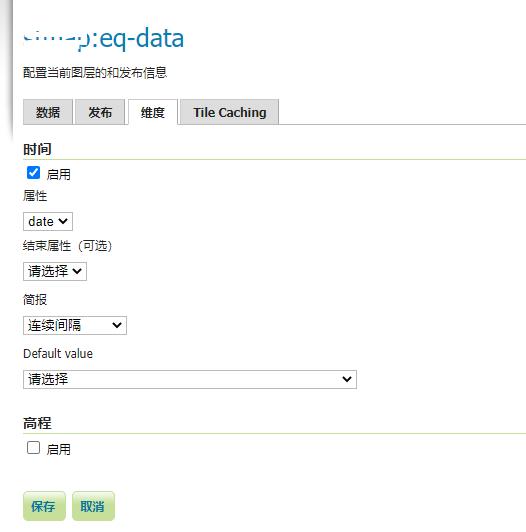
在geoserver图层发布的时候有一个tab面板叫维度,里面包含了时间和高度两个维度,本文就讲一下geoserver有关维度的内容。
效果

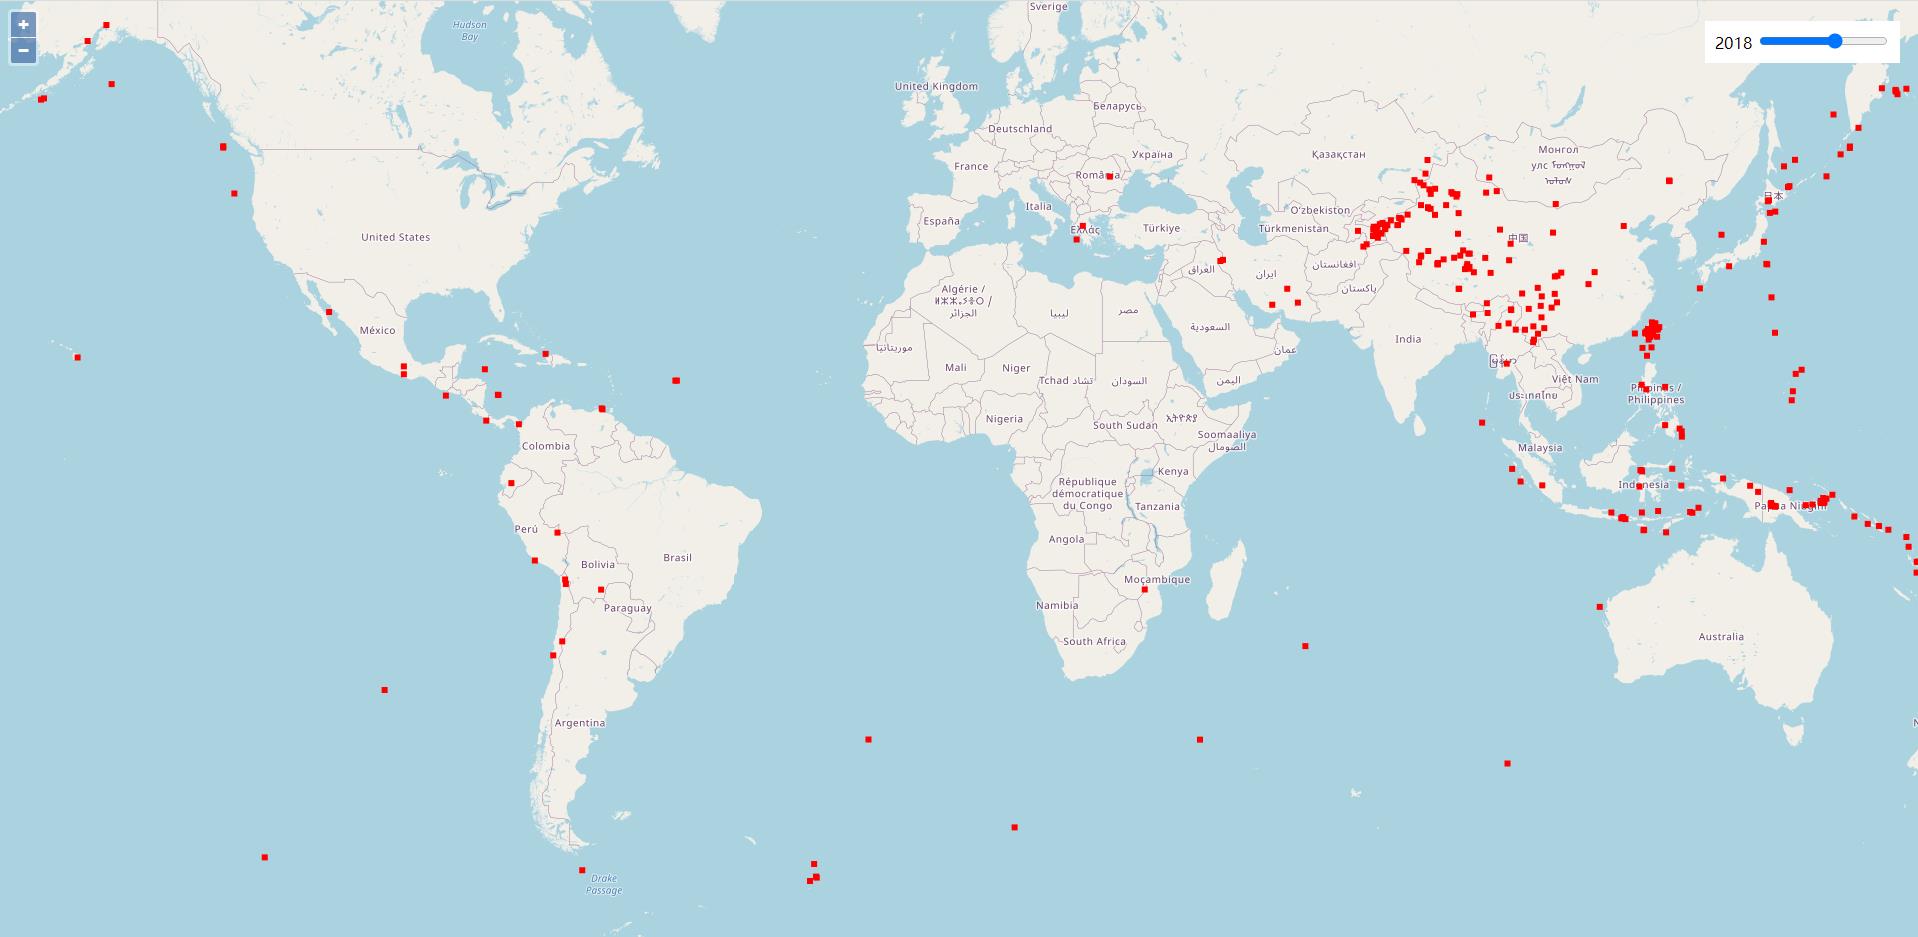
数据来源
本文测试数据来源于中国地震台网——历史查询 (ceic.ac.cn),查询并下载了2012年以后震级大与四级的数据。下载下来后转成csv导入到qgis中,并添加字段date,类型日期,并通过字段计算器输入公式to_date(time)给字段赋值。
geoserver发布数据
先添加shp数据源,再发布服务,发布服务的时候维度的配置如下图。
服务调用
服务发布完成后,通过openlayers进行调用测试,测试代码如下:
<!DOCTYPE html>
<html>
<head>
    <meta charset="utf-8" />
    <meta name="viewport" content="width=device-width,initial-scale=1.0,maximum-scale=1.0,user-scalable=no" />
    <title>map</title>
    <link rel="stylesheet" href="https://openlayers.org/en/v4.6.5/css/ol.css" type="text/css">
    <style>
        html, body, #map
            width: 100%;
            height: 100%;
            overflow: hidden;
            padding: 0;
            margin: 0;

        .tools
            position: absolute;
            top: 20px;
            right: 20px;
            z-index: 99;
            background: white;
            padding: 10px;

    </style>
</head>
<body>
<div id="map">
    <div class="tools">
        <span id="year">2012</span>
        <input type="range" min="2012" max="2022" step="1" value="2012" oninput="changeFn(this)">
    </div>

</div>
<script src="https://openlayers.org/en/v4.6.5/build/ol.js"></script>
<script>
    var center = [0, 0], zoom = 3;
    var osm = new ol.layer.Tile(
        source: new ol.source.OSM()
    );
    var wmsSource = new ol.source.TileWMS(
        url: 'http://localhost:8086/geoserver/lzugis/wms',
        params:
            'LAYERS': 'lzugis:eq-data',
            'TIME': '2012'

    )
    var wms = new ol.layer.Tile(
        source: wmsSource
    )

    var map = new ol.Map(
        controls: ol.control.defaults(
            attribution: false
        ),
        target: 'map',
        layers: [osm, wms],
        view: new ol.View(
            minZoom: 0,
            maxZoom: 18,
            center: ol.proj.fromLonLat(center),
            zoom: zoom
        )
    );

    function changeFn(obj)
        wmsSource.updateParams('TIME': obj.value)
        document.getElementById('year').innerText = obj.value

</script>
</body>
</html>
说明:
- 时间维度(
TIME)根据数据的精度,可精确到年、月、日、时、分、秒,例如,如果TIME的值是年的话,则展示该年的数据,如果如果TIME的值是月的话,则展示该月的数据; - 高程维度(
ELEVATION)跟时间维度类似;
以上是关于geoserver图层中的维度的主要内容,如果未能解决你的问题,请参考以下文章
geoserver图层属性查询及查询结果转换为arcgis js api能使用的格式