react + zarm + antV F2 实现账单数据统计饼图效果
Posted 凯小默:树上的男爵
tags:
篇首语:本文由小常识网(cha138.com)小编为大家整理,主要介绍了react + zarm + antV F2 实现账单数据统计饼图效果相关的知识,希望对你有一定的参考价值。
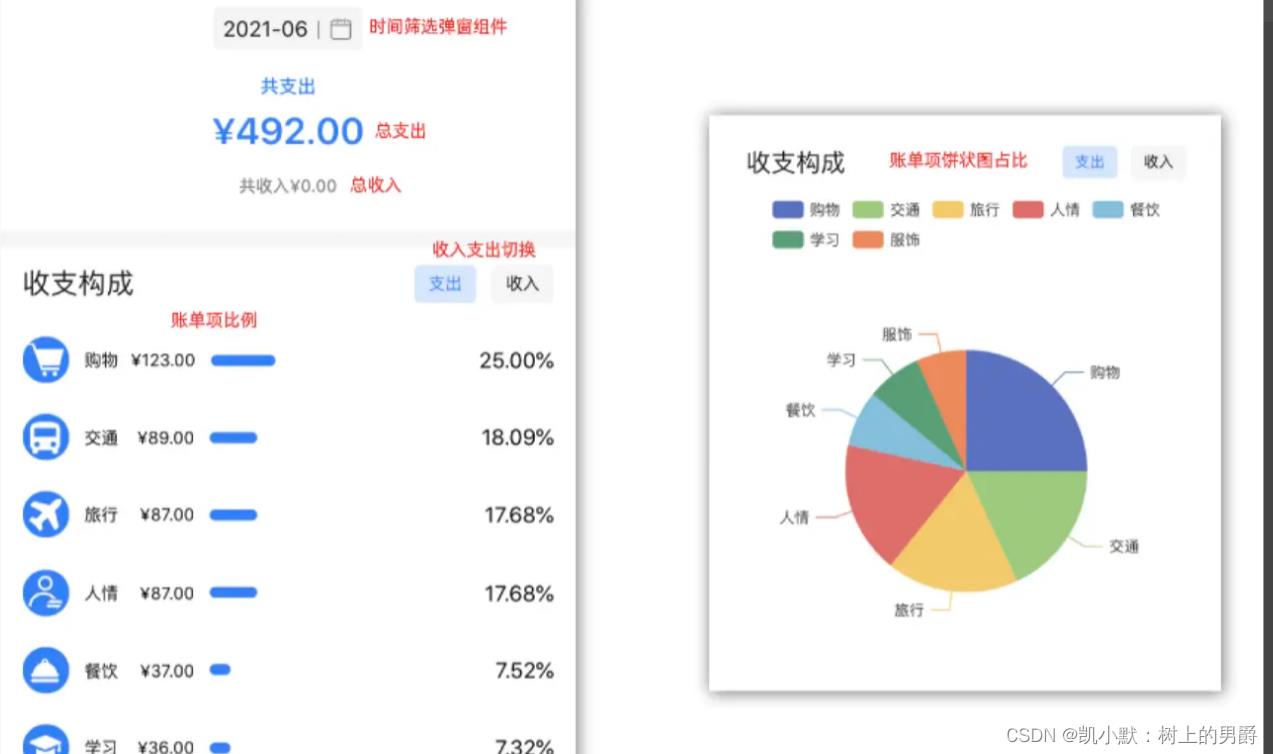
需要实现的效果
为了方便展示,饼图放到右边标明:

实现过程
这里我们尝试用一下 antV F2 移动端可视化引擎来实现饼图效果
1.F2 移动端可视化引擎
F2 是一个专注于移动端,面向常规统计图表,开箱即用的可视化引擎,完美支持 H5 环境同时兼容多种环境(Node, 小程序),完备的图形语法理论,满足你的各种可视化需求,专业的移动设计指引为你带来最佳的移动端图表体验。
如何在 React 中使用:
npm install @antv/f2 --save
npm install @antv/f2-react --save


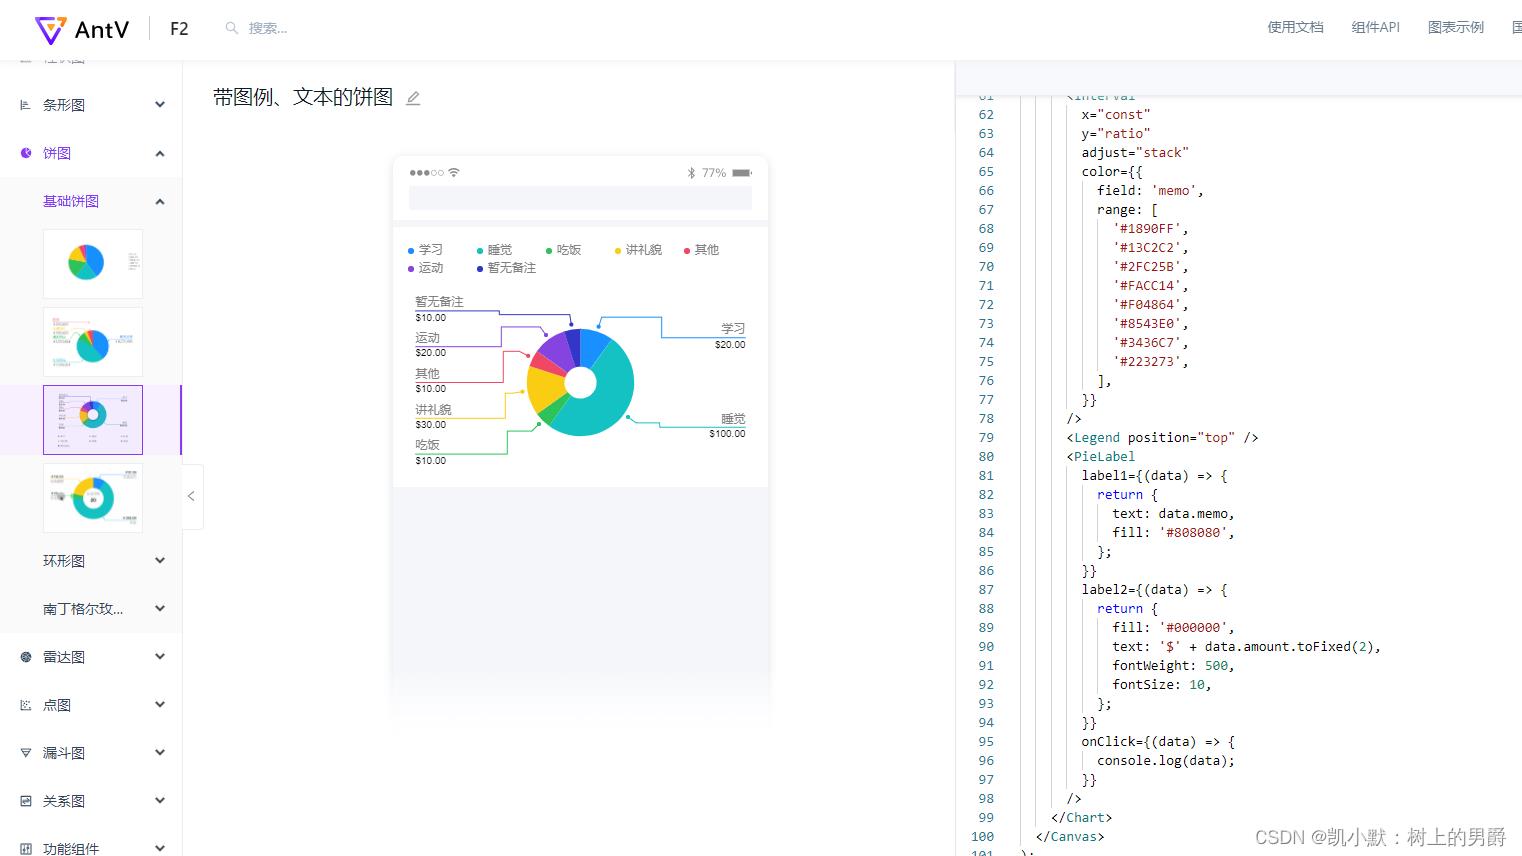
我们可以参考这里的例子:

2.封装饼图组件
我们在 components 里添加 PieChart 文件夹,里面新增 index.jsx 跟 style.module.less 文件,添加代码如下:

import Canvas from "@antv/f2-react";
import  Chart, Interval, Legend, PieLabel  from "@antv/f2";
import PropTypes from 'prop-types';

import s from './style.module.less';

const PieChart = ( chartData = [] ) =>
  console.log('进入 PieChart', chartData)
  return (
    <div className=s.pieChart>
       chartData.length > 0 ? <Canvas pixelRatio=window.devicePixelRatio>
        <Chart
          data=chartData
          coord=
            type: "polar",
            transposed: true,
            radius: 1,

          scale=
        >
          <Interval
            x="payType"
            y="percent"
            adjust="stack"
            color=
              field: "type_name",
              range: ['#5a71c1', '#9eca7e', '#f3ca6b', '#df6e6b', '#84bedb', '#589f74', '#ed8a5c', '#1e80ff', '#fc5531', '#67c23a'],

            selection=
              selectedStyle: (record) =>
                const  yMax, yMin  = record;
                return
                  // 半径放大 1.1 倍
                  r: (yMax - yMin) * 1.1,
                ;
              ,

          />
          <Legend position="top" marker="square" nameStyle=
            fontSize: '14',
            fill: '#000',
           style=
            justifyContent: 'space-between',
            flexDirection: 'row',
            flexWrap: 'wrap'
          />
          <PieLabel
            sidePadding=0
            label1=(data) =>
              return
                text: `$data.type_name:$data.percent%`,
                fill: "#0d1a26",
                fontSize: 12,
              ;

          />
        </Chart>
      </Canvas> : null
    </div>
  );
;

PieChart.propTypes =
  chartData: PropTypes.array,


export default PieChart;
.pie-chart
  min-height: 200px;
3.编写数据分析页面的逻辑
我们在 container 里添加 Data 文件夹,里面新增 index.jsx 跟 style.module.less 文件,以及 api 相关配置文件,添加代码如下:

import React,  useEffect, useRef, useState  from 'react';
import  Icon, Progress, Toast  from 'zarm';
import cx from 'classnames';
import dayjs from 'dayjs';
import CustomIcon from '@/components/CustomIcon';
import PopupDate from '@/components/PopupDate';
import PieChart from '@/components/PieChart';
import  analysisMonthBill  from "./api/index.js";
import  typeMap  from '@/utils';

import s from './style.module.less';

const Data = () =>
  const monthRef = useRef();
  const [currentMonth, setCurrentMonth] = useState(dayjs().format('YYYY-MM')); // 当前月份
  const [totalType, setTotalType] = useState('expense'); // 收入或支出类型
  const [totalExpense, setTotalExpense] = useState(0); // 总支出
  const [totalIncome, setTotalIncome] = useState(0); // 总收入
  const [expenseData, setExpenseData] = useState([]); // 支出数据
  const [incomeData, setIncomeData] = useState([]); // 收入数据
  const [pieType, setPieType] = useState('expense'); // 饼图的「收入」和「支出」控制
  const [chartData, setChartData] = useState([]); // 饼图需要渲染的数据

  useEffect(() =>
    getData();
  , [currentMonth]);

  // 获取数据详情
  const getData = async () =>
    const  status, desc, data  = await analysisMonthBill(
      billDate: currentMonth // 示例值:2022-02
    );
    console.log('获取数据详情', status, desc, data)

    if(status === 200)
      // 总收支
      setTotalExpense(data.totalExpense);
      setTotalIncome(data.totalIncome);

      // 过滤支出和收入
      let expense_data = data.dataList.filter(item => item.pay_type == 1).sort((a, b) => b.number - a.number); // 过滤出账单类型为支出的项
      let income_data = data.dataList.filter(item => item.pay_type == 2).sort((a, b) => b.number - a.number); // 过滤出账单类型为收入的项
      expense_data = expense_data.map(item =>
        return
          ...item,
          payType: item.pay_type.toString(),
          percent: Number(Number((item.number / Number(data.totalExpense)) * 100).toFixed(2))

      )
      income_data = income_data.map(item =>
        return
          ...item,
          payType: item.pay_type.toString(),
          percent: Number(Number((item.number / Number(data.totalIncome)) * 100).toFixed(2))

      )

      setExpenseData(expense_data);
      setIncomeData(income_data);
      // 设置饼图数据
      setChartData(pieType == 'expense' ? expense_data : income_data);
    else
      Toast.show(desc);

  ;

  // 月份弹窗开关
  const monthShow = () =>
    monthRef.current && monthRef.current.show();
  ;
  // 选择月份
  const selectMonth = (item) =>
    setCurrentMonth(item);
  ;
  // 切换收支构成类型
  const changeTotalType = (type) =>
    setTotalType(type);
  ;
  // 切换饼图收支类型
  const changePieType = (type) =>
    setPieType(type);
    setChartData(type == 'expense' ? expenseData : incomeData);


  return <div className=s.data>
    <div className=s.total>
      <div className=s.time onClick=monthShow>
        <span>currentMonth</span>
        <Icon className=s.date type="date" />
      </div>
      <div className=s.title>共支出</div>
      <div className=s.expense>¥ totalExpense </div>
      <div className=s.income>共收入¥ totalIncome </div>
    </div>
    <div className=s.structure>
      <div className=s.head>
        <span className=s.title>收支构成</span>
        <div className=s.tab>
          <span onClick=() => changeTotalType('expense') className=cx( [s.expense]: true, [s.active]: totalType == 'expense' )>支出</span>
          <span onClick=() => changeTotalType('income') className=cx( [s.income]: true, [s.active]: totalType == 'income' )>收入</span>
        </div>
      </div>
      <div className=s.content>

          (totalType == 'expense' ? expenseData : incomeData).map(item => <div key=item.type_id className=s.item>
            <div className=s.left>
              <div className=s.type>
                <span className=cx( [s.expense]: totalType == 'expense', [s.income]: totalType == 'income' )>
                  <CustomIcon
                    type=item.type_id ? typeMap[item.type_id].icon : 1
                  />
                </span>
                <span className=s.name> item.type_name </span>
              </div>
              <div className=s.progress>¥ Number(item.number).toFixed(2) || 0 </div>
            </div>
            <div className=s.right>
              <div className=s.percent>
                <Progress
                  shape="line"
                  percent=Number((item.number / Number(totalType == 'expense' ? totalExpense : totalIncome)) * 100).toFixed(2)
                  theme='primary'
                />
              </div>
            </div>
          </div>)

      </div>
      <div className=s.proportion>
        <div className=s.head>
          <span className=s.title>收支构成</span>
          <div className=s.tab>
            <span onClick=() => changePieType('expense') className=cx( [s.expense]: true, [s.active]: pieType == 'expense'  )>支出</span>
            <span onClick=() => changePieType('income') className=cx( [s.income]: true, [s.active]: pieType == 'income'  )>收入</span>
          </div>
        </div>
        /* 饼图 */
        <PieChart chartData=chartData />
      </div>
    </div>
    <PopupDate ref=monthRef mode="month" onSelect=selectMonth />
  </div>


export default Data
.data
min-height: 100%;
background-color: #f5f5f5;
.total
background-color: #fff;
display: flex;
flex-direction: column;
align-items: center;
padding: 24px 0;
margin-bottom: 10px;
.time
position: relative;
width: 96px;
padding: 6px;
background-color: #f5f5f5;
color: rgba(0, 0, 0, .9);
border-radius: 4px;
font-size: 14px;
display: flex;
justify-content: space-between;
align-items: center;
margin-bottom: 16px;
span:nth-of-type(1)::after
content: '';
position: absolute;
top: 9px;
bottom: 8px;
right: 28px;
width: 1px;
background-color: rgba(0, 0, 0, .5);
.date
font-size: 16px;
color: rgba(0, 0, 0, .5);
.title
color: #007fff;
margin-bottom: 8px;
font-size: 12px;
font-weight: 500;
.expense
font-size