Python数据可视化大杀器之Seaborn:学完可实现90%数据分析绘图
Posted JoJo的数据分析历险记
tags:
篇首语:本文由小常识网(cha138.com)小编为大家整理,主要介绍了Python数据可视化大杀器之Seaborn:学完可实现90%数据分析绘图相关的知识,希望对你有一定的参考价值。
Python数据可视化
- 🌸个人主页:JoJo的数据分析历险记
- 📝个人介绍:小编大四统计在读,目前保研到统计学top3高校继续攻读统计研究生
- 💌如果文章对你有帮助,欢迎关注、点赞、收藏、订阅专栏
本系列主要介绍python数据可视化的应用
参考资料: https://github.com/fengdu78/Data-Science-Notes
文章目录
- Python数据可视化
- 💮python数据可视化大杀器之Seaborn详解
- 🏵️1.关系图
- 🌼2. 分类型图表
- 🌵3.分布图
- 🍂4. 回归图
- 🌎5.矩阵图
- ✏️6.FacetGrid绘制多个图表
- 💟文章推荐
💮python数据可视化大杀器之Seaborn详解
一张好的图胜过一千个字,一个好的数据分析师必须学会用图说话。python作为数据分析最常用的工具之一,它的可视化功能也很强大,matplotlib和seaborn库使得绘图变得更加简单。本章主要介绍一下Searborn绘图。学过matplotlib的小伙伴们一定被各种参数弄得迷糊,而seaborn则避免了这些问题,废话少说,我们来看看searborn具体是怎样使用的。
Seaborn中概况起来可以分为五大类图
- 1.关系类绘图
- 2.分类型绘图
- 3.分布图
- 4.回归图
- 5.矩阵图
接下来我们一一讲解这些图形的应用,首先我们要导入一下基本的库
%matplotlib inline
# 如果不添加这句,是无法直接在jupyter里看到图的
import seaborn as sns
import numpy as np
import pandas as pd
import matplotlib.pyplot as plt
如果上面报错的话需要安装相应的包
pip install seaborn
pip install numpy
pip install pandas
pip install matplotlib
我们可以使用set()设置一下seaborn的主题,一共有:darkgrid,whitegrid,dark,white,ticks,大家可以根据自己的喜好设置相应的主题,默认是darkgrid。我这里就设置darkgrid风格
sns.set(style="darkgrid")
接下来导入我们需要的数据集,seaborn和R语言ggplot2(感兴趣欢迎阅读我的R语言ggplot2专栏)一样有许多自带的样例数据集
# 导入anscombe数据集
df = sns.load_dataset('anscombe')
# 观察一下数据集形式
df.head()
| dataset | x | y | |
|---|---|---|---|
| 0 | I | 10.0 | 8.04 |
| 1 | I | 8.0 | 6.95 |
| 2 | I | 13.0 | 7.58 |
| 3 | I | 9.0 | 8.81 |
| 4 | I | 11.0 | 8.33 |
🏵️1.关系图
🌹1.1 lineplot
绘制线段
seaborn里的lineplot函数所传数据必须为一个pandas数组,这一点跟matplotlib里有较大区别,并且一开始使用较为复杂,sns.lineplot里有几个参数值得注意。
-
x: plot图的x轴label
-
y: plot图的y轴label
-
ci: 置信区间
-
data: 所传入的pandas数组
绘制时间序列图
# 导入数据集
fmri = sns.load_dataset("fmri")

# 绘制不同地区不同时间 x和y的线性关系图
sns.lineplot(x="timepoint", y="signal",
             hue="region", style="event",
             data=fmri)
<AxesSubplot:xlabel='timepoint', ylabel='signal'>

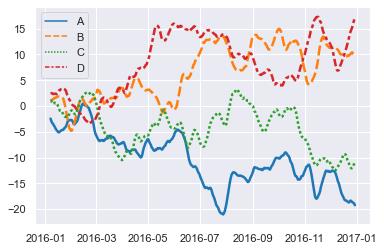
rs = np.random.RandomState(365)
values = rs.randn(365, 4).cumsum(axis=0)
dates = pd.date_range("1 1 2016", periods=365, freq="D")
data = pd.DataFrame(values, dates, columns=["A", "B", "C", "D"])
data = data.rolling(7).mean()
sns.lineplot(data=data, palette="tab10", linewidth=2.5)
<AxesSubplot:>
🥀1.2 relplot
这是一个图形级别的函数,它用散点图和线图两种常用的手段来表现统计关系。
# 导入数据集
dots = sns.load_dataset("dots")
sns.relplot(x="time", y="firing_rate",
            hue="coherence", size="choice", col="align",
            size_order=["T1", "T2"],
            height=5, aspect=.75, facet_kws=dict(sharex=False),
            kind="line", legend="full", data=dots)
<seaborn.axisgrid.FacetGrid at 0x1d7d3634e50>

🌺1.3 scatterplot(散点图)
diamonds.head()
| carat | cut | color | clarity | depth | table | price | x | y | z | |
|---|---|---|---|---|---|---|---|---|---|---|
| 0 | 0.23 | Ideal | E | SI2 | 61.5 | 55.0 | 326.0 | 3.95 | 3.98 | 2.43 |
| 1 | 0.21 | Premium | E | SI1 | 59.8 | 61.0 | 326.0 | 3.89 | 3.84 | 2.31 |
| 2 | 0.23 | Good | E | VS1 | 56.9 | 65.0 | 327.0 | 4.05 | 4.07 | 2.31 |
| 3 | 0.29 | Premium | I | VS2 | 62.4 | 58.0 | 334.0 | 4.20 | 4.23 | 2.63 |
| 4 | 0.31 | Good | J | SI2 | 63.3 | 58.0 | 335.0 | 4.34 | 4.35 | 2.75 |
sns.set(style="whitegrid")

# Load the example iris dataset
diamonds = sns.load_dataset("diamonds")

# Draw a scatter plot while assigning point colors and sizes to different
# variables in the dataset
f, ax = plt.subplots(figsize=(6.5, 6.5))
sns.despine(f, left=True, bottom=True)
sns.scatterplot(x="depth", y="table",
                data=diamonds, ax=ax)
<AxesSubplot:xlabel='depth', ylabel='table'>

🌻1.4 气泡图
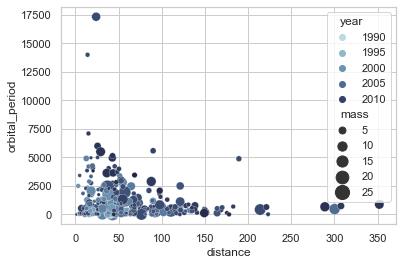
气泡图是在散点图的基础上,指定size参数,根据size参数的大小来绘制点的大小
- 1.4.1 普通气泡图
# 导入鸢尾花数据集
planets = sns.load_dataset("planets")

cmap = sns.cubehelix_palette(rot=-.2, as_cmap=True)
ax = sns.scatterplot(x="distance", y="orbital_period",
                     hue="year", size="mass",
                     palette=cmap, sizes=(10, 200),
                     data=planets)
- 1.4.2 彩色气泡图
sns.set(style="white")

#加载示例mpg数据集
mpg = sns.load_dataset("mpg")

# 绘制气泡图
sns.relplot(x="horsepower", y="mpg", hue="origin", size="weight",
            sizes=(40, 400), alpha=.5, palette="muted",
            height=6, data=mpg)

🌼2. 分类型图表
🌷2.1 boxplot(箱线图)
箱形图(Box-plot)又称为盒须图、盒式图或箱线图,是一种用作显示一组数据分散情况资料的统计图。它能显示出一组数据的最大值、最小值、中位数及上下四分位数。
绘制分组箱线图
# 导入数据集
tips = sns.load_dataset("tips")

# 绘制嵌套的箱线图,按日期和时间显示账单
sns.boxplot(x="day", y="total_bill",
            hue="smoker", palette=["m", "g"],
            data=tips)
sns.despine(offset=10, trim=True)

🌱2.2 violinplot(小提琴图)
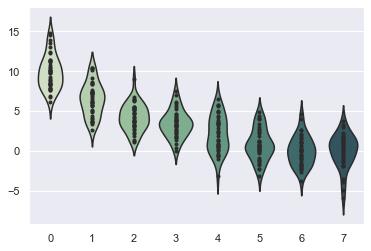
violinplot与boxplot扮演类似的角色,它显示了定量数据在一个(或多个)分类变量的多个层次上的分布,这些分布可以进行比较。不像箱形图中所有绘图组件都对应于实际数据点,小提琴绘图以基础分布的核密度估计为特征。
绘制简单的小提琴图
# 生成模拟数据集
rs = np.random.RandomState(0)
n, p = 40, 8
d = rs.normal(0, 2, (n, p))
d += np.log(np.arange(1, p + 1)) * -5 + 10

# 使用cubehelix获得自定义的顺序调色板
pal = sns.cubehelix_palette(p, rot=-.5, dark=.3)

# 如何使用小提琴和圆点进行每种分布
sns.violinplot(data=d, palette=pal, inner="point")
<AxesSubplot:>
绘制分组小提琴图
tips = sns.load_dataset("tips")

# 绘制一个嵌套的小提琴图,并拆分小提琴以便于比较
sns.violinplot(x="day", y="total_bill", hue="smoker",
               split=True, inner="quart",
               palette="Yes": "y", "No": "b",
               data=tips)
sns.despine(left=True)

🌲2.3 barplot(条形图)
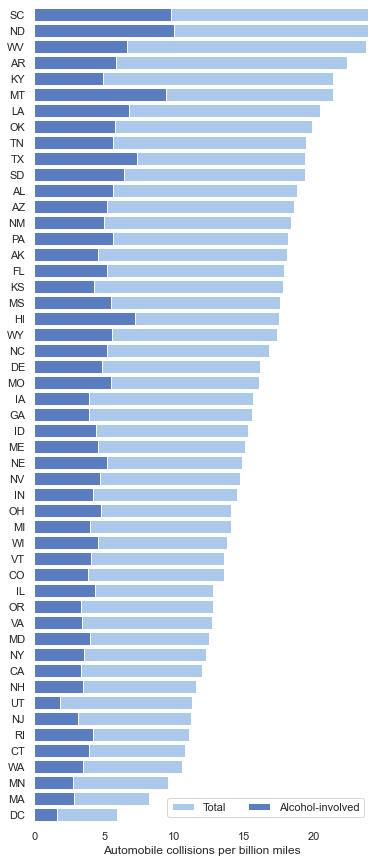
条形图表示数值变量与每个矩形高度的中心趋势的估计值,并使用误差线提供关于该估计值附近的不确定性的一些指示。
绘制水平的条形图
crashes = sns.load_dataset("car_crashes").sort_values("total", ascending=False)

# 初始化画布大小
f, ax = plt.subplots(figsize=(6, 15))
# 绘出总的交通事故
sns.set_color_codes("pastel")
sns.barplot(x="total", y="abbrev", data=crashes,
            label="Total", color="b")

# 绘制涉及酒精的车祸
sns.set_color_codes("muted")
sns.barplot(x="alcohol", y="abbrev", data=crashes,
            label="Alcohol-involved", color="b")

# 添加图例和轴标签
ax.legend(ncol=2, loc="lower right", frameon=True)
ax.set(xlim=(0, 24), ylabel="",
       xlabel="Automobile collisions per billion miles")
sns.despine(left=True, bottom=True)
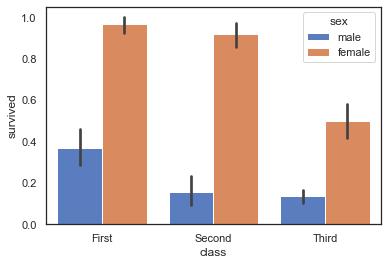
绘制分组条形图
titanic = sns.load_dataset("titanic")

# 绘制分组条形图
g = sns.barplot(x="class", y="survived", hue="sex", data=titanic,
                 palette="muted")
🌳2.4 pointplot(点图)
点图代表散点图位置的数值变量的中心趋势估计,并使用误差线提供关于该估计的不确定性的一些指示。点图可能比条形图更有用于聚焦一个或多个分类变量的不同级别之间的比较。他们尤其善于表现交互作用:一个分类变量的层次之间的关系如何在第二个分类变量的层次之间变化。连接来自相同色调等级的每个点的线允许交互作用通过斜率的差异进行判断,这比对几组点或条的高度比较容易。
sns.set(style="whitegrid")
iris = sns.load_dataset("iris")

# 将数据格式调整
iris = pd.melt(iris, "species", var_name="measurement")

# 初始化图形
f, ax = plt.subplots()
sns.despine(bottom=True, left=True)

sns.stripplot(x="value", y="measurement", hue="species",
              data=iris, dodge=True, jitter=True,
              alpha=.25, zorder=1)

# 显示条件平均数
sns.pointplot(x="value", y="measurement", hue="species",
              data=iris, dodge=.532, join=False, palette="dark",
              markers="d", scale=.75, ci=None)

# 图例设置
handles, labels = ax.get_legend_handles_labels()
ax.legend(handles[3:], labels[3:], title="species",
          handletextpad=0, columnspacing=1,
          loc="lower right", ncol=3, frameon=True)
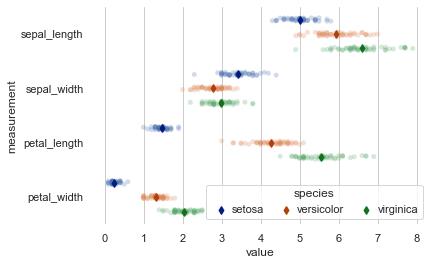
可以看出各种鸢尾花四个特征的分布情况,以setosa为例,发现其petal_width值集中分布在0.2左右
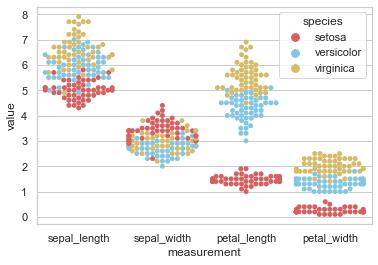
🍁2.5 swarmplot
能够显示分布密度的分类散点图
sns.set(style="whitegrid", palette="muted")

# 加载数据集
iris = sns.load_dataset("iris")

# 处理数据集
iris = pd.melt(iris, "species", var_name="measurement")

# 绘制分类散点图
sns.swarmplot(x="measurement", y="value", hue="species",
              palette=["r", "c", "y"], data=iris)
🌴2.6 catplot(分类型图表的接口)
可以通过指定kind参数分别绘制下列图形:
- stripplot() 分类散点图
- swarmplot() 能够显示分布密度的分类散点图
- boxplot() 箱图
- violinplot() 小提琴图
- boxenplot() 增强箱图
- pointplot() 点图
- barplot() 条形图
- countplot() 计数图
🌵3.分布图
🌾3.1 displot(单变量分布图)
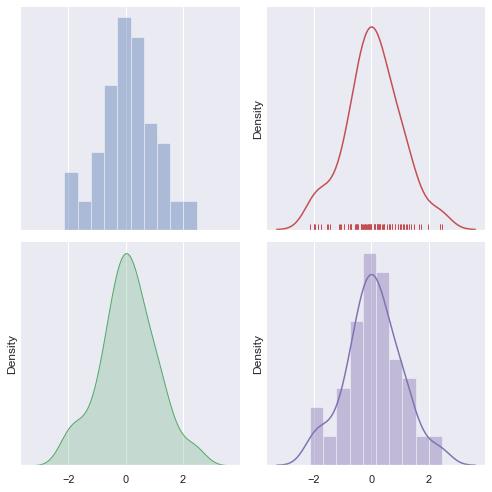
在seaborn中想要对单变量分布进行快速了解最方便的就是使用distplot()函数,默认情况下它将绘制一个直方图,并且可以同时画出核密度估计(KDE)图。具体用法如下:
# 设置并排绘图,讲一个画布分为2*2,大小为7*7,X轴固定,通过ax参数指定绘图位置,可以看第六章具体怎么绘制多个图在一个画布中
f, axes = plt.subplots(2, 2, figsize=(7, 7), sharex=True)
sns.despine(left=True)
rs = np.random.RandomState(10)
# 生成随机数
d = rs.normal(size=100)
# 绘制简单的直方图,kde=False不绘制核密度估计图,下列其他图类似
sns.distplot(d, kde=False, color="b", ax=axes[0, 0])

# 绘制核密度估计图和地毯图
sns.distplot(d, hist=False, rug=True, color="r", ax=axes[0, 1])

# 绘制填充核密度估计图
sns.distplot(d, hist=False, color="g", kde_kws="shade": True, ax=axes[1, 0])

# 绘制直方图和核密度估计
sns.distplot(d, color="m", ax=axes[1, 1])
plt.setp(axes, yticks=[])
plt.tight_layout()
🌿3.2kdeplot(核密度估计图)
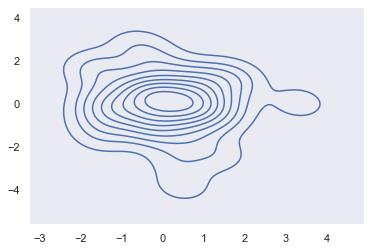
核密度估计(kernel density estimation)是在统计学中用来估计未知分布的密度函数,属于非参数检验方法之一。通过核密度估计图可以比较直观的看出数据样本本身的分布特征。具体用法如下:
简单的二维核密度估计图
sns.set(style="dark")
rs = np.random.RandomState(50)

x, y = rs.randn(2, 50)
sns.kdeplot(x, y)
f.tight_layout()
多个核密度估计图
sns.set(style="darkgrid")
iris = sns.load_dataset("iris")

# 按物种对iris数据集进行子集划分
setosa = iris.query("species == 'setosa'")
virginica = iris.query("species == 'virginica'")

f, ax = plt.subplots(figsize=(8, 8))
ax.set_aspect("equal")

# 画两个密度图
ax = sns.kdeplot(setosa.sepal_width, setosa.sepal_length,
                 cmap="Reds", shade=True, shade_lowest=False)
ax = sns.kdeplot(virginica.sepal_width, virginica.sepal_length,
                 cmap="Blues", shade=True, shade_lowest=False)

# 将标签添加到绘图中
red = sns.color_palette("Reds")[-2]
blue = sns.color_palette("Blues")[-2]
ax.text(2.5, 8.2, "virginica", size=16, color=blue)
ax.text(3.8, 4.5, "setosa", size=16, color=red)

☘️3.3绘制山脊图
rs = np.random.RandomState(1979)
x = rs.randn(500)
g = np.tile(list("ABCDEFGHIJ"), 50)
df = pd.DataFrame(dict(x=x, g=g))
m = df.g.map(ord)
df["x"] += m
# 初始化FacetGrid对象
pal = sns.cubehelix_palette(10, rot=-.25, light=.7)
g = sns.FacetGrid(df, row="g", hue="g", aspect=15, height=.5, palette=pal)
# 画出密度
g.map(sns.kdeplot, "x", clip_on=Fals
"?e, shade=True, alpha=1, lw=1.5, bw=.2)
g.map(sns.kdeplot, "x", clip_on=False, color="w", lw=2, bw=.2)
g.map(plt.axhline, y=0, lw=2, clip_on=False)
# 定义并使用一个简单的函数在坐标轴中标记绘图
def label(x, color, label):
ax = plt.gca()
ax.text(0