prometheus监控es集群 — elasticsearch_exporter
Posted 程序员超时空
tags:
篇首语:本文由小常识网(cha138.com)小编为大家整理,主要介绍了prometheus监控es集群 — elasticsearch_exporter相关的知识,希望对你有一定的参考价值。
1.下载elasticsearch_exporter的二进制包并解压、运行
下载二进制包并解压、运行:
$ wget https://github.com/prometheus-community/elasticsearch_exporter/releases/download/v1.3.0/elasticsearch_exporter-1.3.0.linux-amd64.tar.gz
$ tar -xvf elasticsearch_exporter-1.3.0.linux-amd64.tar.gz
$ mv elasticsearch_exporter-1.3.0.linux-amd64/ elasticsearch_exporter
$ cd elasticsearch_exporter/

运行elasticsearch_exporter:
$ nohup ./elasticsearch_exporter --es.all --es.indices --es.cluster_settings --es.indices_settings --es.shards --es.snapshots --es.timeout=10s --web.listen-address=":9114" --web.telemetry-path="/metrics" --es.uri http://10.20.30.40:9200 &xelasticsearch_exporter

查看输出日志:
$ tailf nohup.out

看指标信息:
$ curl "http://10.20.30.40:9114/metrics"
2.在Prometheus配置文件中加入新的job_name,写elasticsearch_exporter暴露指标的ip端口:
添加job_name部分:
$ cat prometheus.yml
  - job_name: "elasticsearch_exporter"
    static_configs:
            - targets: ["10.20.30.40:9114"]

重启prometheus:
$ systemctl restart prometheus.service
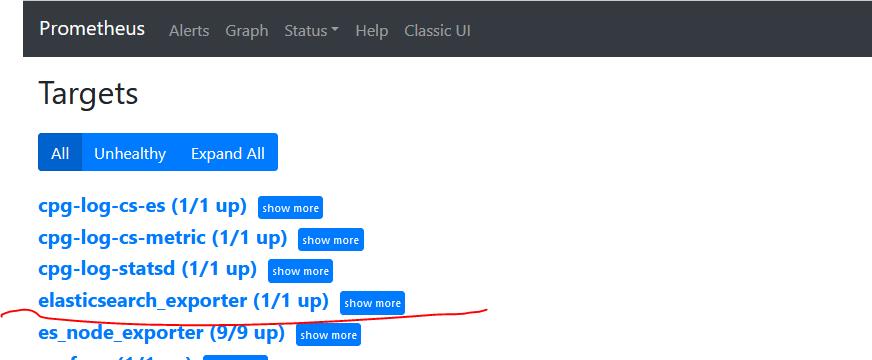
3.在 Prometheus Web 查看监控抓取目标,抓取成功:
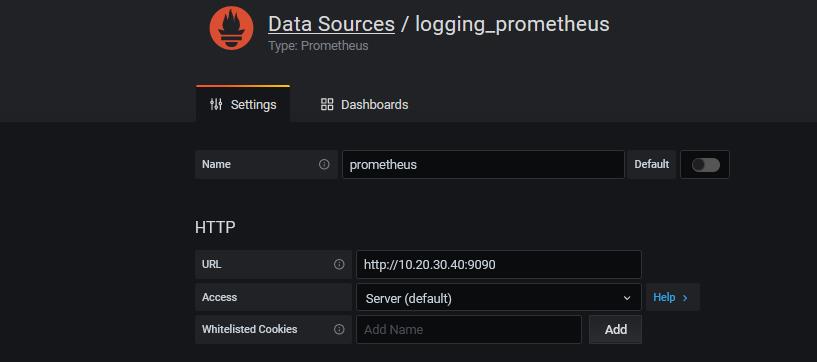
4.grafana确认已添加prometheus数据源
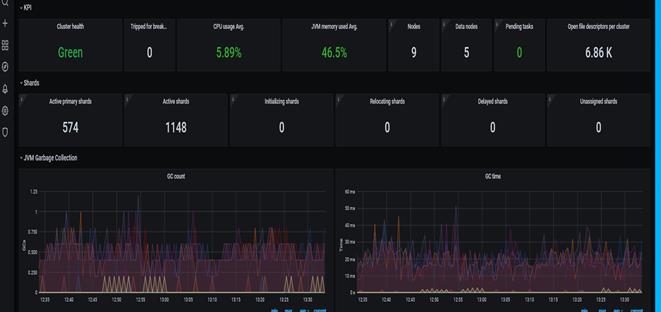
5. 在grafana Web 上导入仪表盘id为2322,选择prometheus数据源,在该仪表盘里可看到监控elasticsearch集群指标的完整信息。
以上是关于prometheus监控es集群 — elasticsearch_exporter的主要内容,如果未能解决你的问题,请参考以下文章
Prometheus监控elasticsearch集群(以elasticsearch-6.4.2版本为例)
我为什么用ES做Redis监控,不用Prometheus或Zabbix?
一文搞定Centos7.x安装ELK的7.6.2版本以及Cerebro集群监控
企业运维实战-k8s学习笔记17.k8s集群+Prometheus监控部署基于prometheus实现k8s集群的hpa动态伸缩虚拟机部署prometheus监控