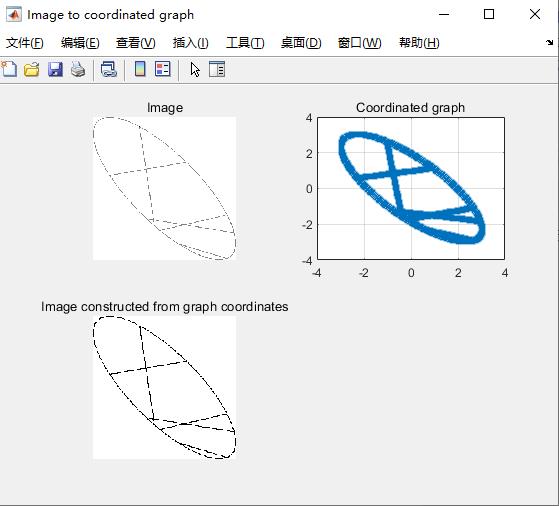
基于matlab从图形坐标转换图像
Posted fpga&matlab
tags:
篇首语:本文由小常识网(cha138.com)小编为大家整理,主要介绍了基于matlab从图形坐标转换图像相关的知识,希望对你有一定的参考价值。
%usage_ImageToAndFromGraphCooridinates
% Caveat: center of plot may be required
close all; clear all; clc;
plotRowSize = 2;
plotColSize = 2;
plotIndex = 0;

lowerRangeX = -3;
upperRangeX = 3;
lowerRangeY = -3;
upperRangeY = 3;

inputFolder = 'outputFiles';
targetFile  = 'pixeliZedScratchPad.mat';
targetFileName  = strcat(inputFolder, '\\', targetFile);
targetFile = whos('-file', targetFileName);

targetFileContents = load (targetFileName); % load map
load (targetFileName);                      % load contents

% [UM: for the time being we deal with BW, ie. 2 levels]
figure('Name', 'Image to coordinated graph', 'NumberTitle','off');
plotIndex = plotIndex + 1;
subplot(plotRowSize,plotColSize, plotIndex);
imshow(pixeliZedScratchPad, []);
title('Image');
% pixeliZedScratchPad = floor(pixeliZedScratchPad);

% image to graph coordinates
[plotCoordinates_x plotCoordinates_y] = mapPixelsToCoordinatedPlotGraph(pixeliZedScratchPad, ...
            upperRangeX, lowerRangeX, lowerRangeY, upperRangeY);

% graph coordinates to image
imageSize = 200;
pixeliZedScratchPad_reconstructed = plotCoordinatesToImagePixels(plotCoordinates_x, plotCoordinates_y, imageSize);

plotIndex = plotIndex + 1;
subplot(plotRowSize,plotColSize, plotIndex);
plot(plotCoordinates_x, plotCoordinates_y, 'x');
title('Coordinated graph');
axis([lowerRangeX-1 upperRangeX+1 lowerRangeY-1 upperRangeY+1]);
grid on;
% imshow(uint8(pixeliZedScratchPad), []);

plotIndex = plotIndex + 1;
subplot(plotRowSize,plotColSize, plotIndex);
imshow(pixeliZedScratchPad_reconstructed, []);
title('Image constructed from graph coordinates');

B9
以上是关于基于matlab从图形坐标转换图像的主要内容,如果未能解决你的问题,请参考以下文章