Elastic:使用 Elastic Stack 进行异常值检测 - airbnb 数据分析
Posted Elastic 中国社区官方博客
tags:
篇首语:本文由小常识网(cha138.com)小编为大家整理,主要介绍了Elastic:使用 Elastic Stack 进行异常值检测 - airbnb 数据分析相关的知识,希望对你有一定的参考价值。
在我之前的文章 “Elasticsearch:使用 Elastic 机器学习进行 data frame 分析” 里,我详细地讲述了如何使用 data frame Analysis 来分析数据的异常。在今天的展示中,我将使用另外一个案例来进行展示。我将使用 airbnb 的真实数据来分析异常。Elastic Stack 的机器学习为我们分析数据更加方便和有效。它提供了一个从端到端的可操作的机器学习全过程。

在今天的展示中,我将使用 Elastic Stack 8.0 来进行展示。
准备工作
安装 Elasticsearch 及 Kibana
你首先需要按照好 Elasticsearch 及 Kibana,并启动白金版试用。在今天的文章中,我就不详细描述这个了。请参阅我之前的文章 “Elasticsearch:使用 Elastic 机器学习进行 data frame 分析”。这里就不再赘述了。
准备数据
我们今天地址下载你所感兴趣的一个地点的 airbnb 的数据。在今天的练习中,我将下载 Amsterdam 的数据。我们下载后的数据为 listings.csv.gz。经过解压后的文件为 listings.csv。在把数据摄入到 Elasticsearch 之前,我们可以使用 Python 来把数据预处理一下。针对 Elasticsearch 不同的版本,我们使用如下不同的代码:
airbnb7.py - 针对 Elastic Stack 7.x
import pandas as pd
import numpy as np
import json
import csv
from elasticsearch import helpers, Elasticsearch
import requests
import re
import os

df = pd.read_csv("listings.csv")
df.head()

df = df[["id",
    "host_id",
    "accommodates",
    "availability_365",
    "neighbourhood_cleansed",
    "latitude",
    "listing_url",
    "longitude",
    "property_type",
    "room_type",
    "bathrooms",
    "bedrooms",
    "price",
    "number_of_reviews",
    "review_scores_rating",
    "host_since",
    "first_review",
    "host_acceptance_rate"]]

# If bedrooms and bathrooms are not numbers NaN, set them to 1
df["bedrooms"].replace(np.nan, 1, inplace=True)
df["bathrooms"].replace(np.nan, 1, inplace=True)
#df["bathrooms"].replace(0, 1, inplace=True)
df['review_scores_rating'].replace(np.nan, 0, inplace=True)
df['first_review'].replace(np.nan, "1970-01-01", inplace=True)

# Get those records with a valid  host_since value
df = df.dropna(subset=['host_since'])

# Cleaning the price field and changeing its type to float
reg = "\\$([0-9]*)(\\.|\\,)1,1.*"
df["price"] = df["price"].apply(lambda x: re.search(reg, x).group(1))
df["price"] = df["price"].astype("float")

# Remove % character
df['host_acceptance_rate'].replace(np.nan, "0%", inplace=True)
df['host_acceptance_rate'] = df['host_acceptance_rate'].str.replace('%','').astype('float')

print(f"Number of listings: len(df)")
print(f"Number of hosts: len(df.groupby('host_id'))")

# entire_place = df[(df["room_type"]=="Entire home/apt")]
# entire_place = entire_place.drop('room_type', axis=1)

# print(f"Number of listings: len(entire_place)")
# print(f"Number of hosts: len(entire_place.groupby('host_id'))")

# print(f"Number of unique neighbourhood: len(entire_place['neighbourhood_cleansed'].unique())")

cleaned_file = f"cleaned_listings.csv"
df.to_csv(cleaned_file, header=False, index=False)

mappings =
    "settings":
        "number_of_shards" : 1,
        "default_pipeline": "timestamp_pipeline"
    ,
    "properties" :
        "listing_id" : "type" : "keyword",
        "host_id" : "type" : "keyword",
        "listing_url" : "type" : "keyword",
        "number_of_reviews" : "type" : "integer",
        "accommodates" : "type" : "integer",
        "availability_365" : "type" : "integer",
        "location": "type" : "geo_point",
        "property_type" : "type" : "keyword",
        "room_type" : "type" : "keyword",
        "bedrooms" : "type" : "float",
        "price" : "type" : "float",
        "number_of_reviews" : "type" : "integer",
        "review_scores_rating" : "type" : "float",
        "host_since" : "type" : "date",
        "first_review" : "type" : "date",
        "host_acceptance_rate" : "type" : "float",
        "neighbourhood" : "type" : "keyword",
        "@timestamp" : "type": "date"


INDEX_NAME = 'airbnb'

def yield_data():
    for rec in df.to_dict("records"):
        rec["location"] = "lat": rec["latitude"], "lon": rec["longitude"]
        del rec["latitude"]; del rec["longitude"]
        yield
            "_index": INDEX_NAME,
            "_source": rec


es = Elasticsearch(['host': 'localhost', 'port': 9200, 'http_auth':('elastic', 'password')])

timestamp_pipeline_setting =
    "description": "set a timestamp field for all documents",
    "processors": [

            "set":
                "field": "@timestamp",
                "value": "_ingest.timestamp"


    ]


es.ingest.put_pipeline("timestamp_pipeline", timestamp_pipeline_setting)

es.indices.delete(index=INDEX_NAME, ignore=[400, 404])  # to reset
es.indices.create(index=INDEX_NAME, mappings=mappings, settings=settings)

helpers.bulk(es, yield_data())
airbnb8.py - 针对 Elastic Stack 8.x
import pandas as pd
import numpy as np
import json
import csv
from elasticsearch import helpers, Elasticsearch
import requests
import re
import os

df = pd.read_csv("listings.csv")
df.head()

df = df[["id",
    "host_id",
    "accommodates",
    "availability_365",
    "neighbourhood_cleansed",
    "latitude",
    "listing_url",
    "longitude",
    "property_type",
    "room_type",
    "bathrooms",
    "bedrooms",
    "price",
    "number_of_reviews",
    "review_scores_rating",
    "host_since",
    "first_review",
    "host_acceptance_rate"]]

# If bedrooms and bathrooms are not numbers NaN, set them to 1
df["bedrooms"].replace(np.nan, 1, inplace=True)
df["bathrooms"].replace(np.nan, 1, inplace=True)
#df["bathrooms"].replace(0, 1, inplace=True)
df['review_scores_rating'].replace(np.nan, 0, inplace=True)
df['first_review'].replace(np.nan, "1970-01-01", inplace=True)

# Get those records with a valid  host_since value
df = df.dropna(subset=['host_since'])

# Cleaning the price field and changeing its type to float
reg = "\\$([0-9]*)(\\.|\\,)1,1.*"
df["price"] = df["price"].apply(lambda x: re.search(reg, x).group(1))
df["price"] = df["price"].astype("float")

# Remove % character
df['host_acceptance_rate'].replace(np.nan, "0%", inplace=True)
df['host_acceptance_rate'] = df['host_acceptance_rate'].str.replace('%','').astype('float')

print(f"Number of listings: len(df)")
print(f"Number of hosts: len(df.groupby('host_id'))")

# entire_place = df[(df["room_type"]=="Entire home/apt")]
# entire_place = entire_place.drop('room_type', axis=1)

# print(f"Number of listings: len(entire_place)")
# print(f"Number of hosts: len(entire_place.groupby('host_id'))")

# print(f"Number of unique neighbourhood: len(entire_place['neighbourhood_cleansed'].unique())")

cleaned_file = f"cleaned_listings.csv"
df.to_csv(cleaned_file, header=False, index=False)

mappings =
    "properties" :
        "listing_id" : "type" : "keyword",
        "host_id" : "type" : "keyword",
        "listing_url" : "type" : "keyword",
        "number_of_reviews" : "type" : "integer",
        "accommodates" : "type" : "integer",
        "availability_365" : "type" : "integer",
        "location": "type" : "geo_point",
        "property_type" : "type" : "keyword",
        "room_type" : "type" : "keyword",
        "bedrooms" : "type" : "float",
        "price" : "type" : "float",
        "number_of_reviews" : "type" : "integer",
        "review_scores_rating" : "type" : "float",
        "host_since" : "type" : "date",
        "first_review" : "type" : "date",
        "host_acceptance_rate" : "type" : "float",
        "neighbourhood" : "type" : "keyword",
        "@timestamp" : "type": "date"


settings =
        "number_of_shards" : 1,
        "default_pipeline": "timestamp_pipeline"


INDEX_NAME = 'airbnb'

def yield_data():
    for rec in df.to_dict("records"):
        rec["location"] = "lat": rec["latitude"], "lon": rec["longitude"]
        del rec["latitude"]; del rec["longitude"]
        yield
            "_index": INDEX_NAME,
            "_source": rec

es = Elasticsearch("https://elastic:nUAEv1jH79=Ik-j6ozf9@localhost:9200", verify_certs=False)

processors = [

            "set":
                "field": "@timestamp",
                "value": "_ingest.timestamp"


    ]

es.ingest.put_pipeline(id = "timestamp_pipeline", description = "set a timestamp field for all documents",
                       processors=processors)

es.indices.delete(index=INDEX_NAME, ignore=[400, 404])  # to reset
es.indices.create(index=INDEX_NAME, mappings=mappings, settings=settings)

helpers.bulk(es, yield_data())
针对上面的代码,有一下的解释:
- 我们需要在 listtings.csv 所在的目录下运行:python airbnb7.py 或者 python aribnb8.py
- 在连接 Elasticsearch 时,你需要根据自己的 Elasticsearch 的配置进行账号的配置。
- 在检查 bedrooms,bathrooms,review_scores_rating 及 first_review 时,如果它里面的值为 NaN (Not a Number),我们分别进行设置。
- 我们把清洗过的文件保存到 cleaned_listings.csv 文件中。你也可以使用 Kibana 里的导入工具进行手动摄入文档。
- 有关这些字段的详细说明,可以参考链接。
- 最后在 Kibana 中,摄入的索引名称为 airbnb
我们可以在 Kibana 中进行如下的查询:
GET airbnb/_count
  "count" : 5597,
  "_shards" :
    "total" : 1,
    "successful" : 1,
    "skipped" : 0,
    "failed" : 0
上面显示我们共有5597个数据。
我们接下来为 airbnb 创建 data views:
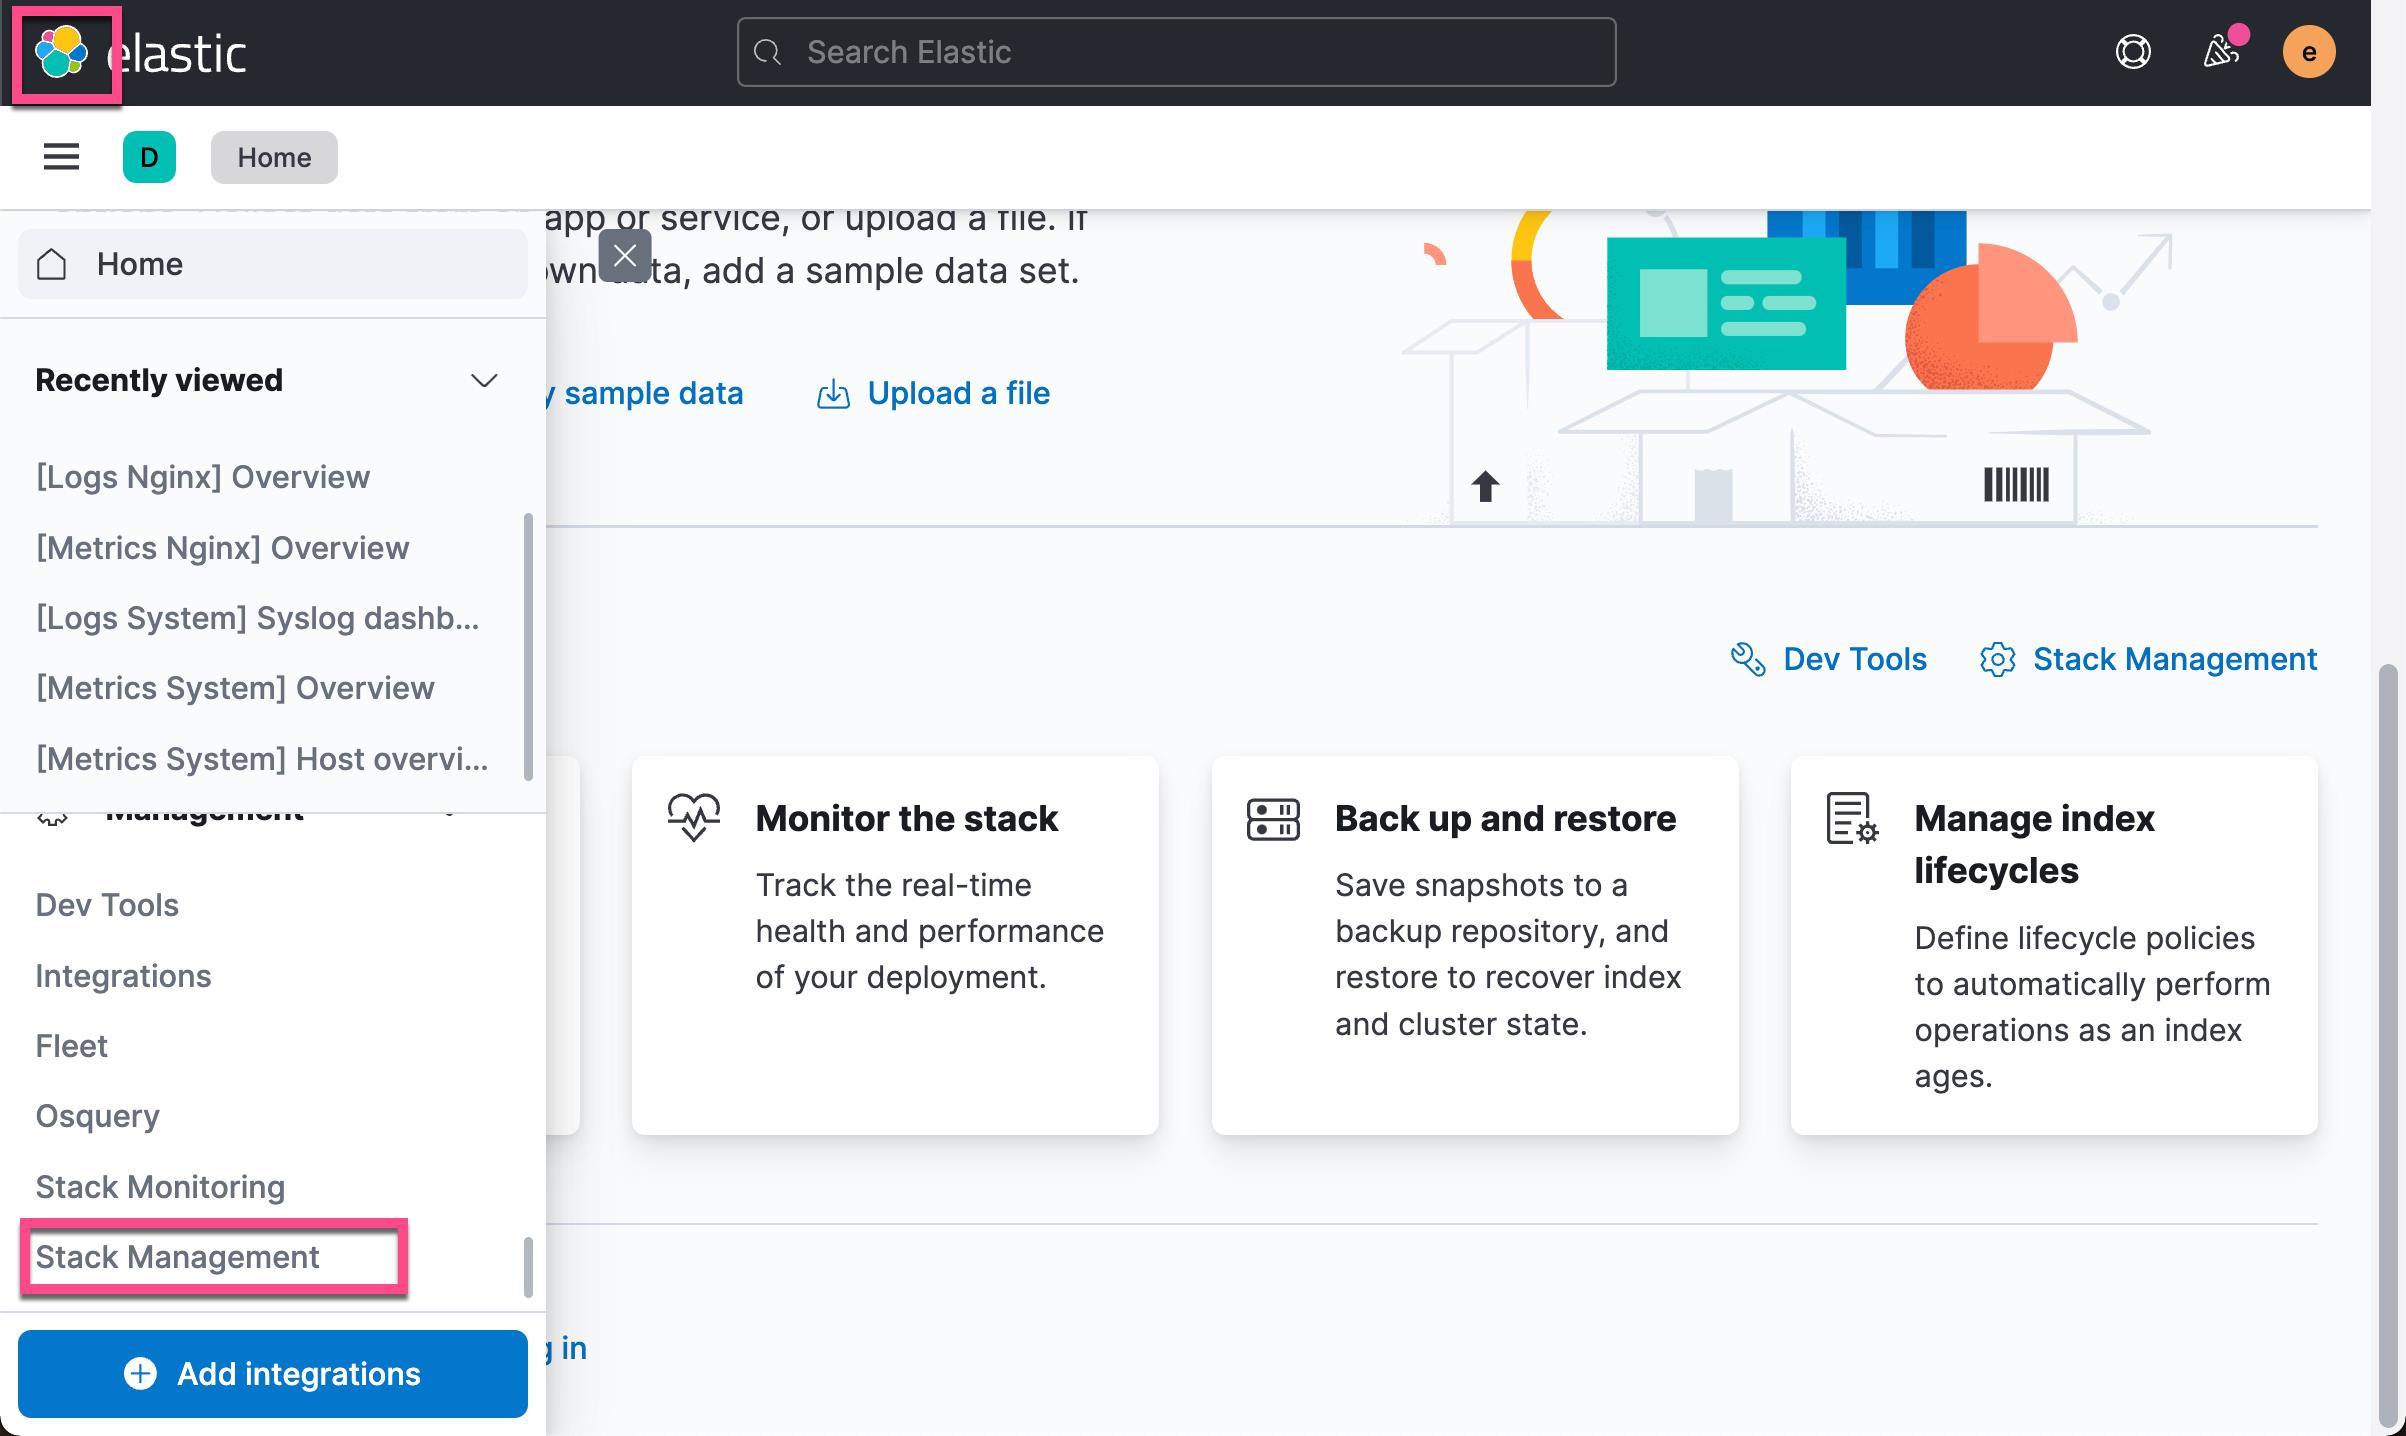
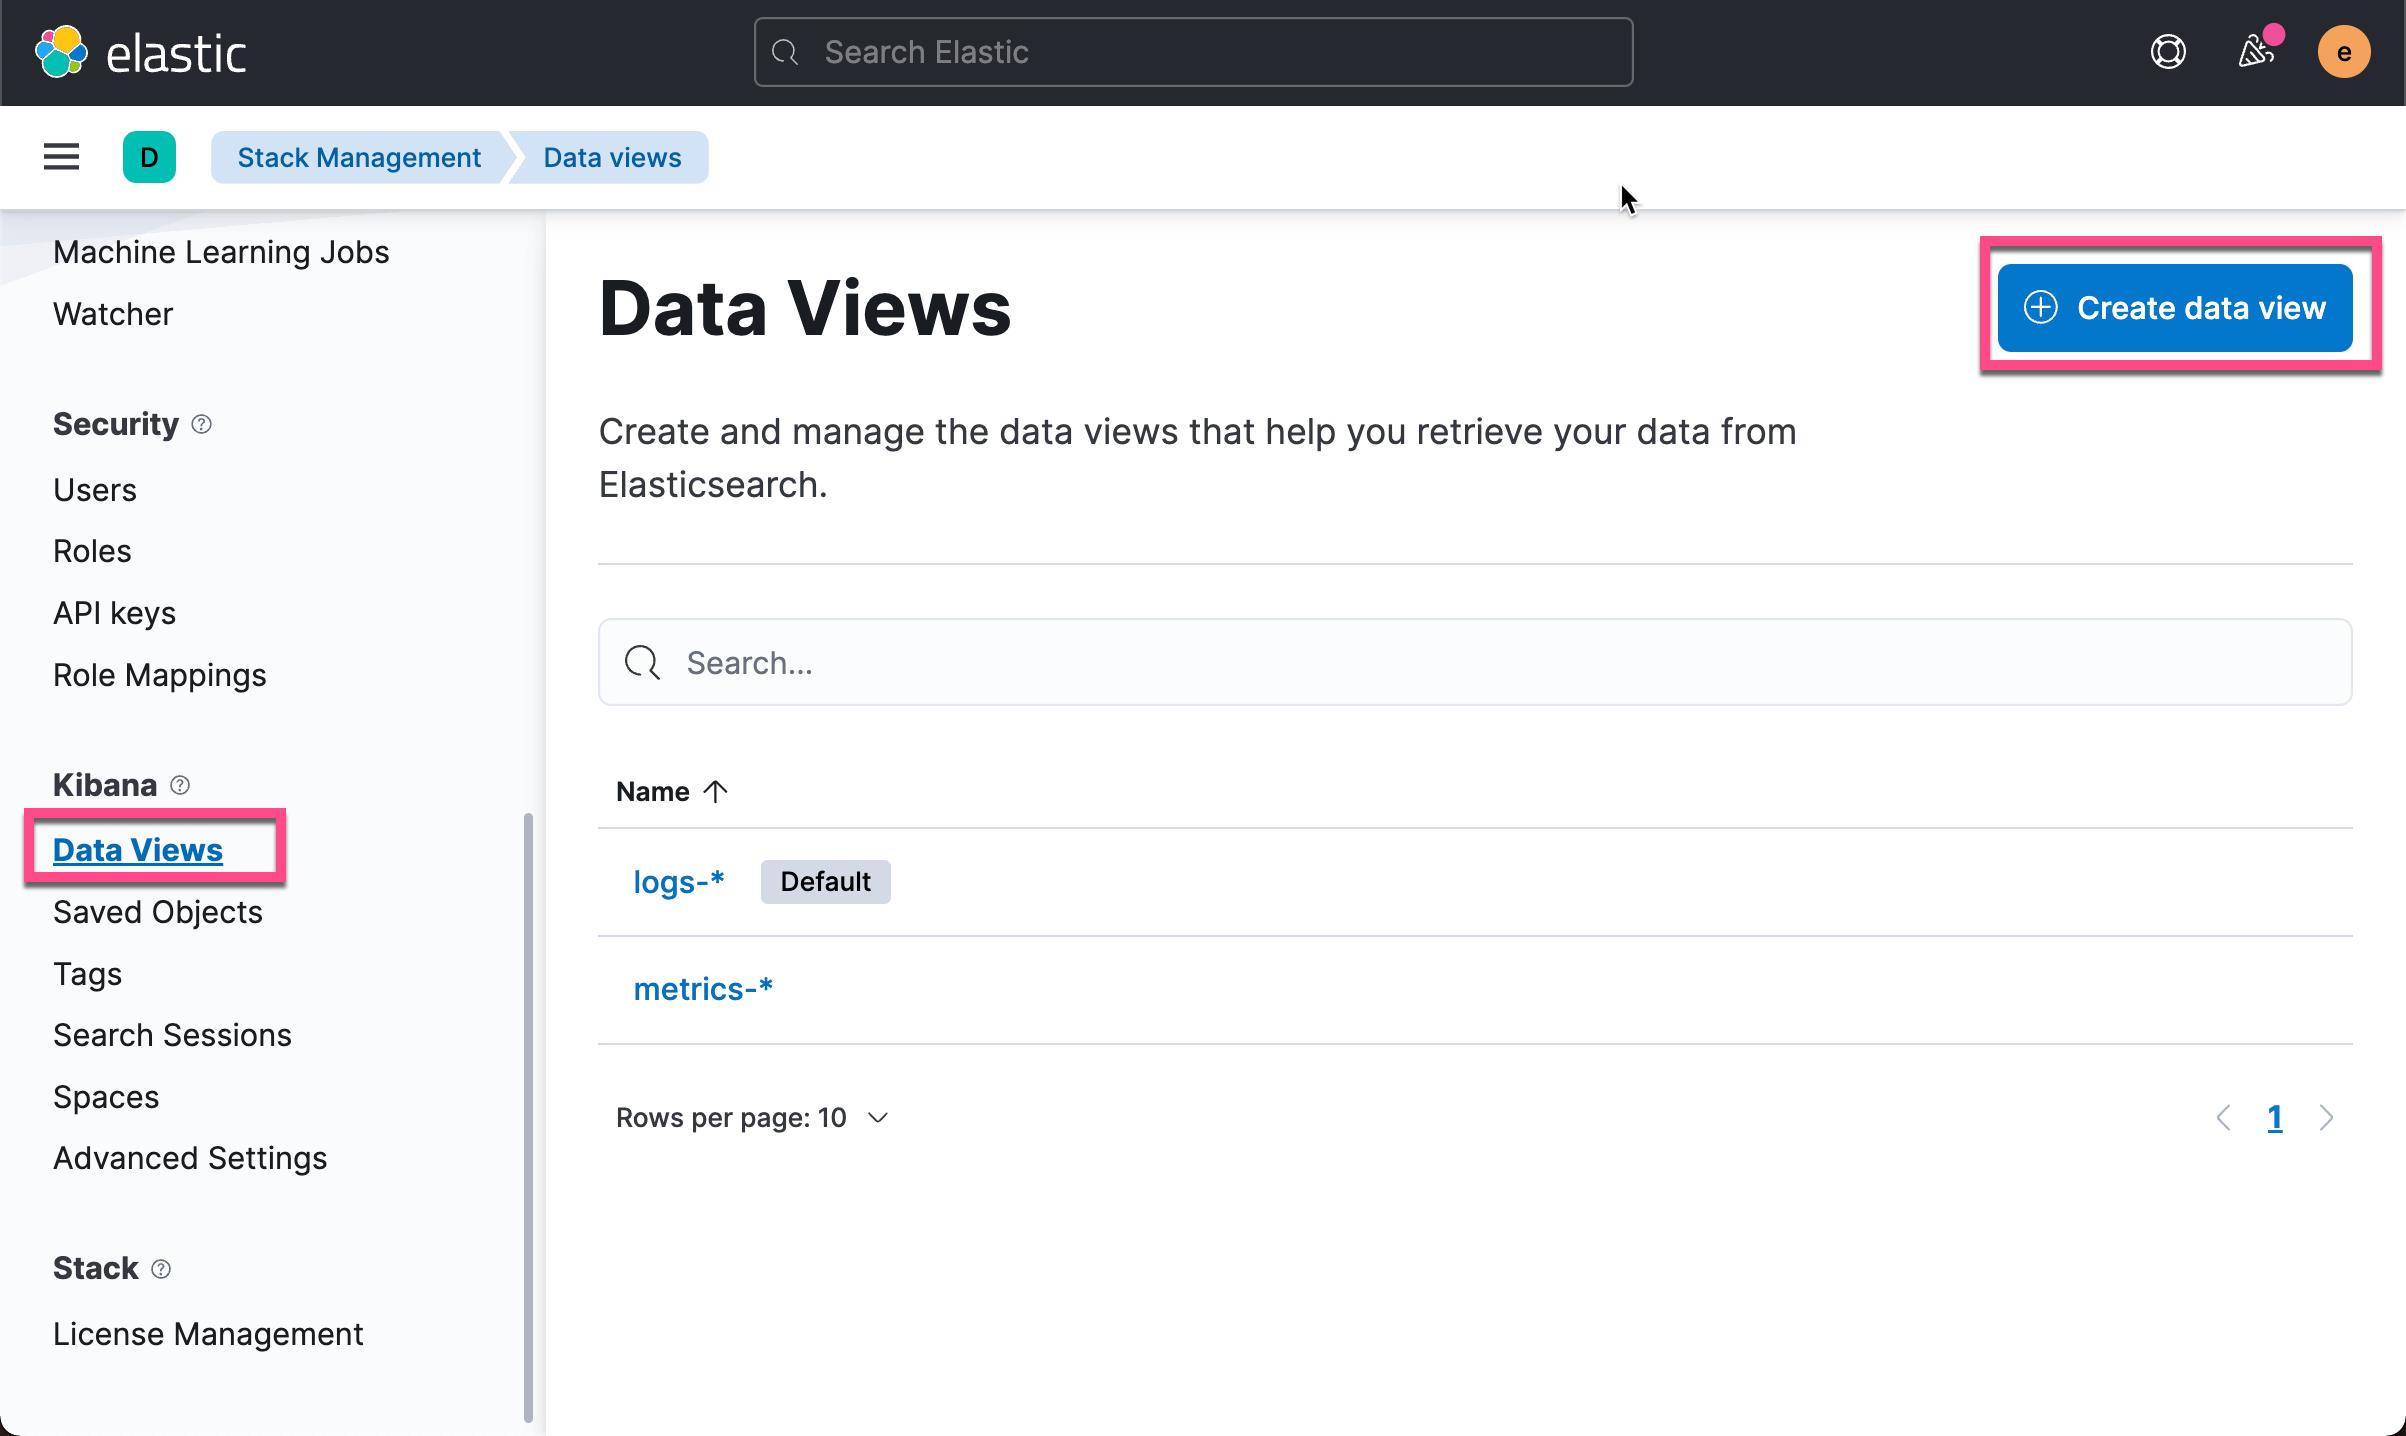
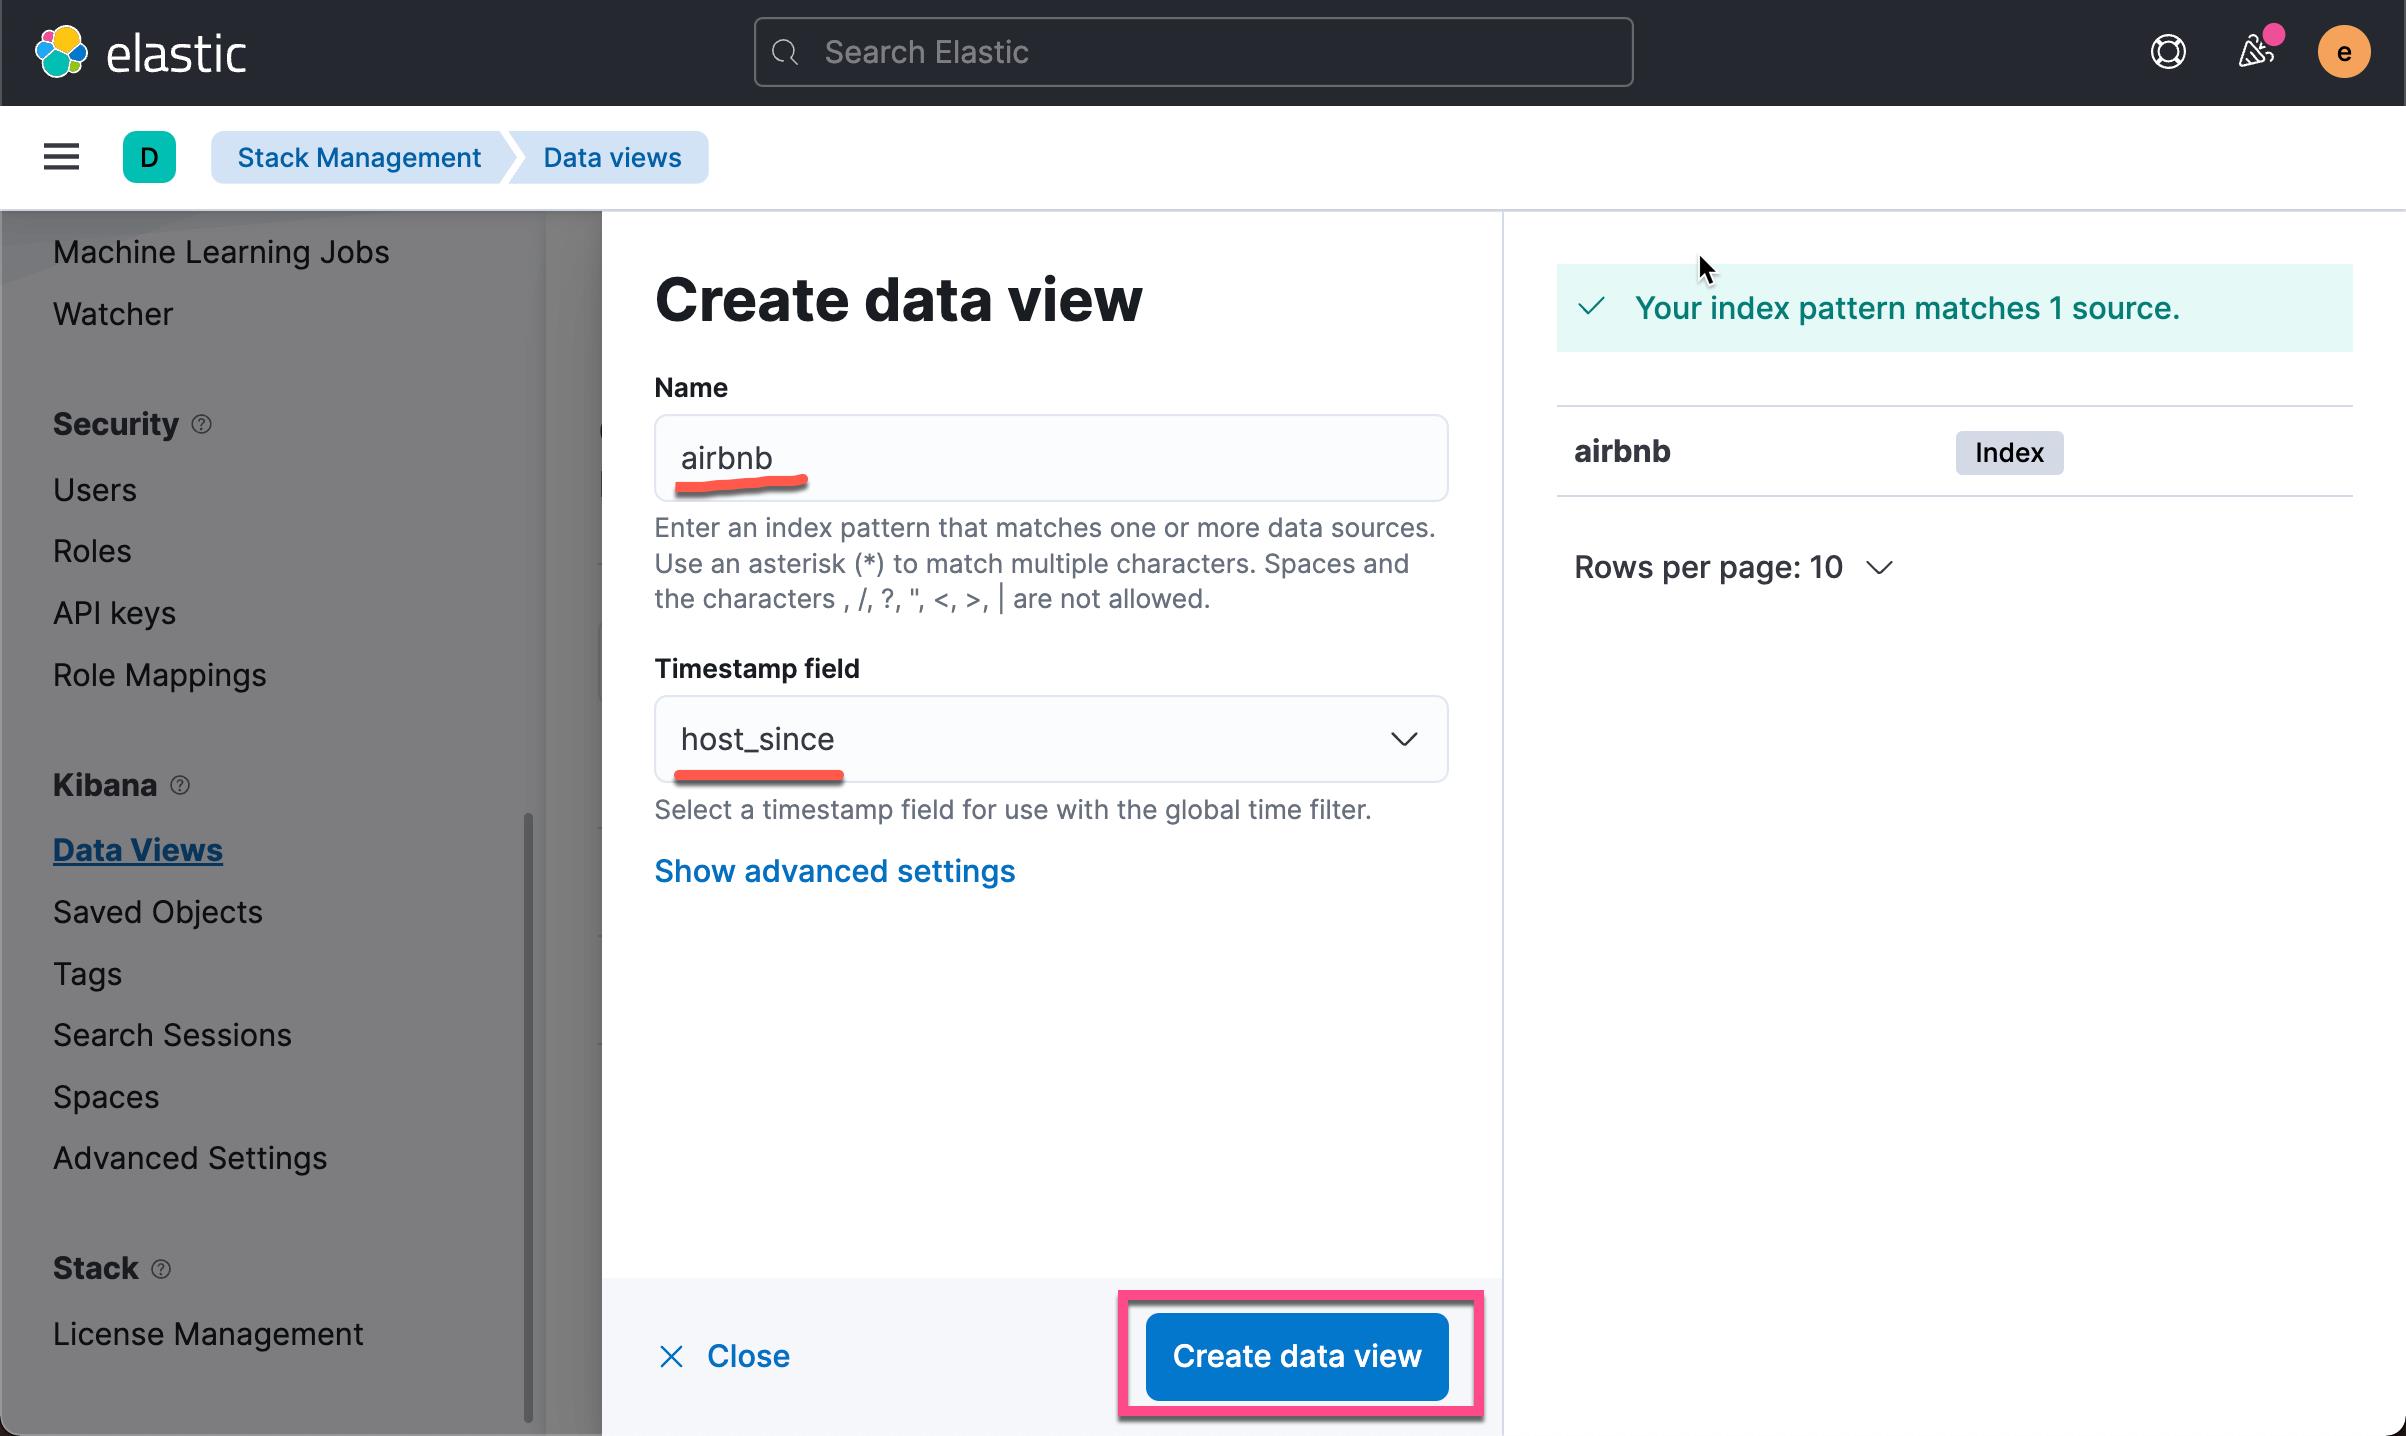
在上面,我们选项 host_since (成为 host 的时间)作为它的 timestamp,而不 @timestamp。这是因为 @timestamp 里的时间是数据摄入的时间。基本上是在1分钟之内发生的事。点击上面的 Create data view:
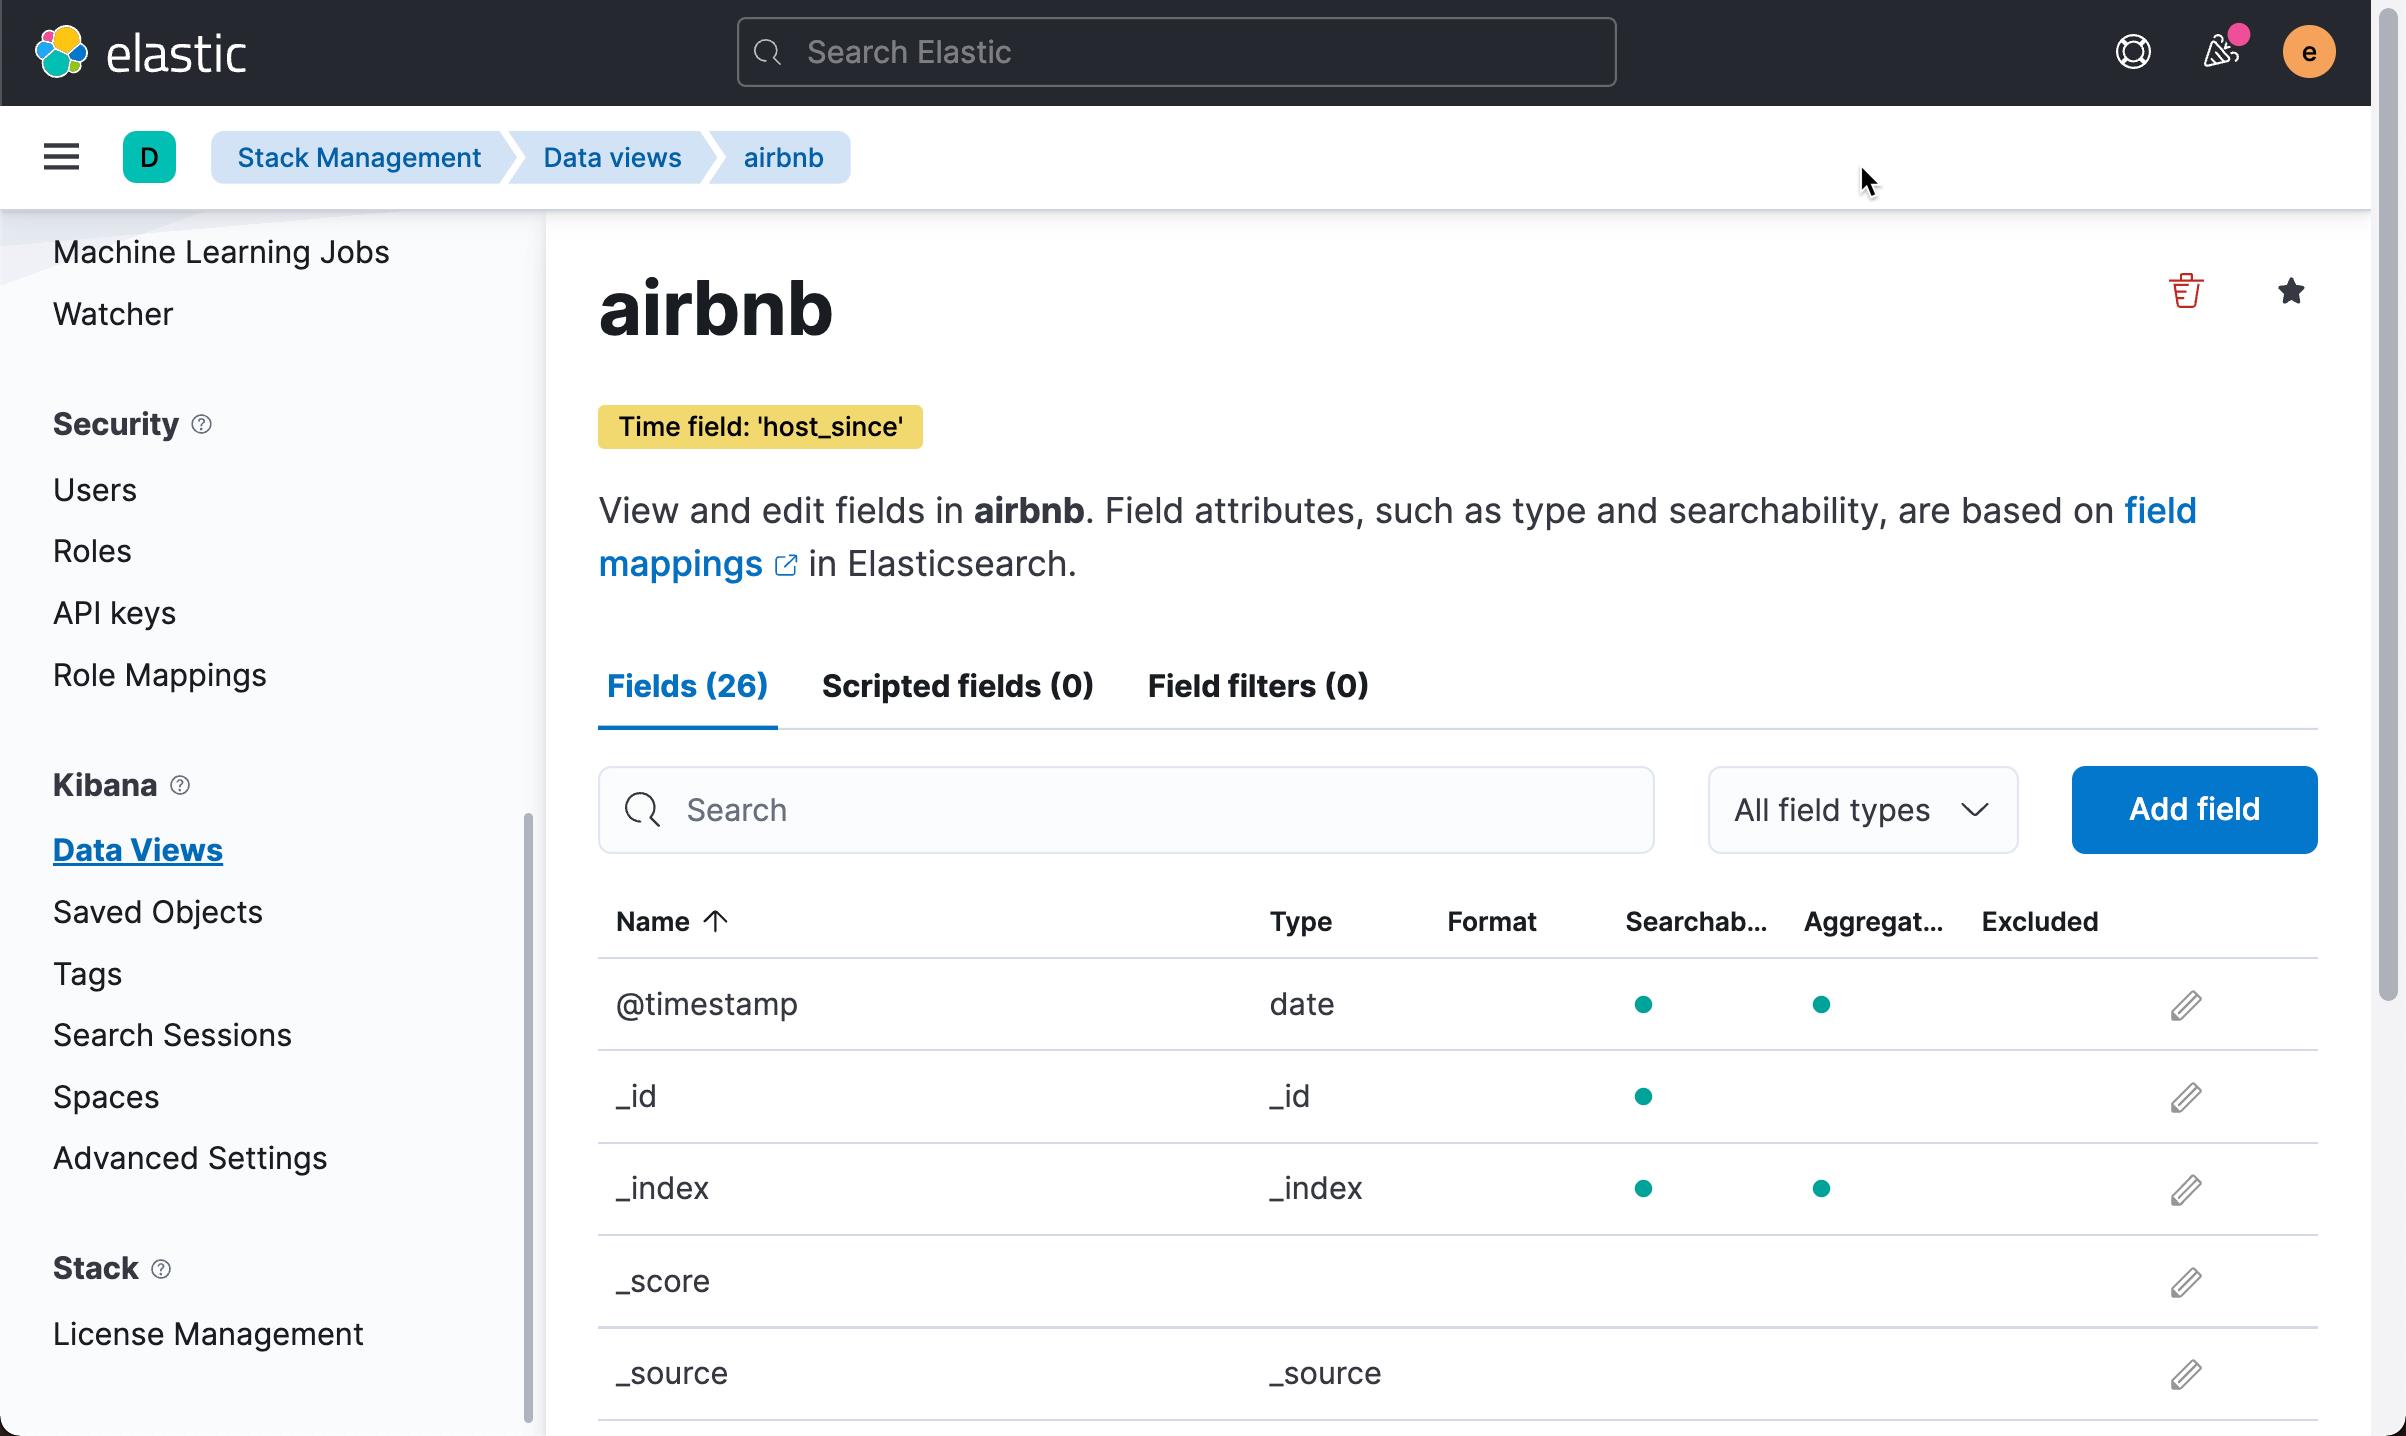
这样,我们就创建了一个叫做 airbnb 的 data view。
我们接下来去 Discover 里进行查看:
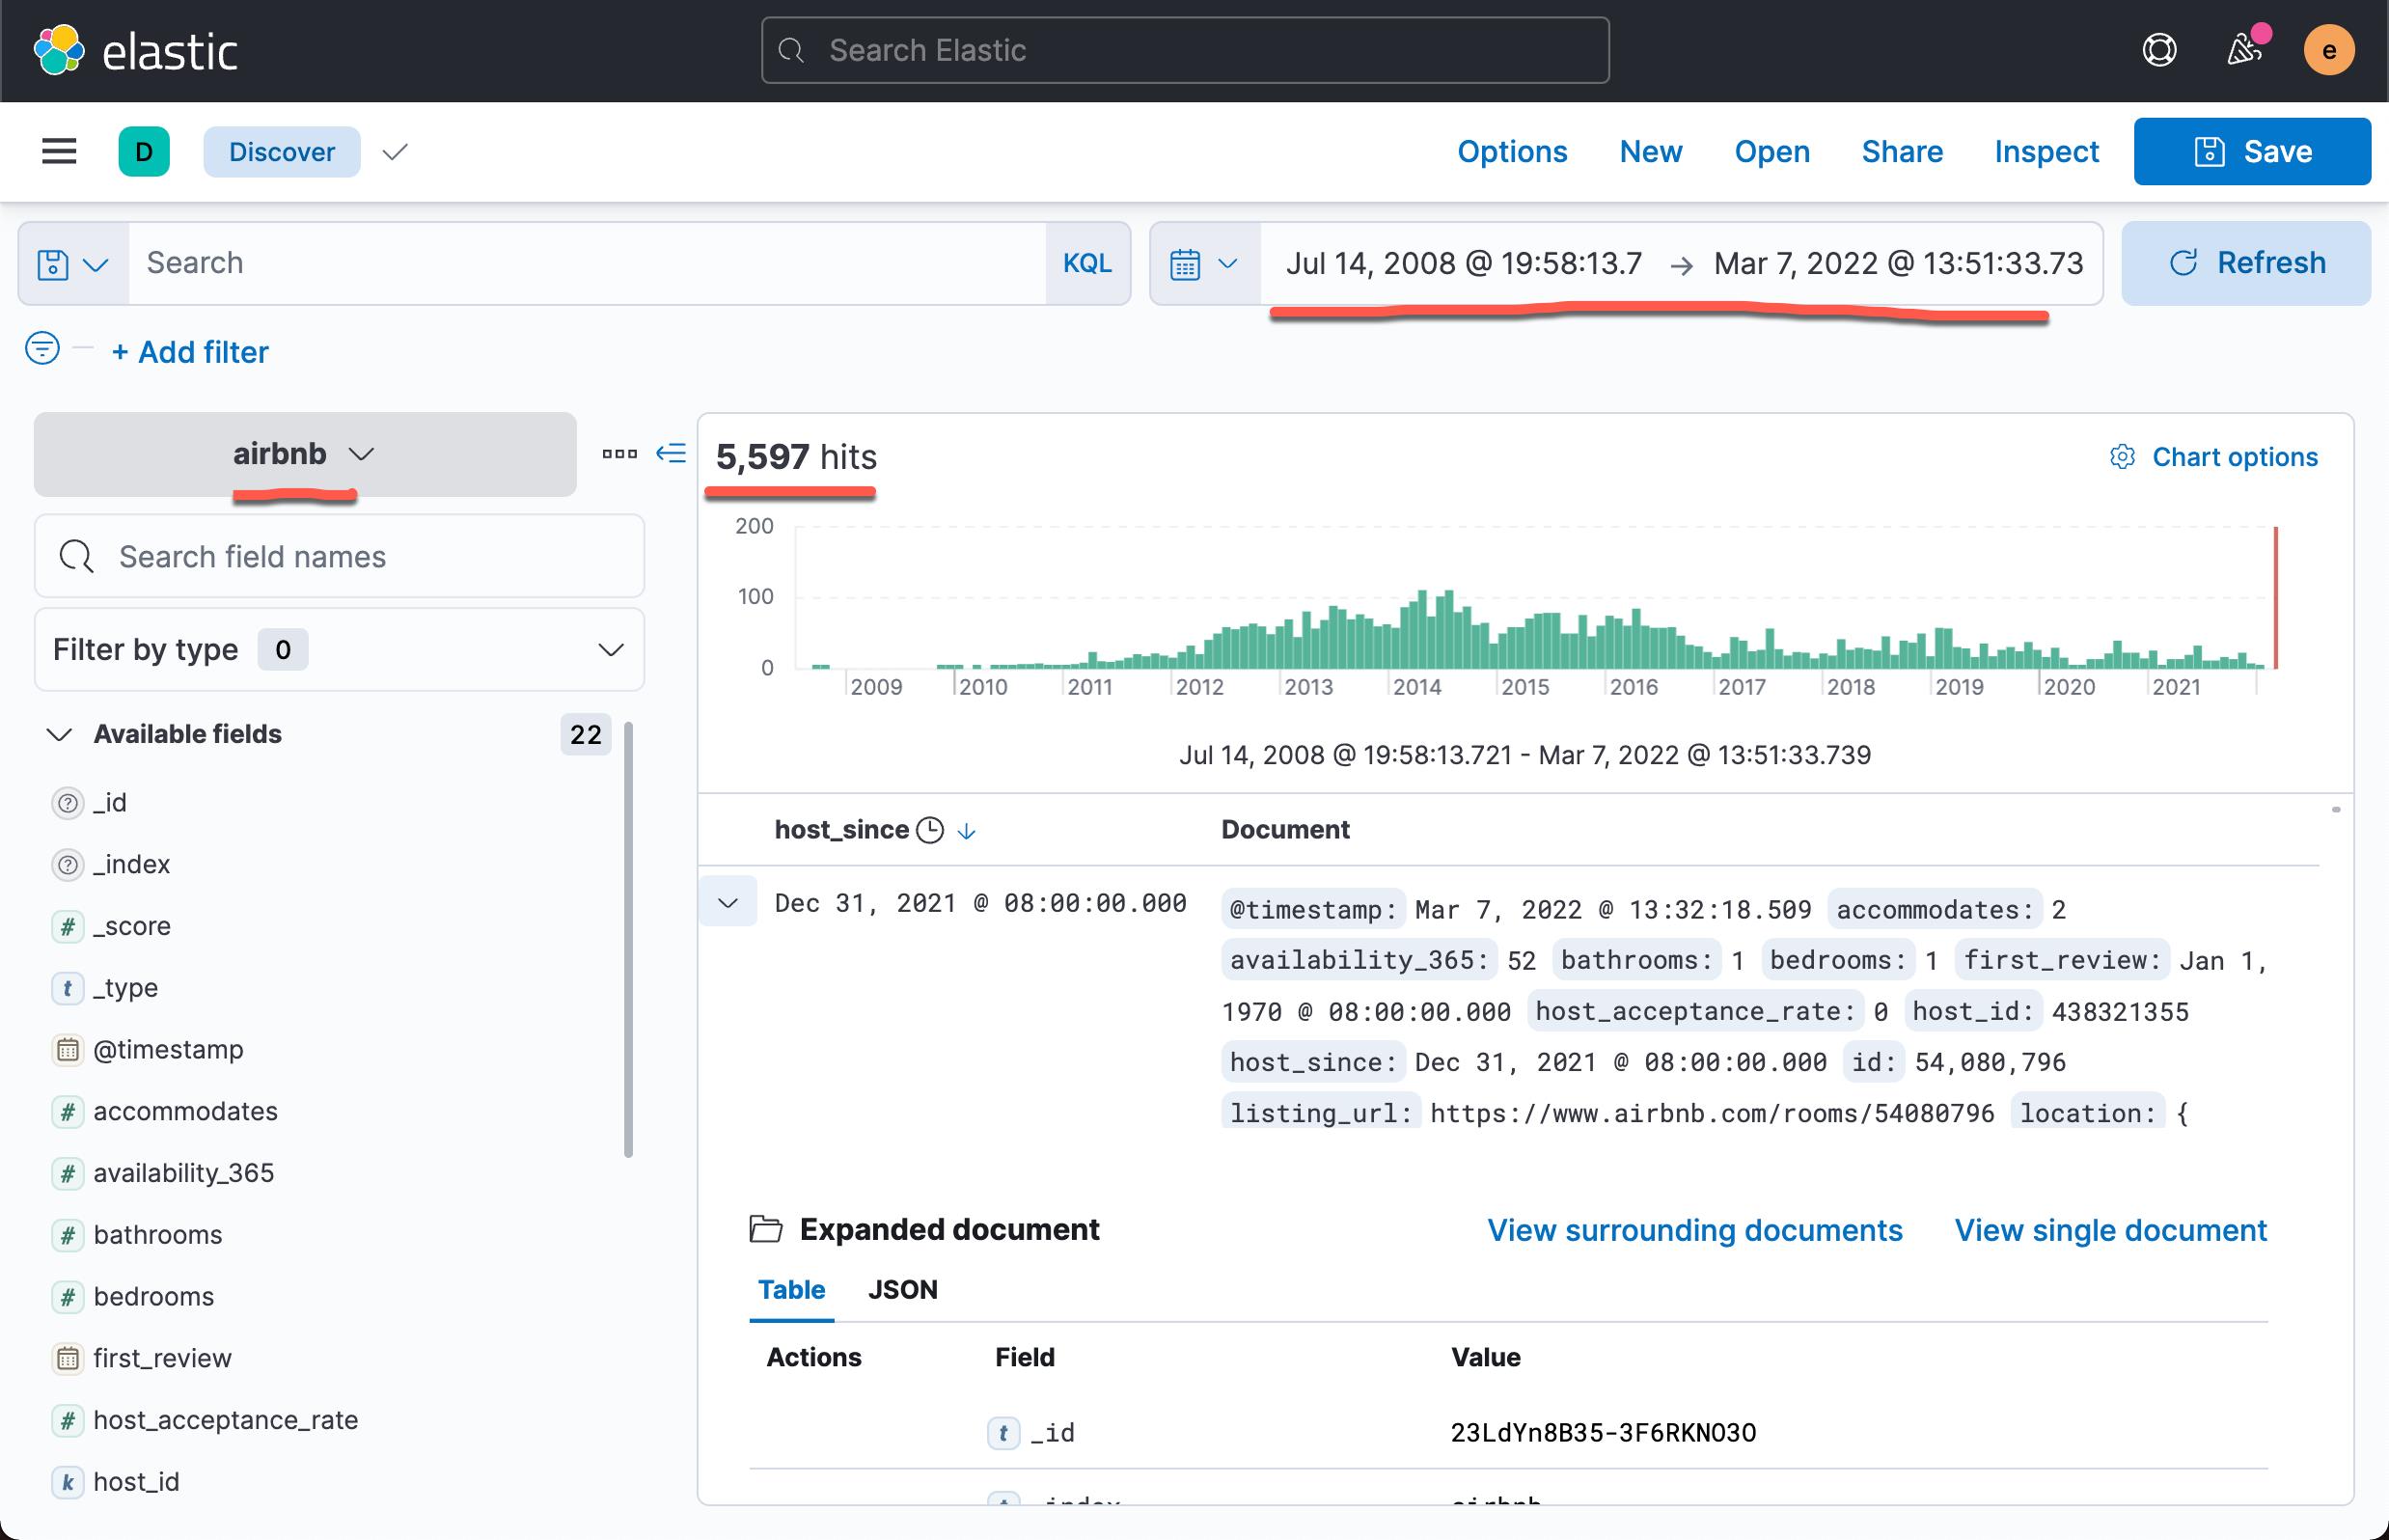
在过去的 14 年里,我可以看到所有的 5597 个文档。 我们可以查看到它所有的字段:
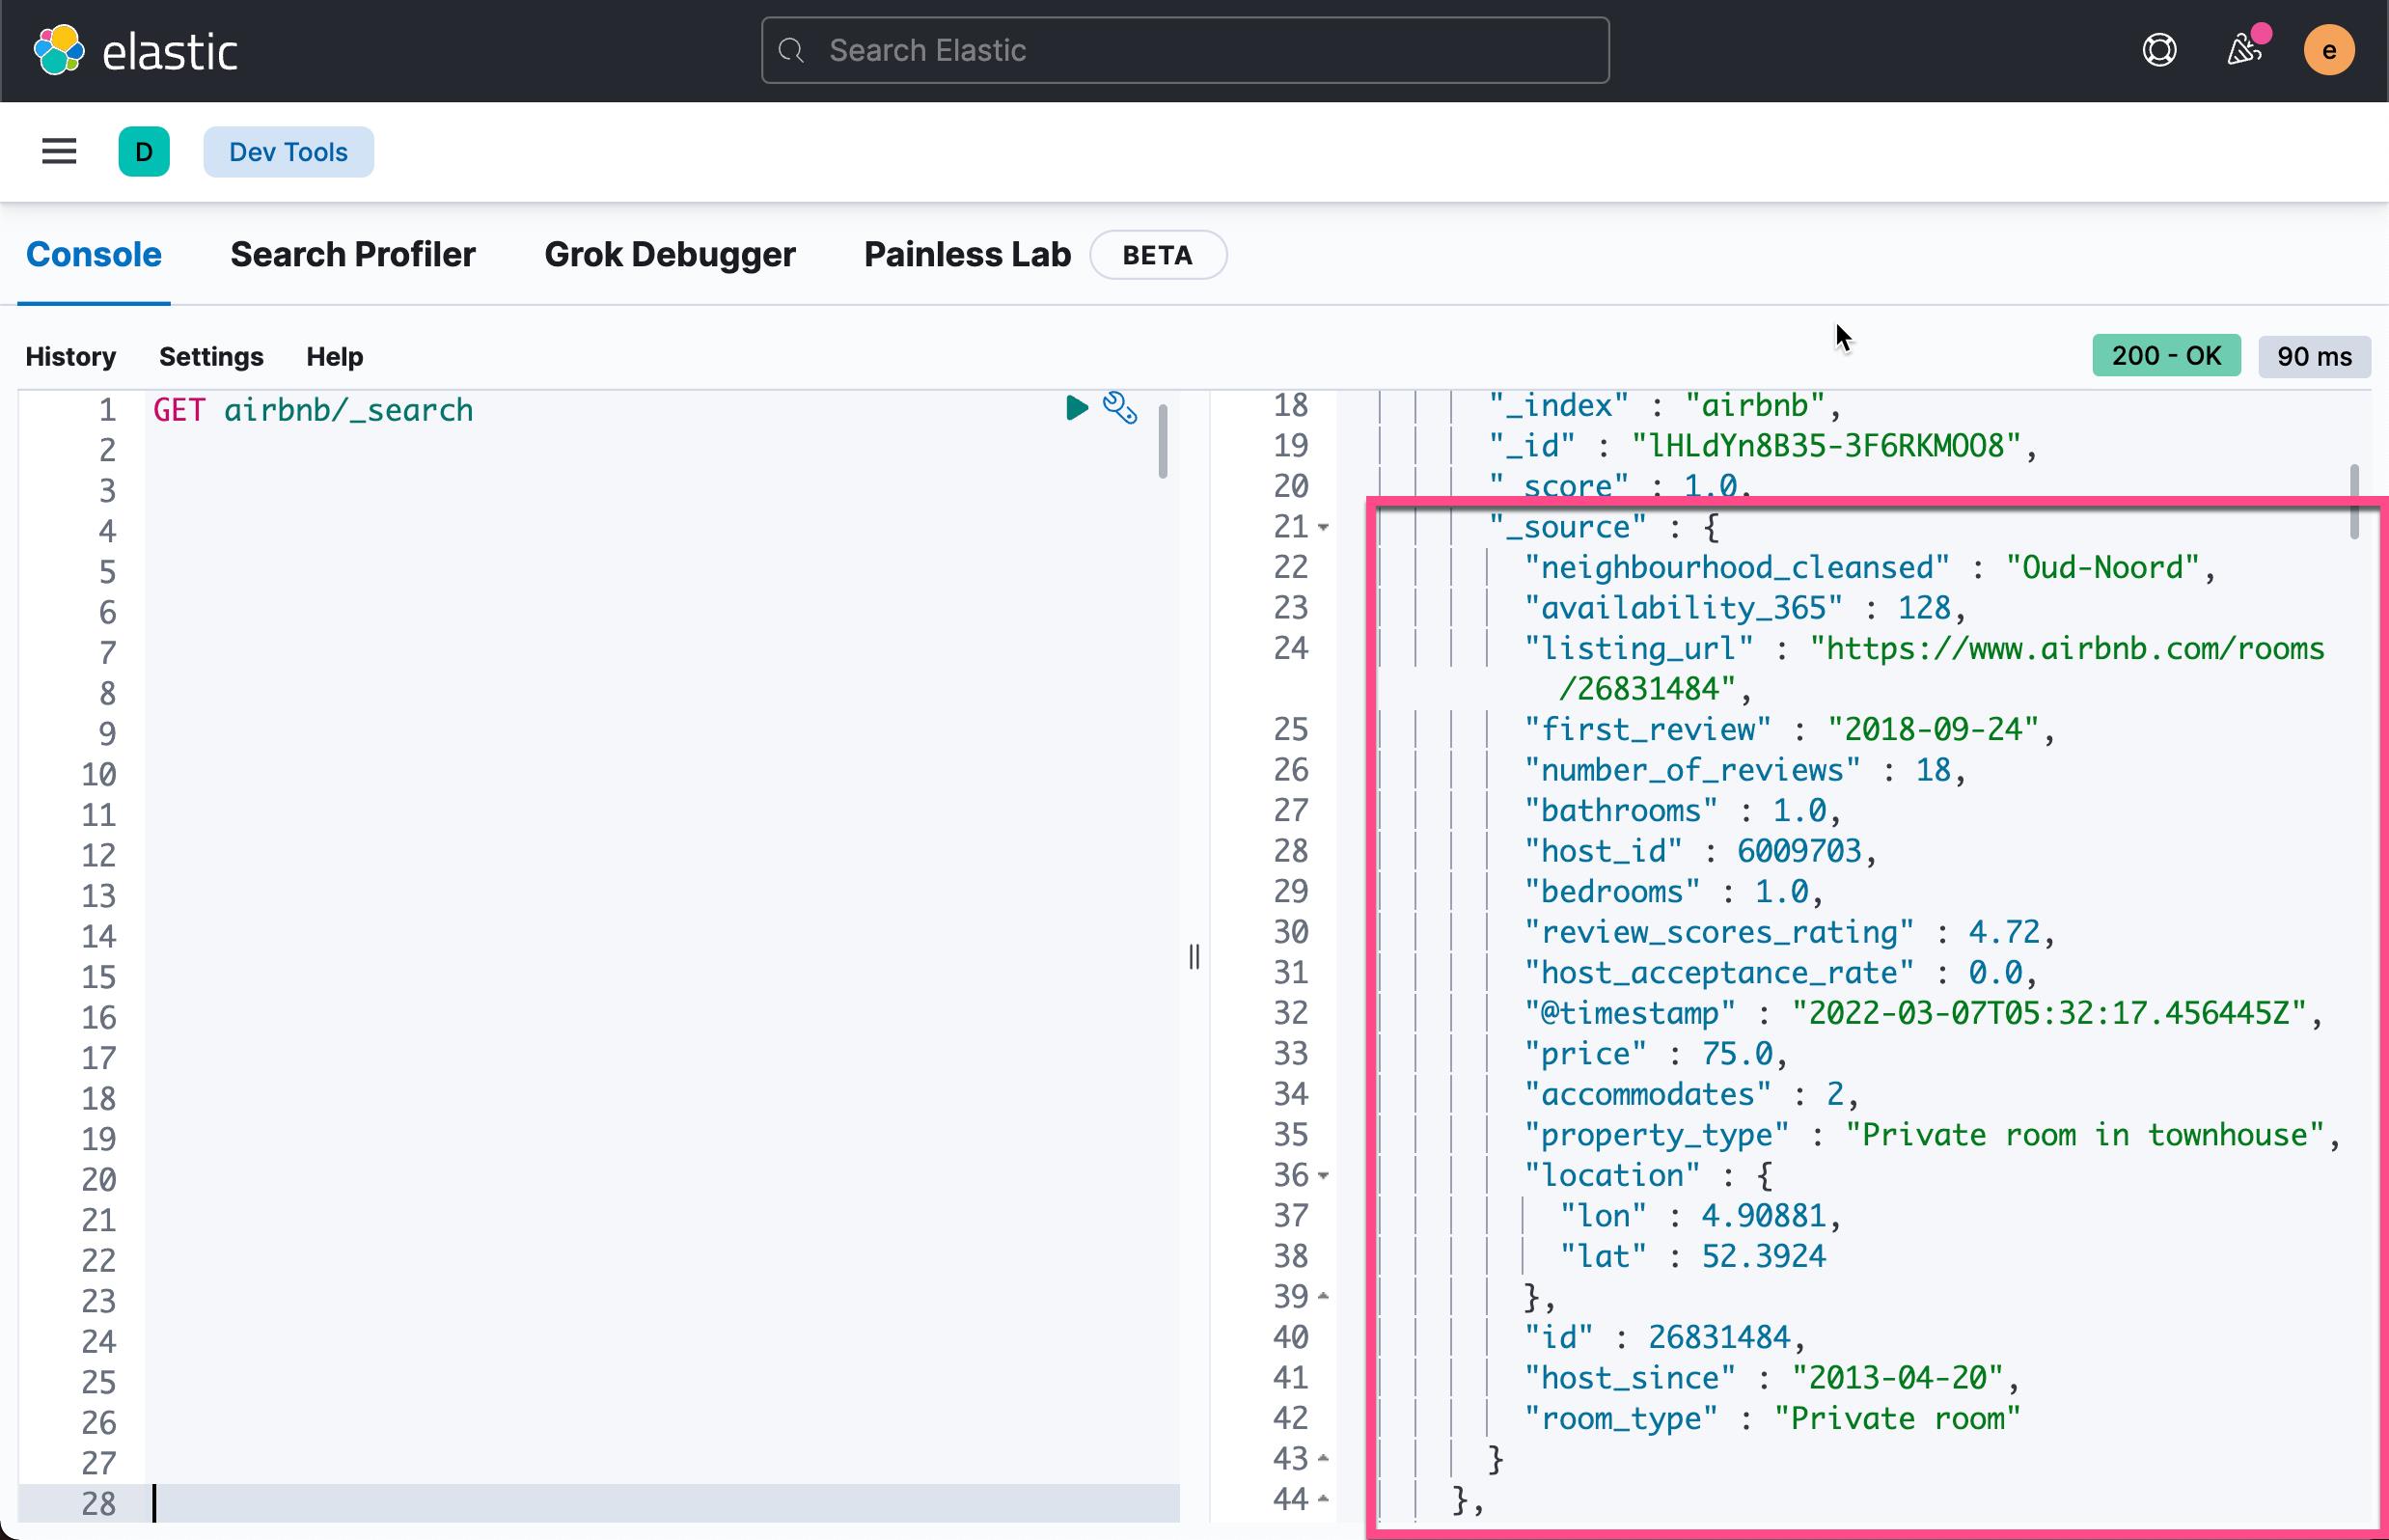
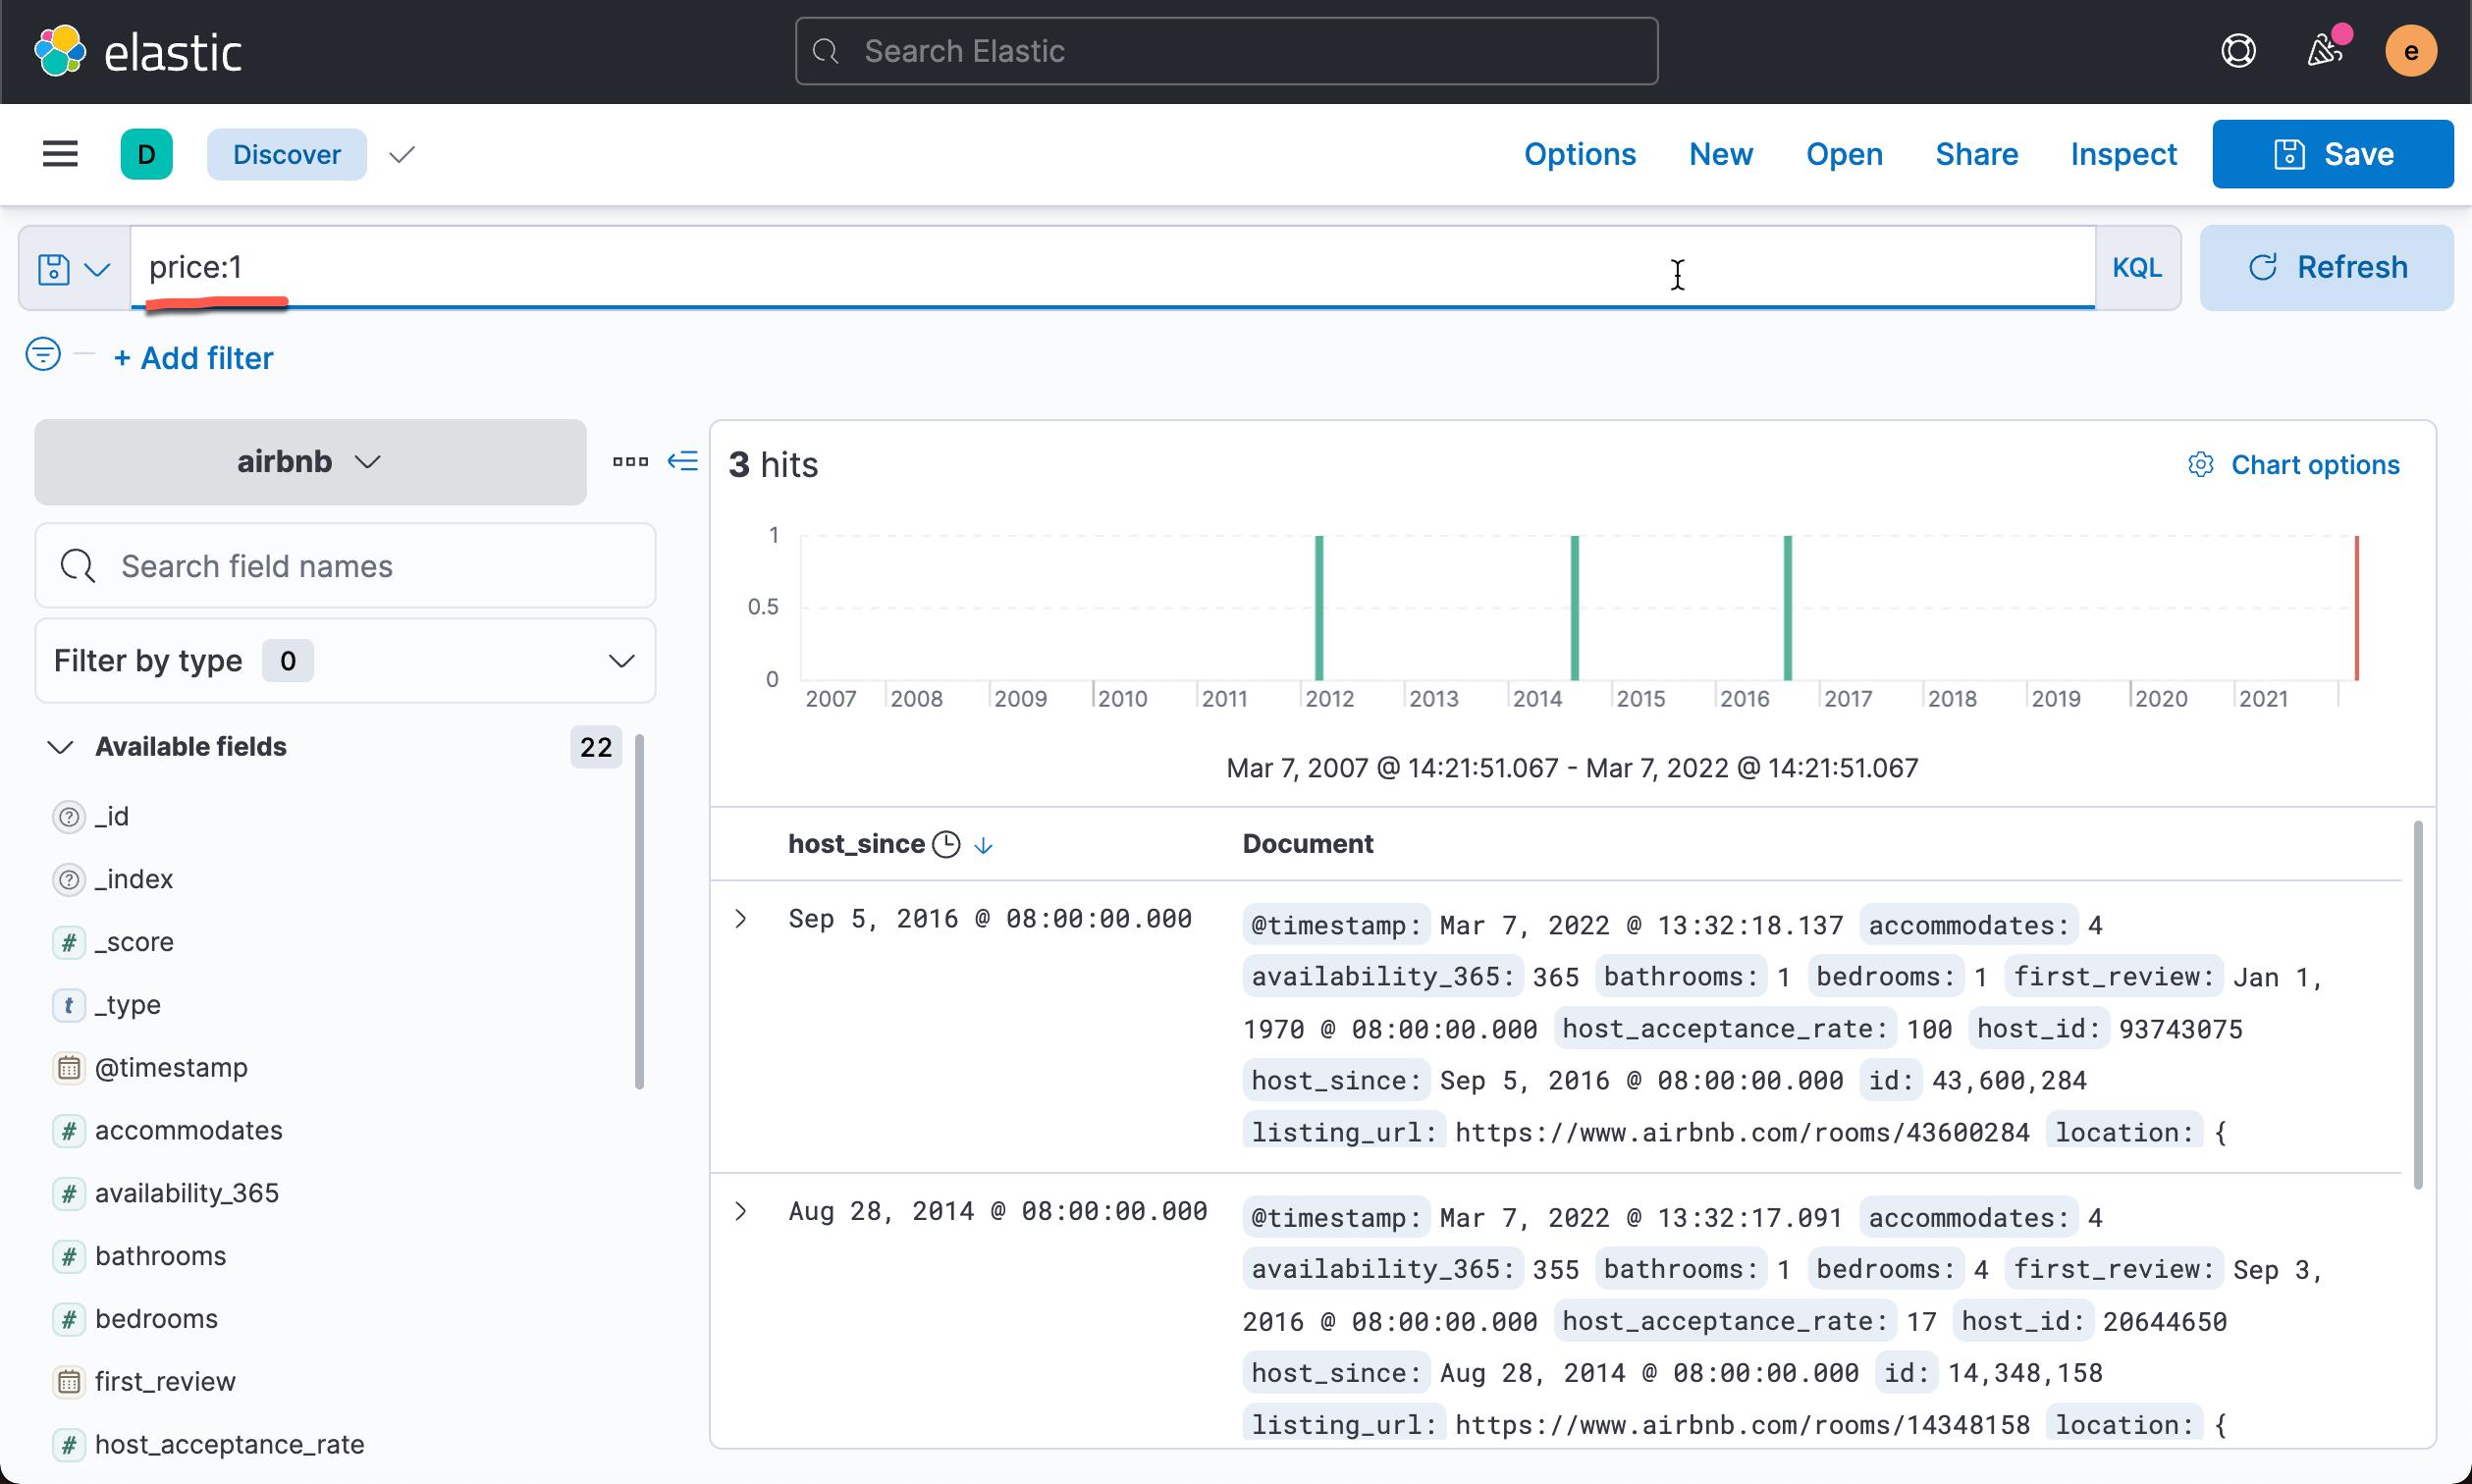
我们尝试针对其中的一个 host_id 进行搜索:

数据分析
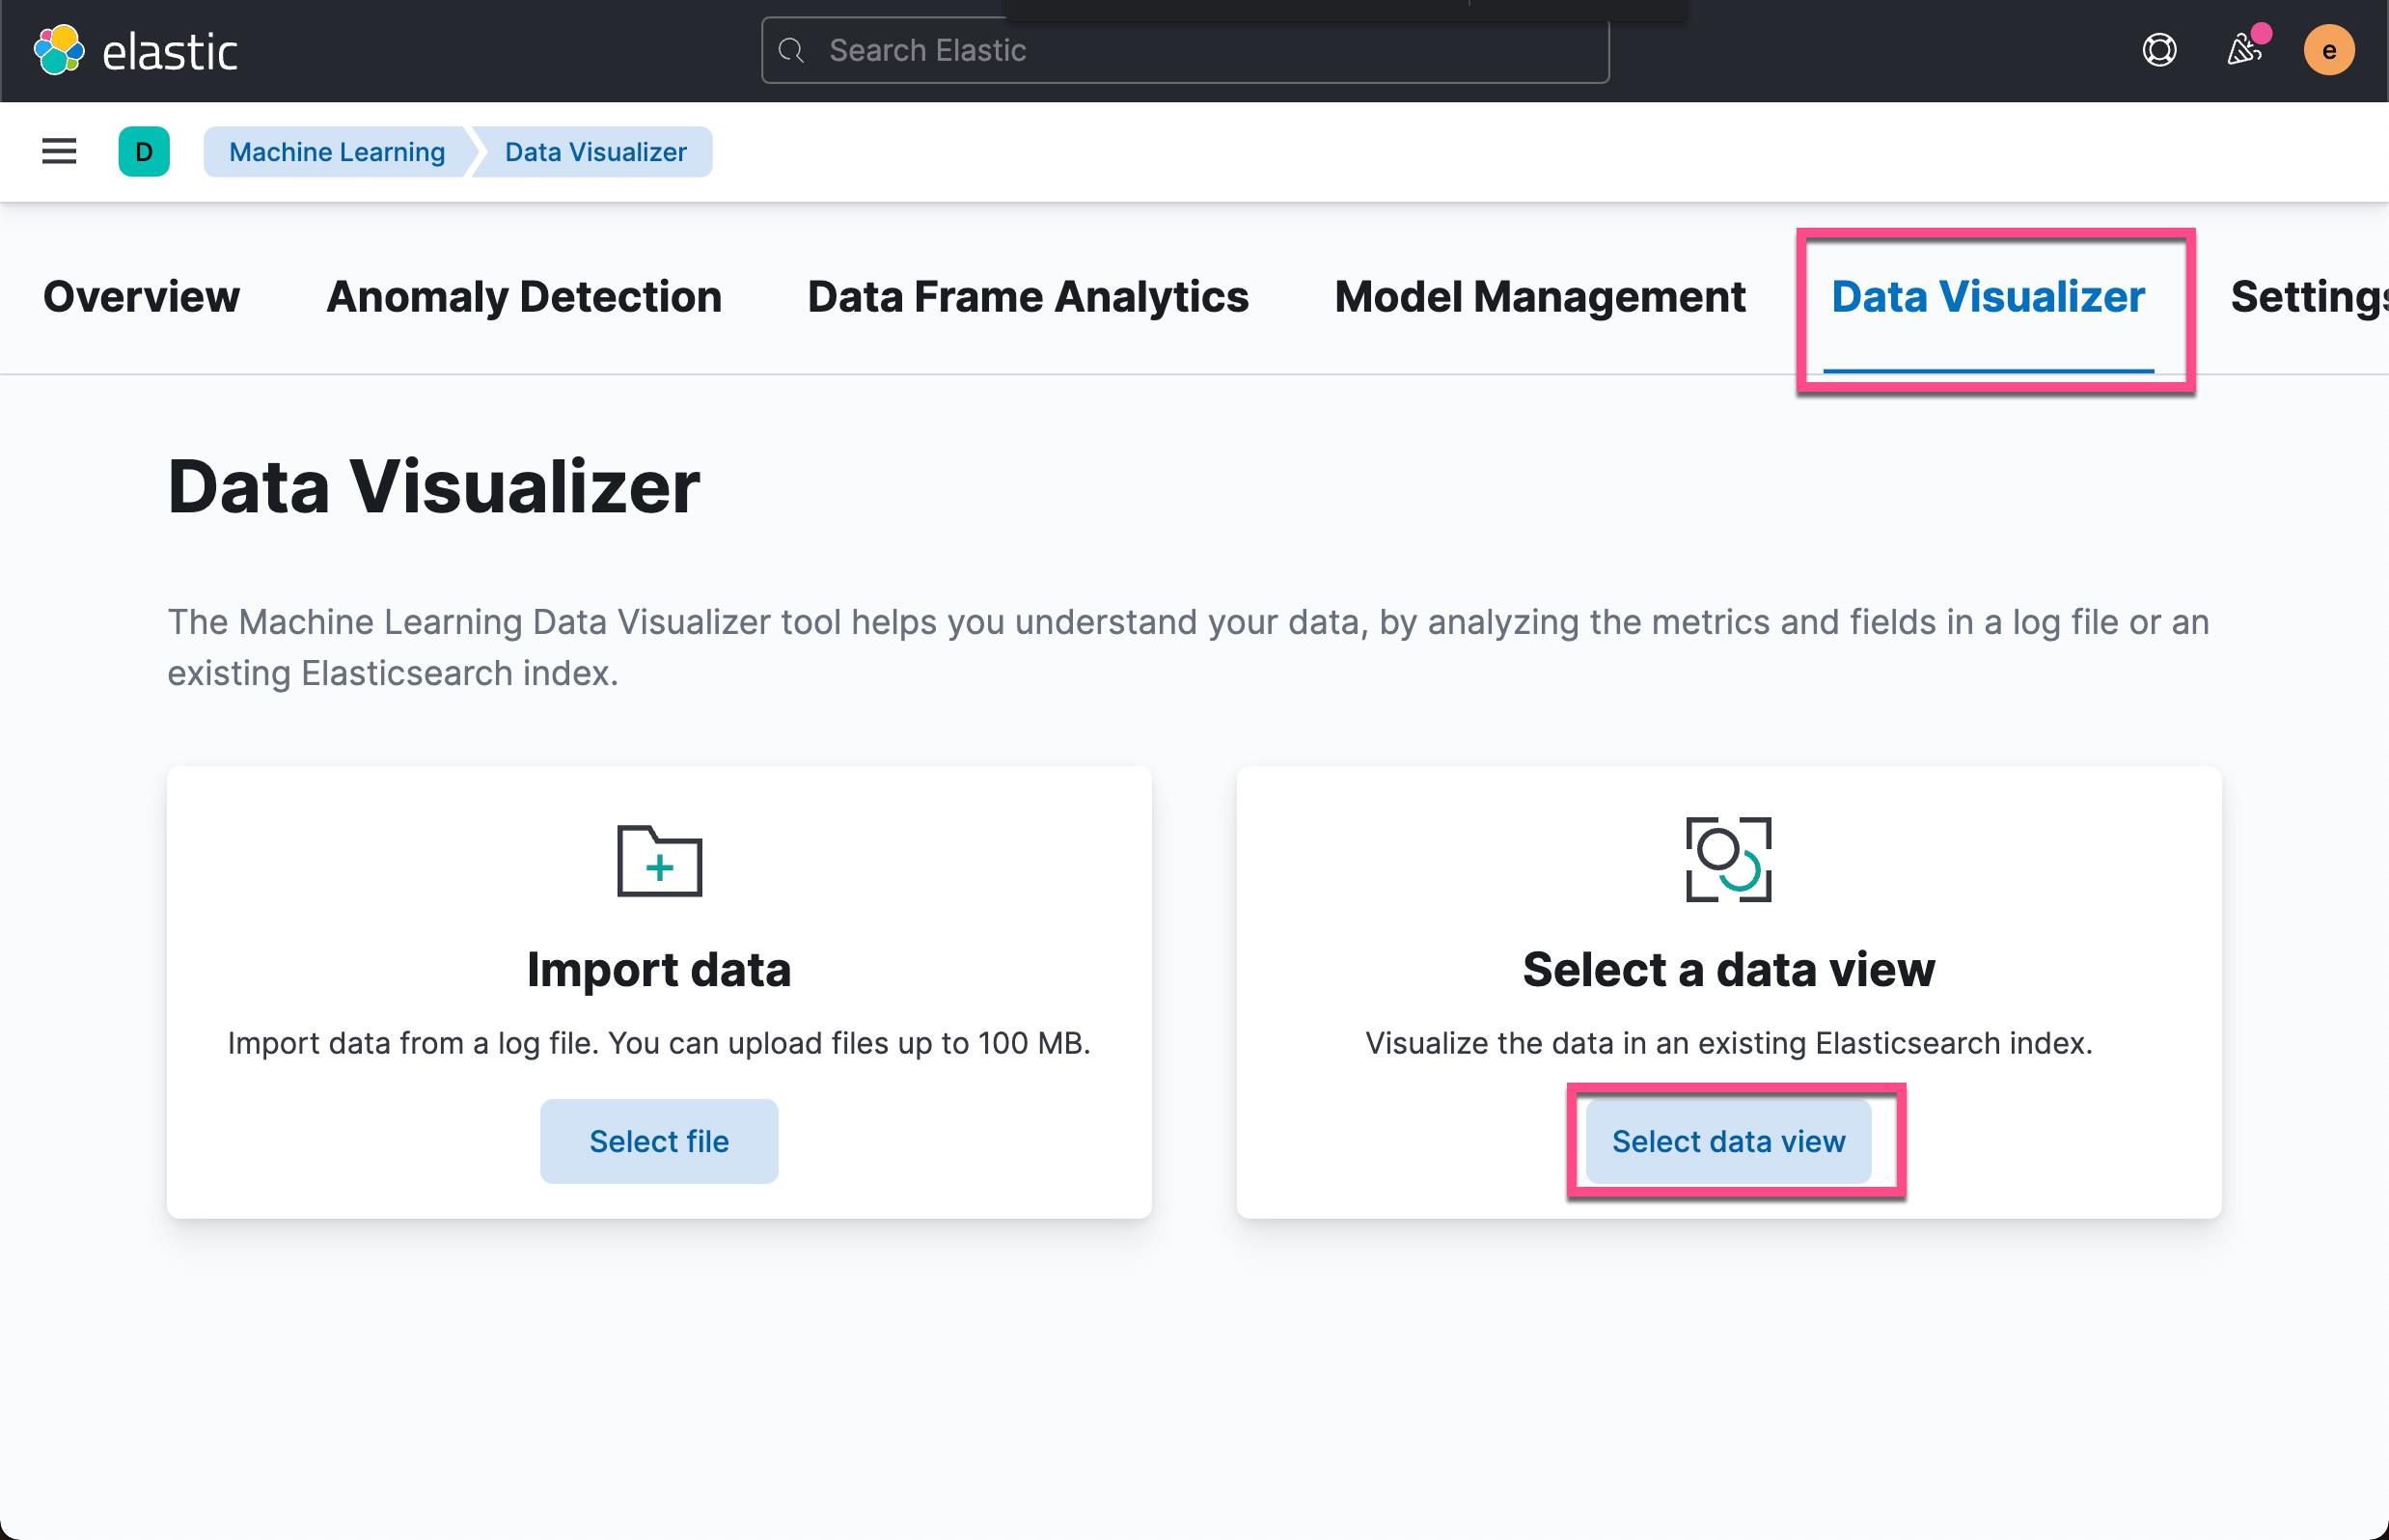
首先,我们使用机器学习的 data visualizer 来对数据做一个简单的分析:


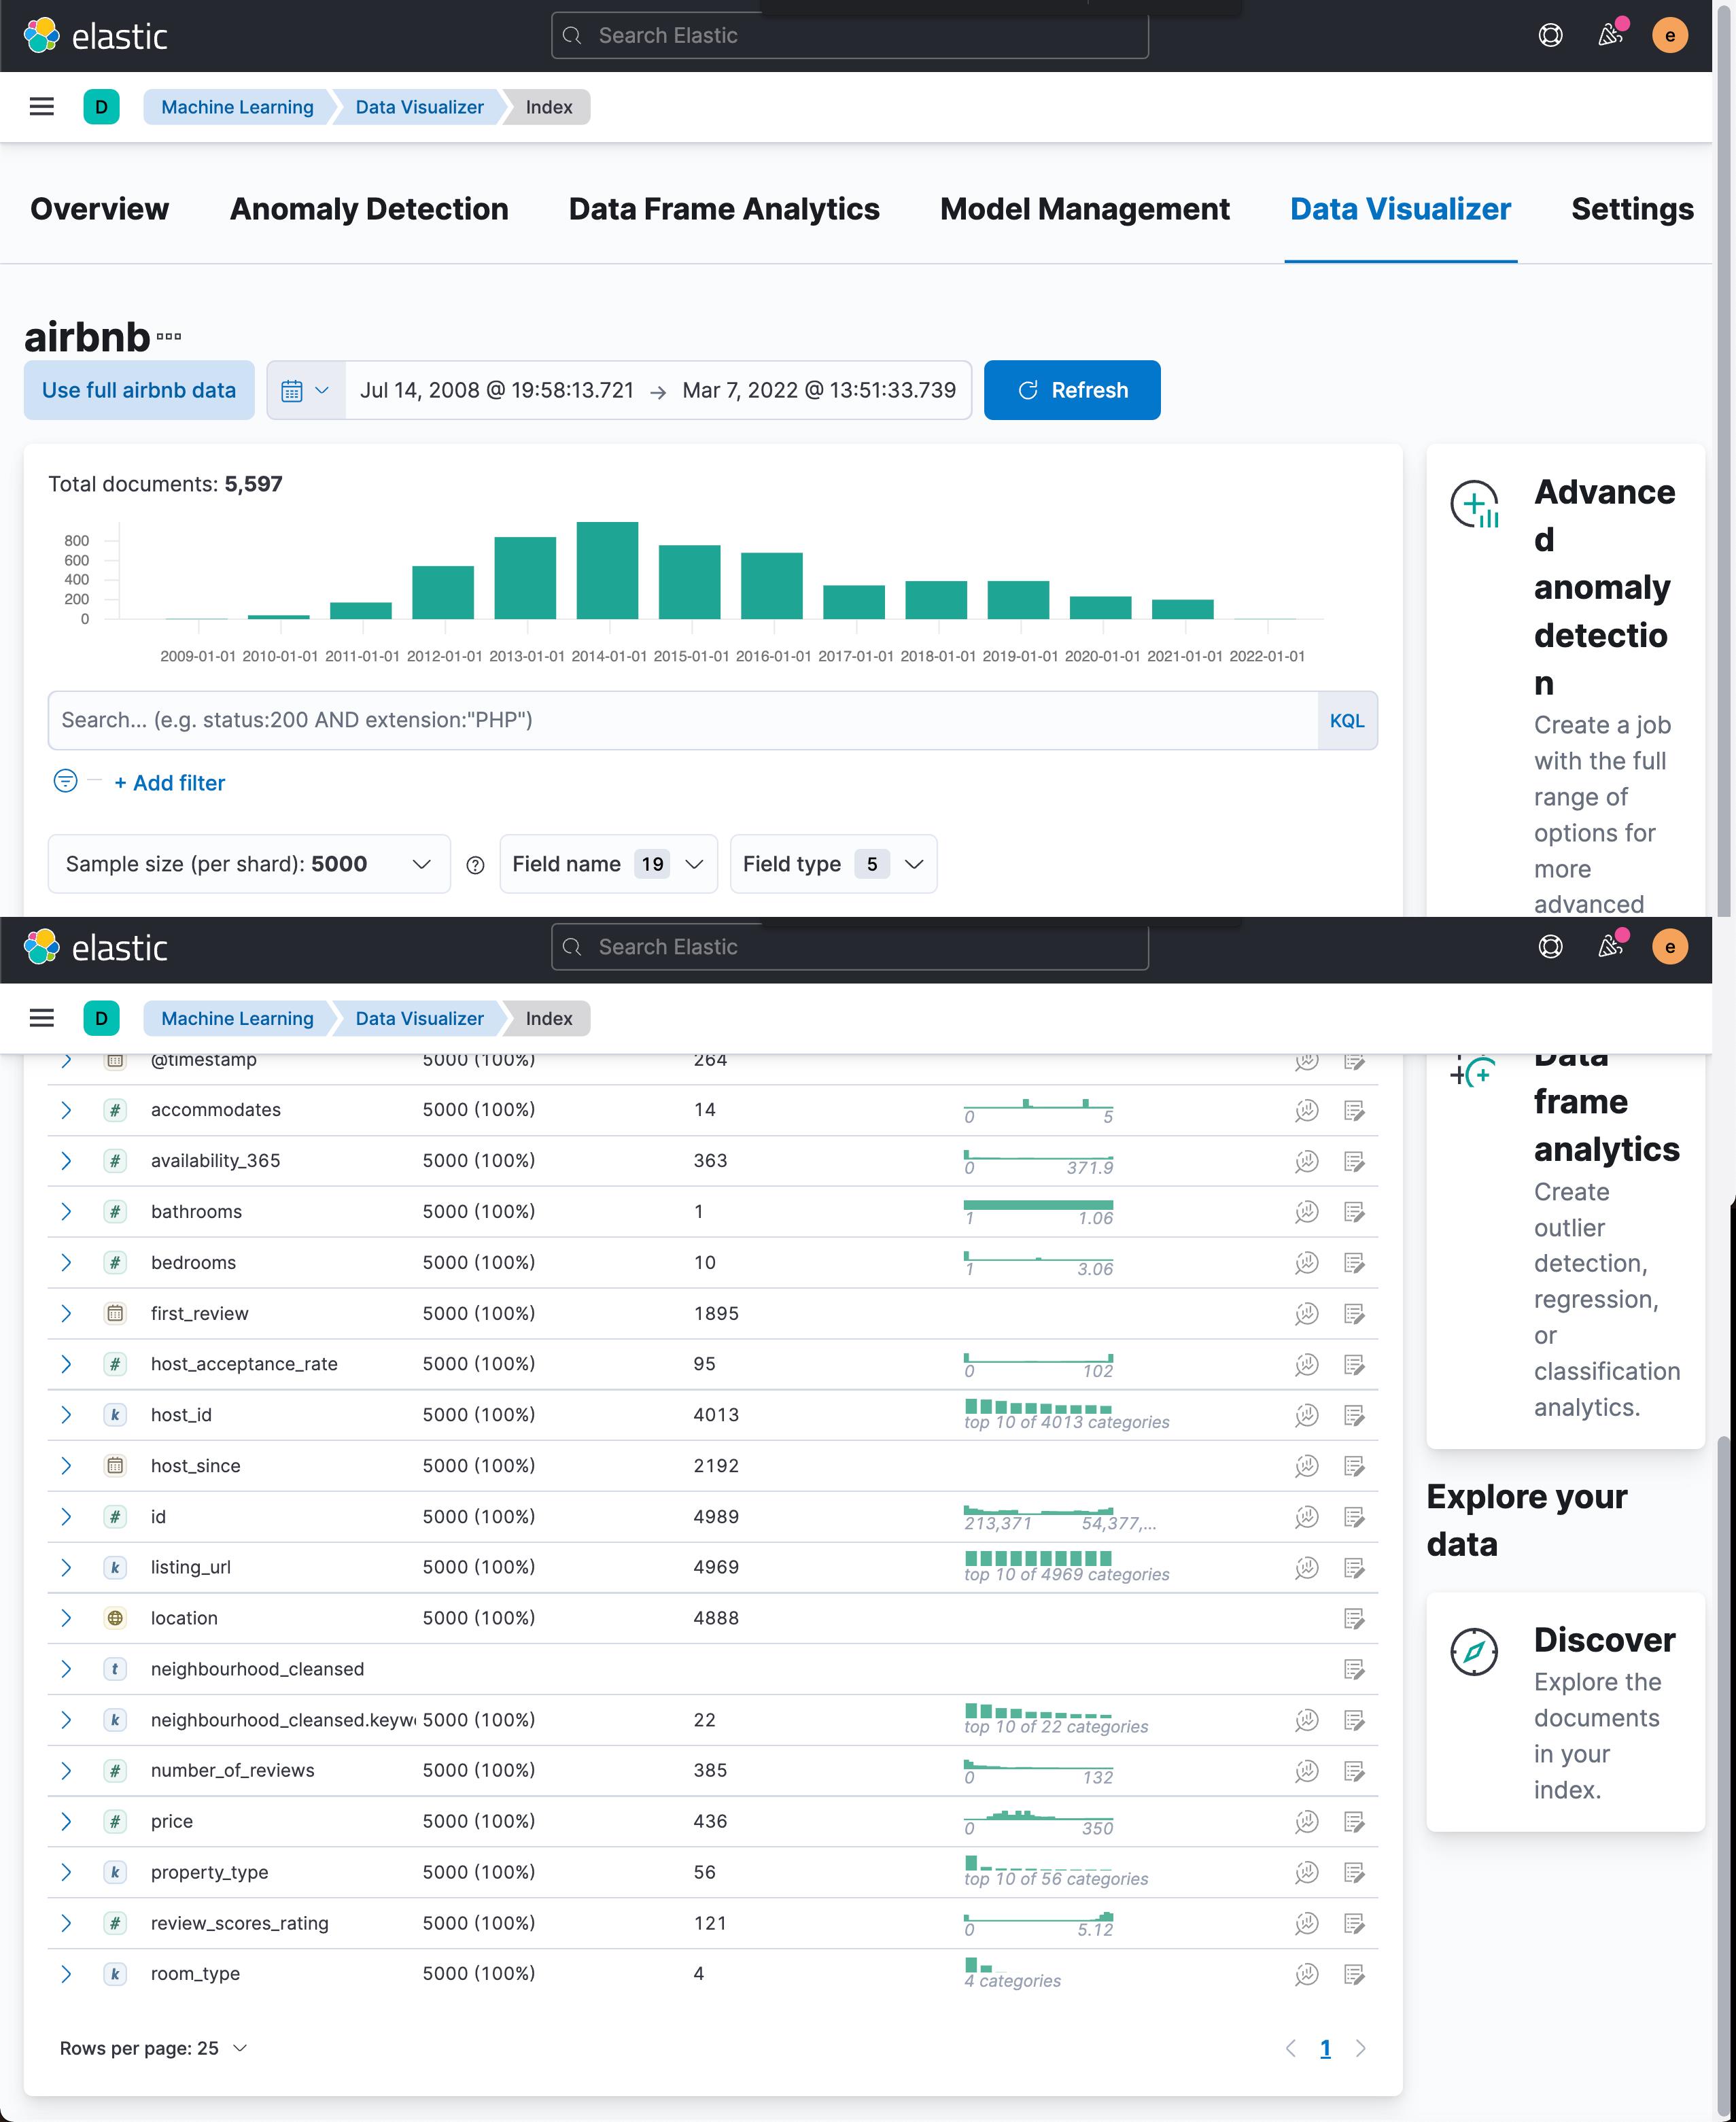
在这个窗口,我们可以看到数据的分布情况。比如我们可以想看一下 price 的分布:
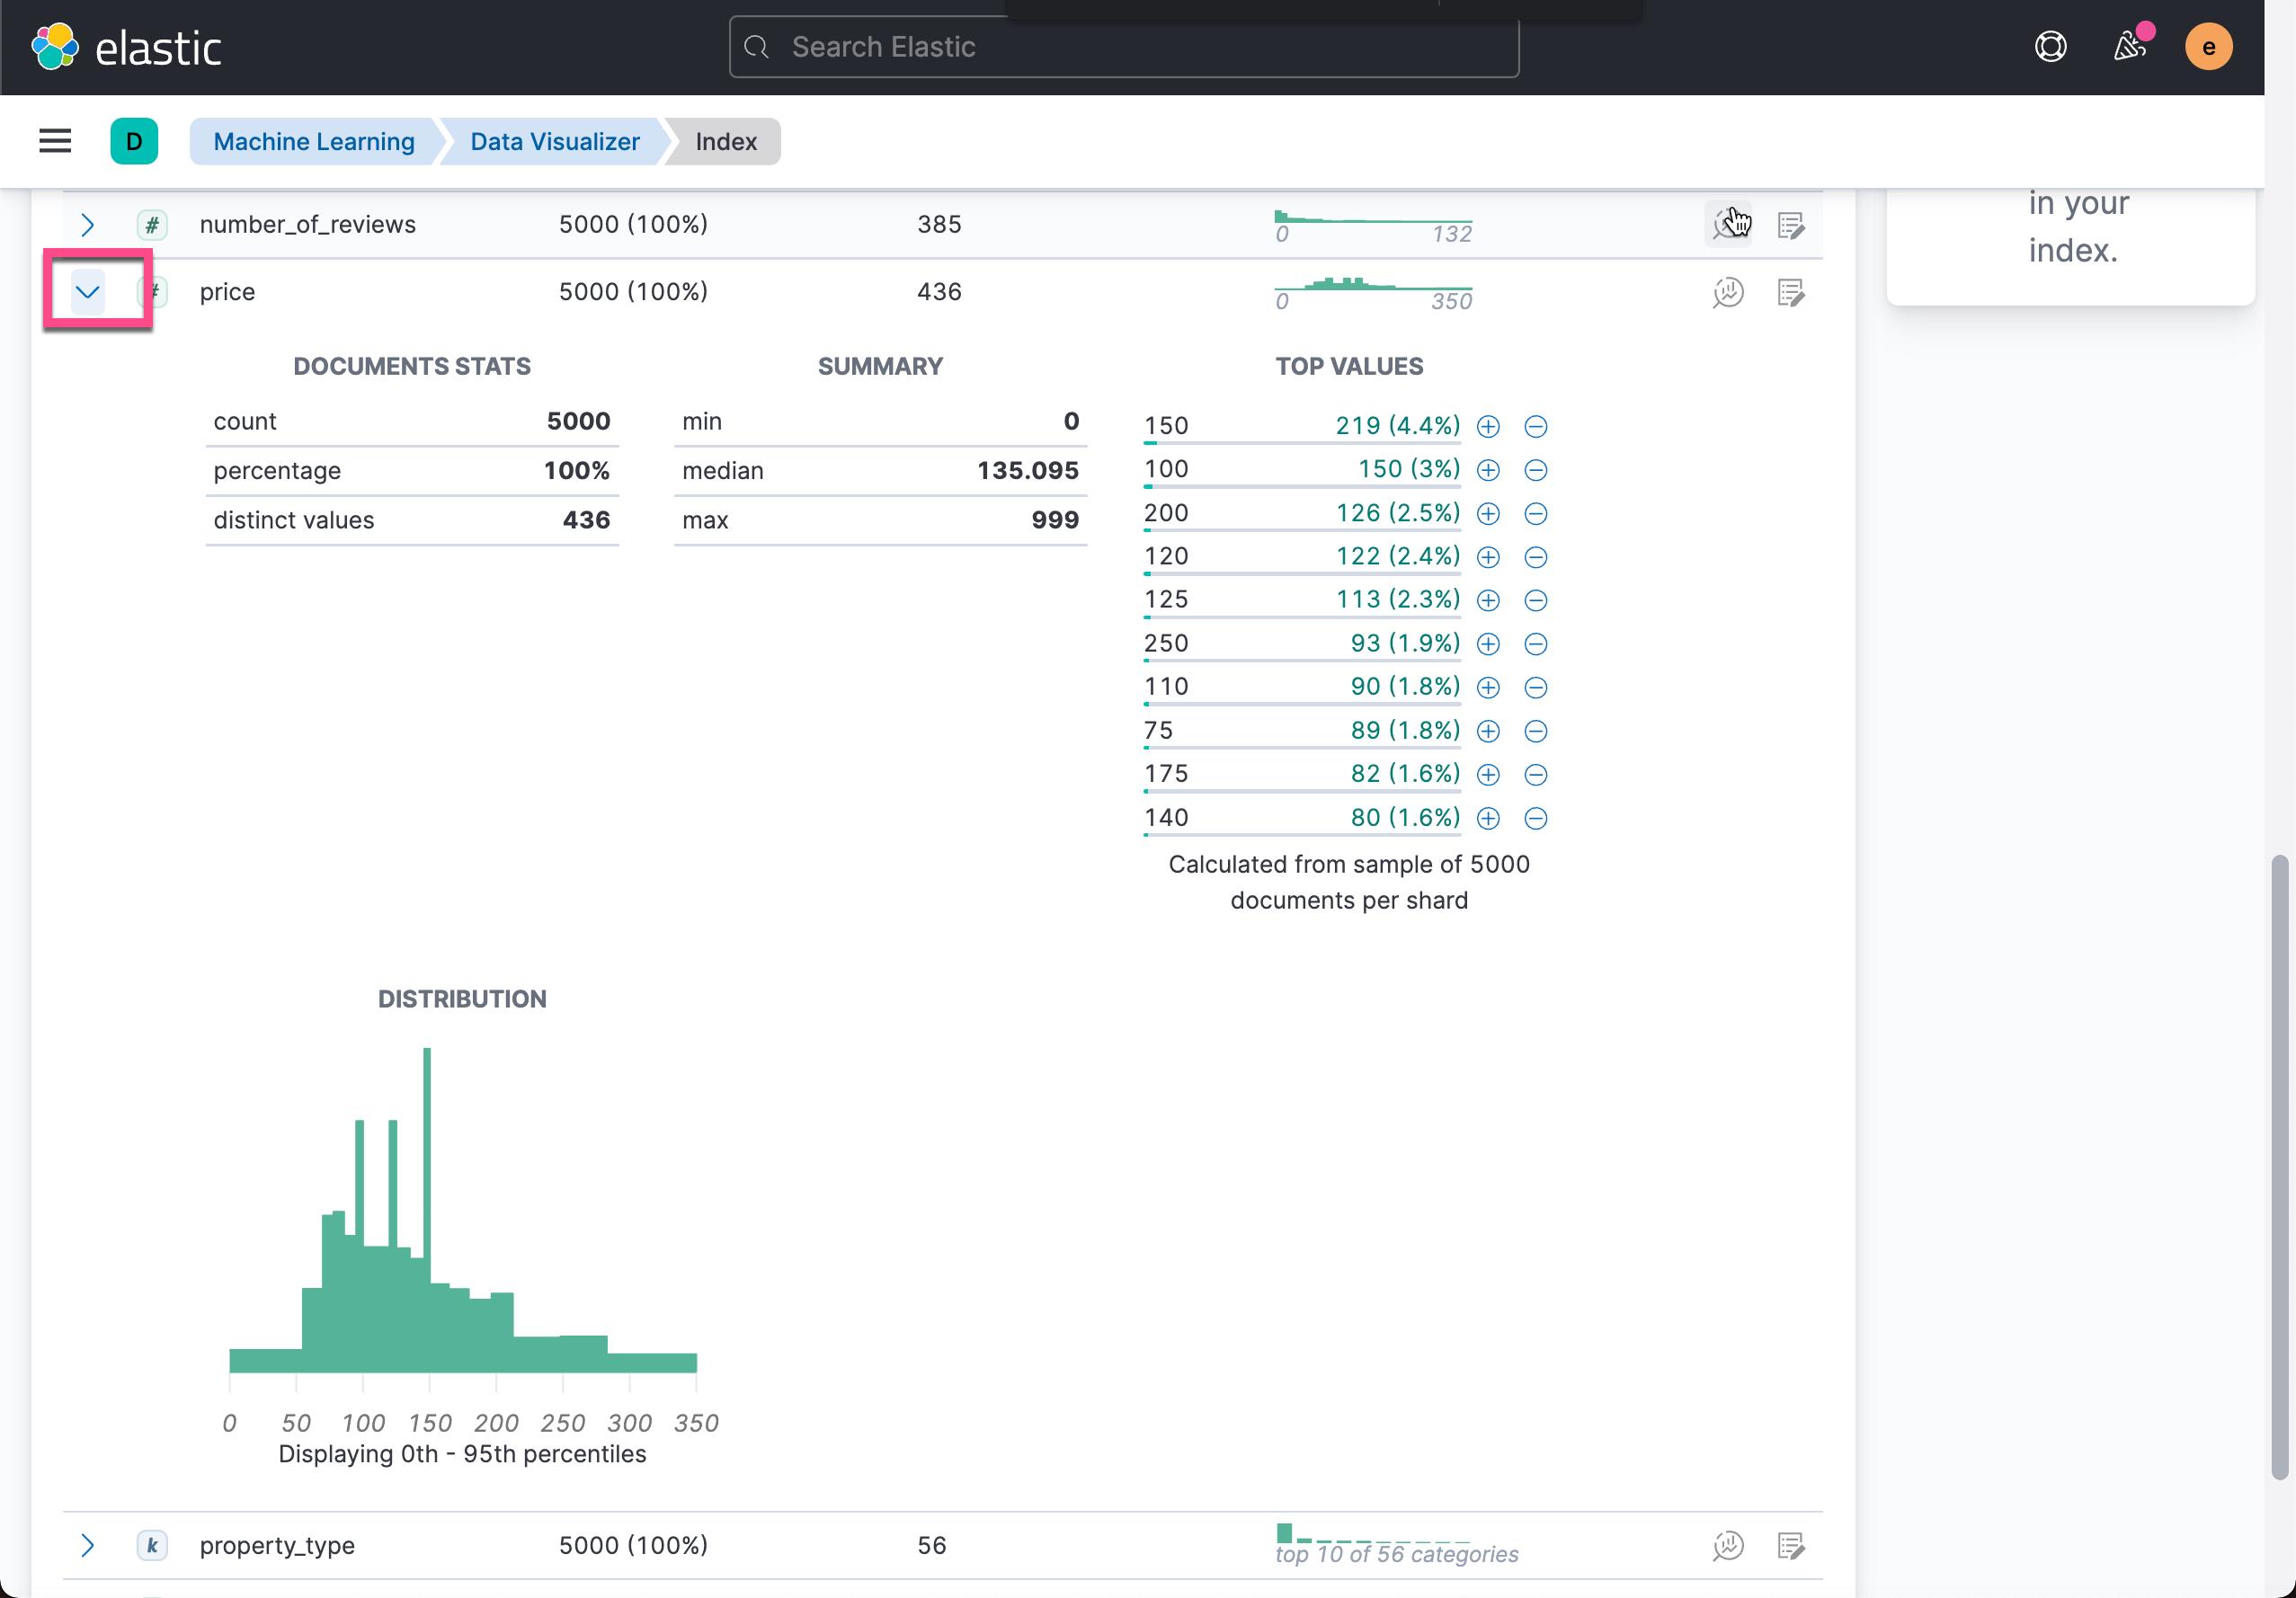
从上面,我们可以看到价钱的分布情况。我们还可以看到 room_type 的情况:

使用 data frame analytics 来分析异常
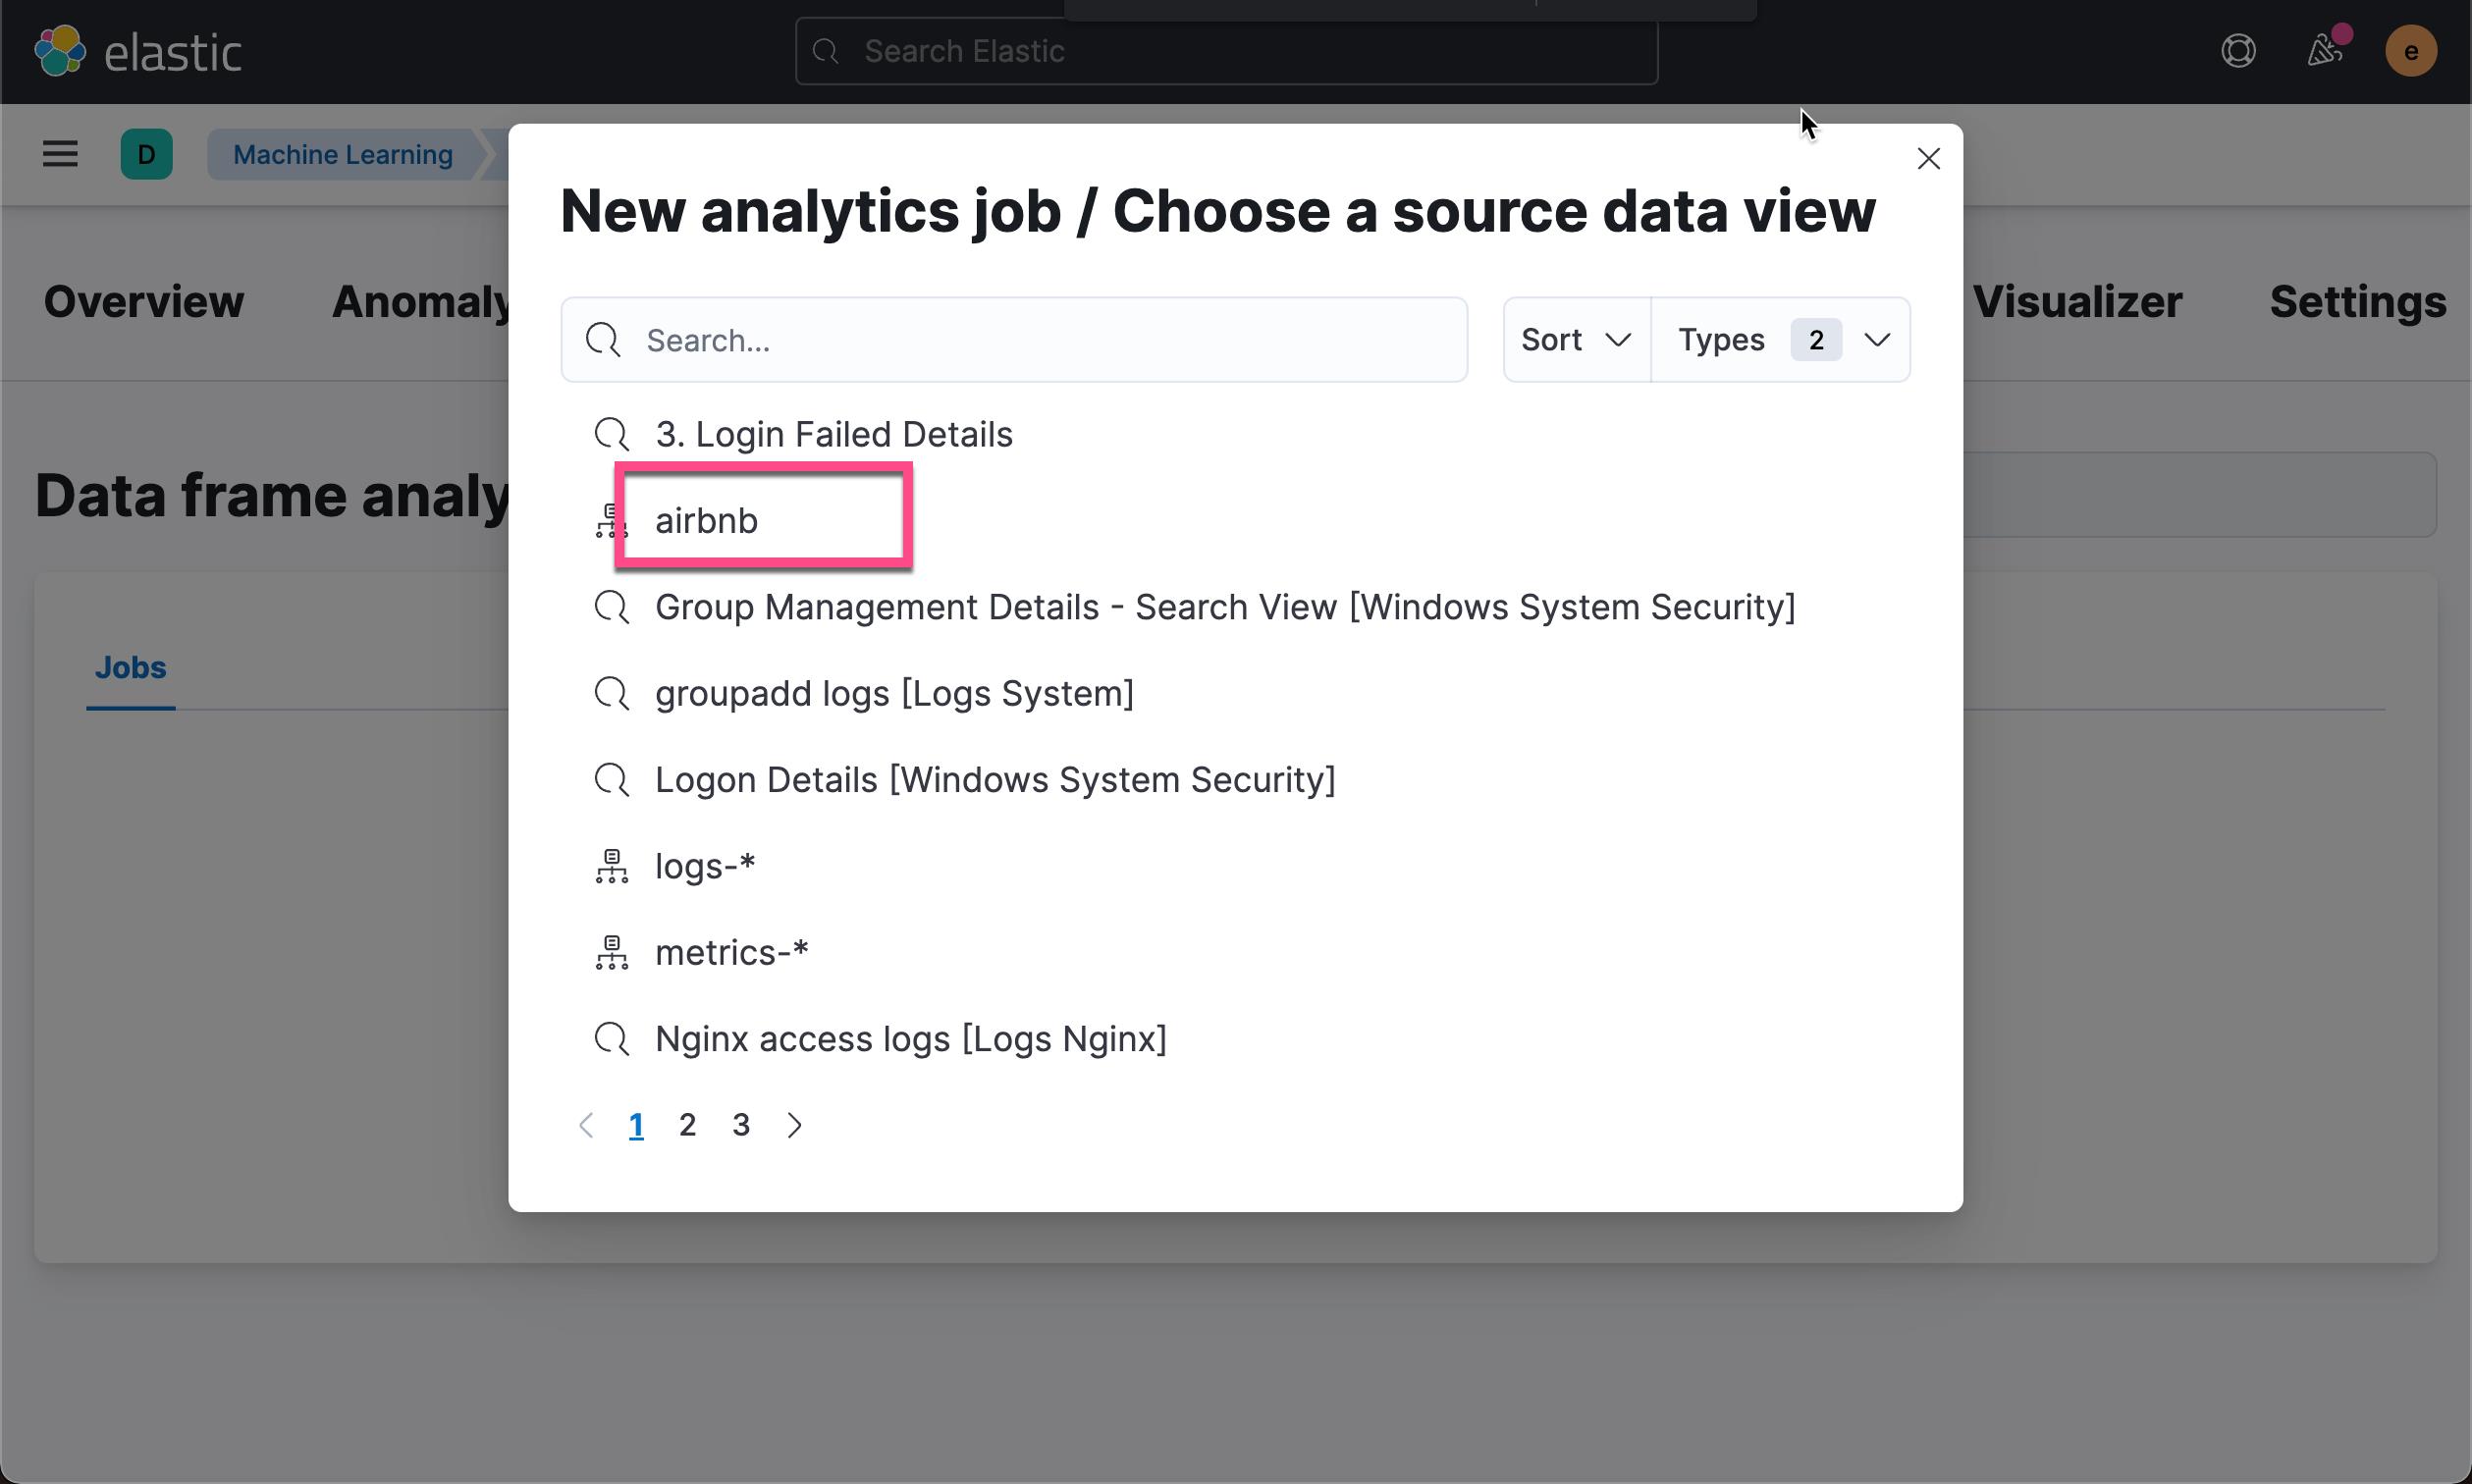
我们接下来使用 data frame 来分析数据的异常情况:

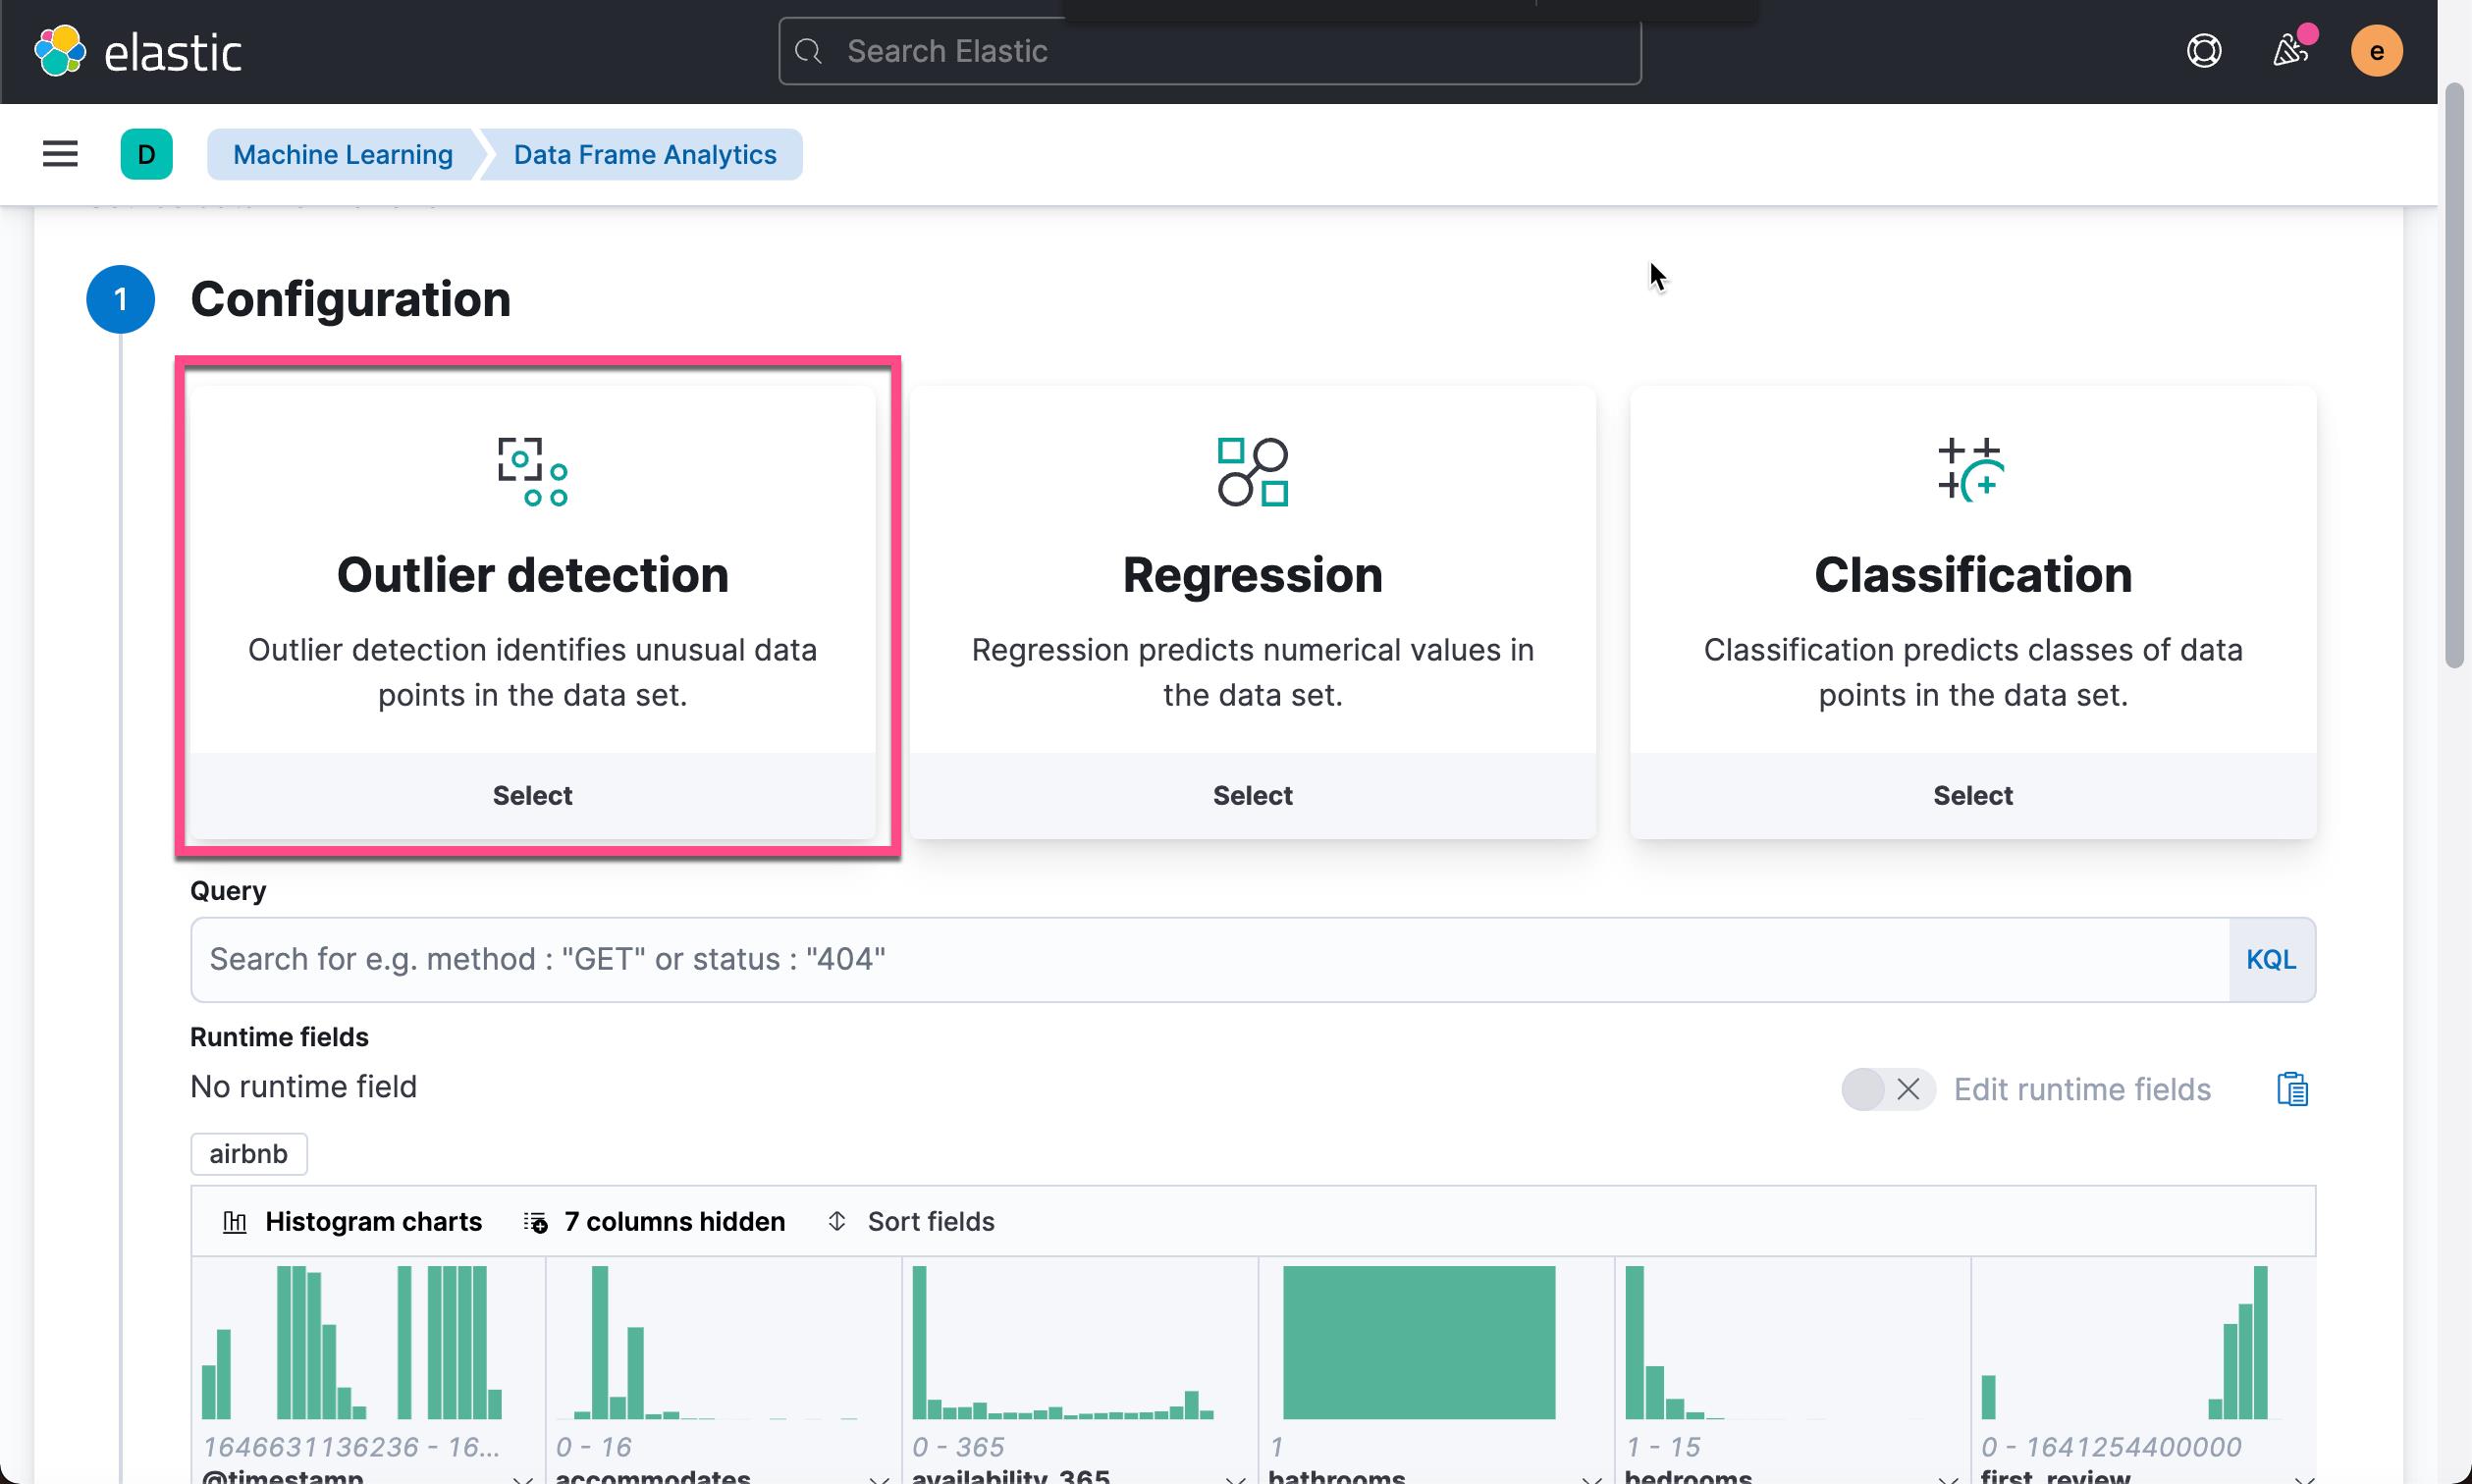
在我们进行数据分析之前,我们想排出那些明显是异常的数据,比如:
在我们看来这些数据可能是录入错误,是完全不需要用于分析的数据。我们可以在 Data frame analysis 的界面过滤掉这些数据:

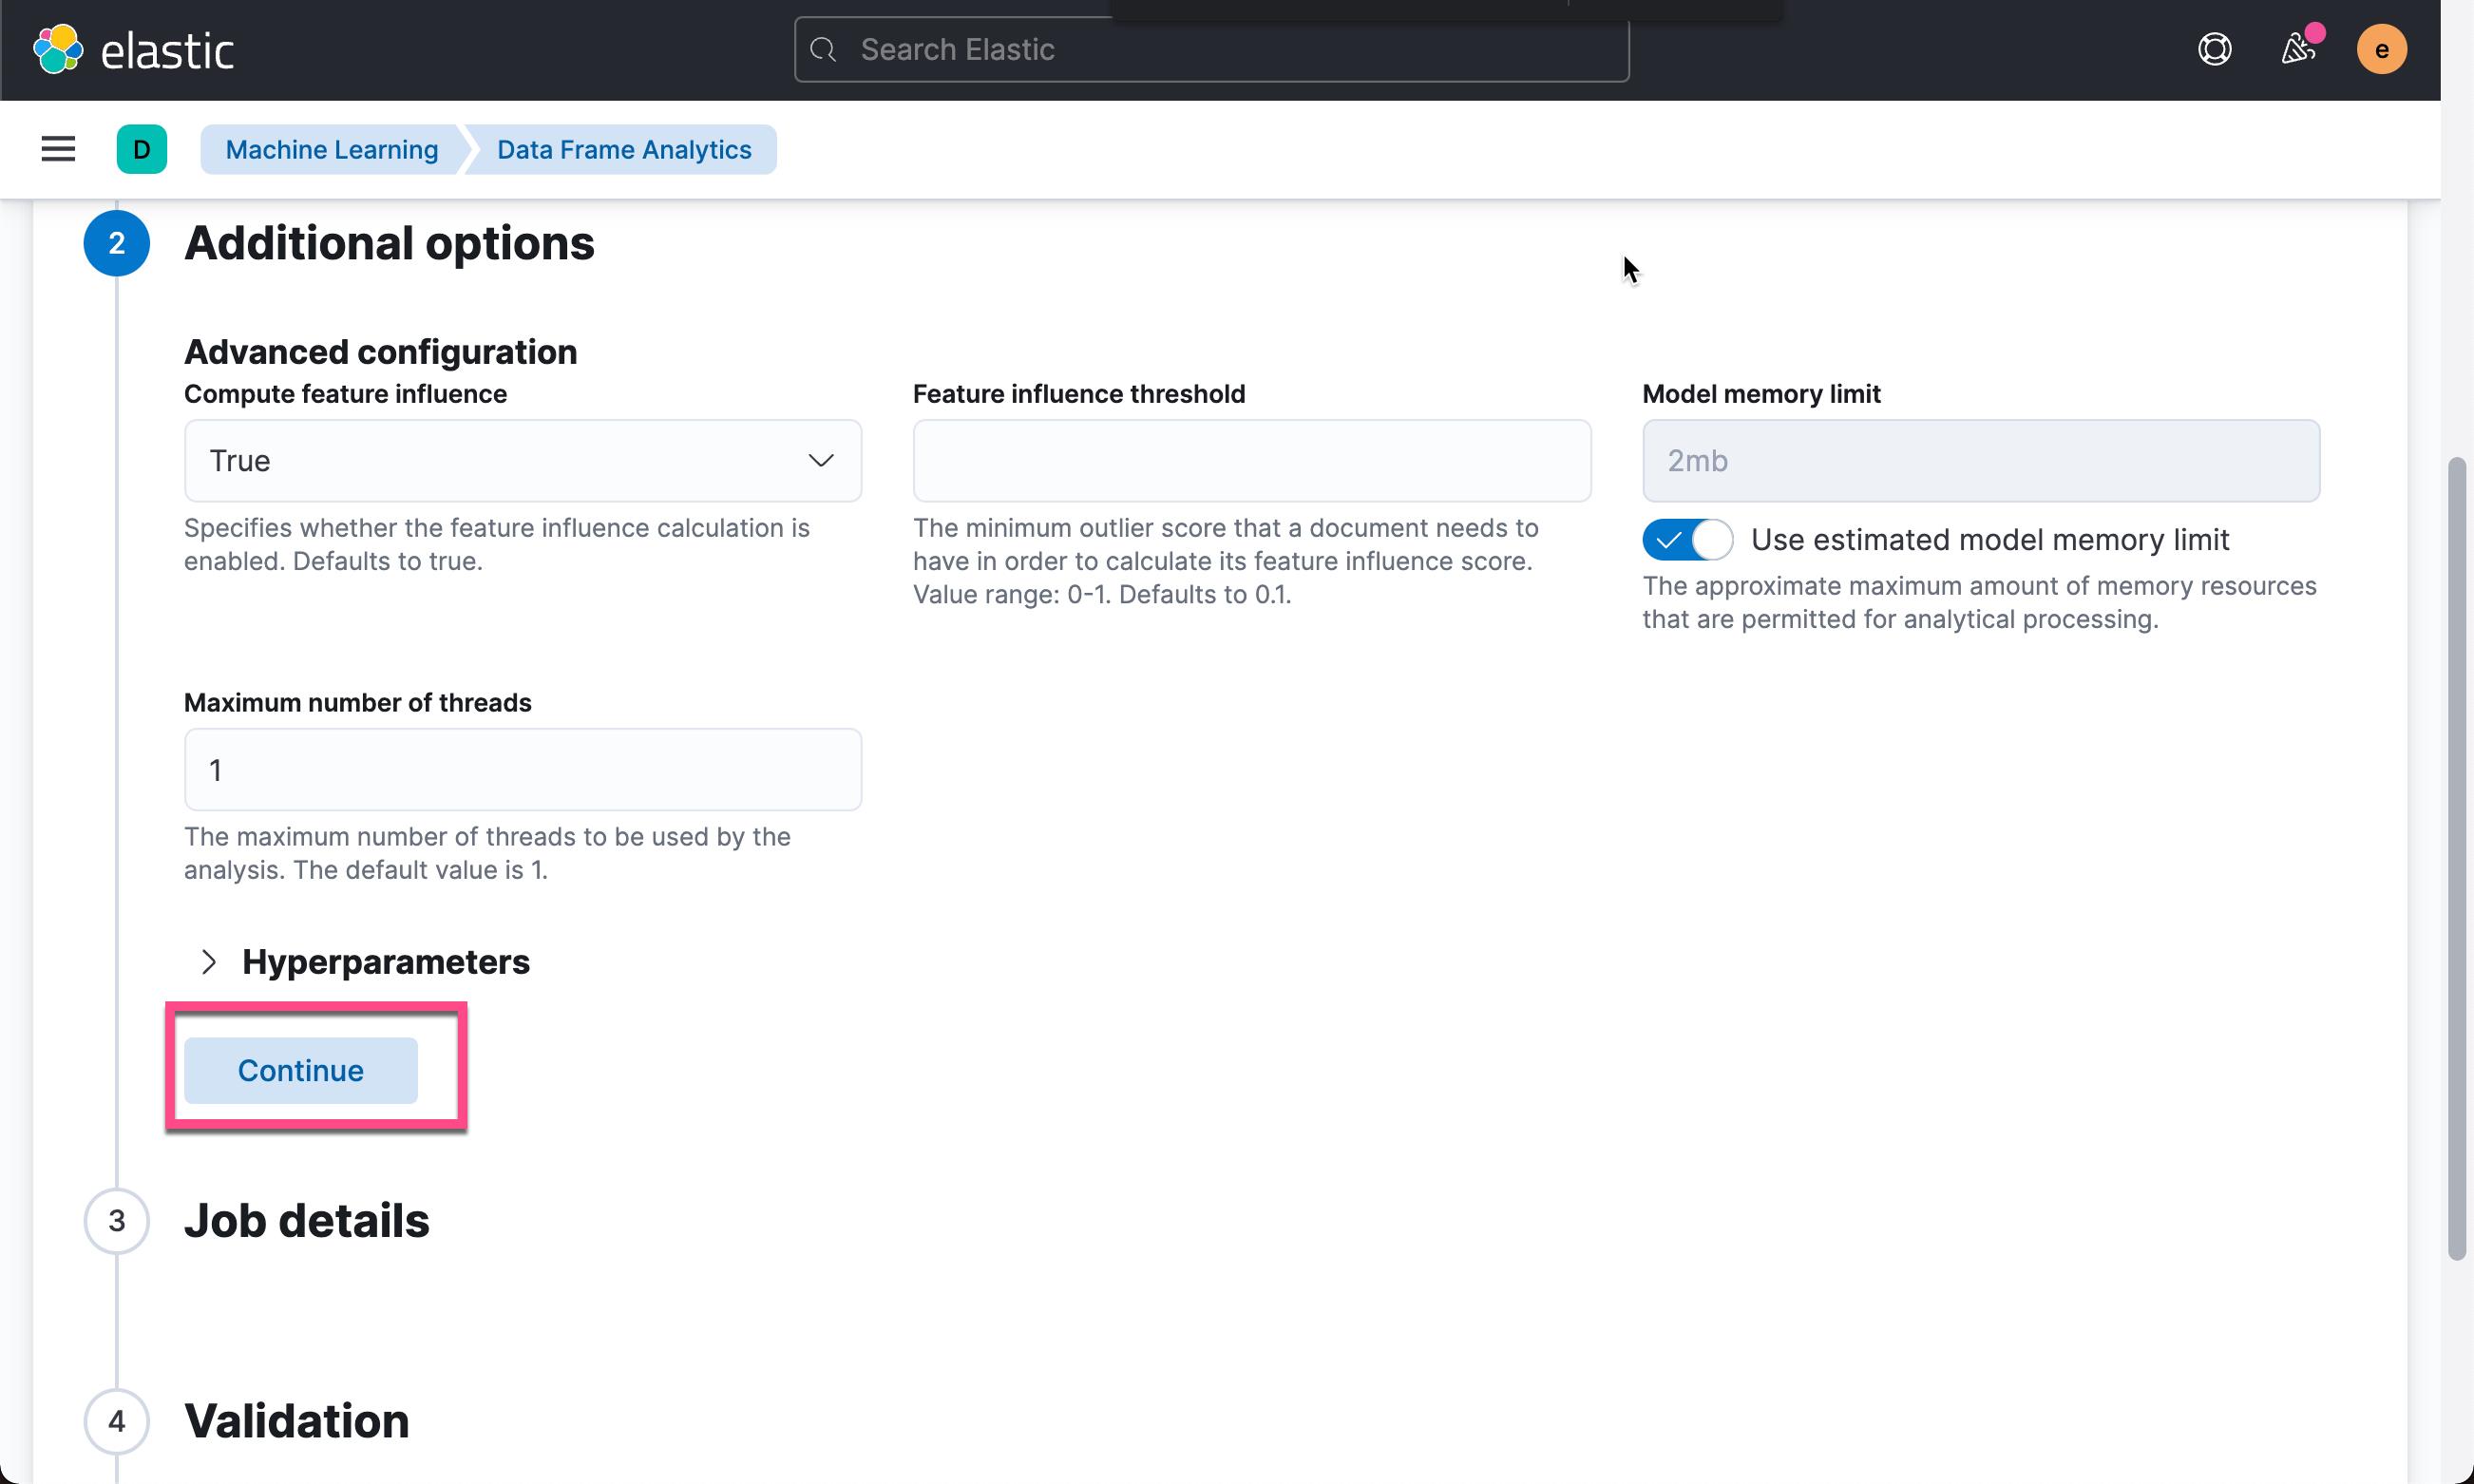
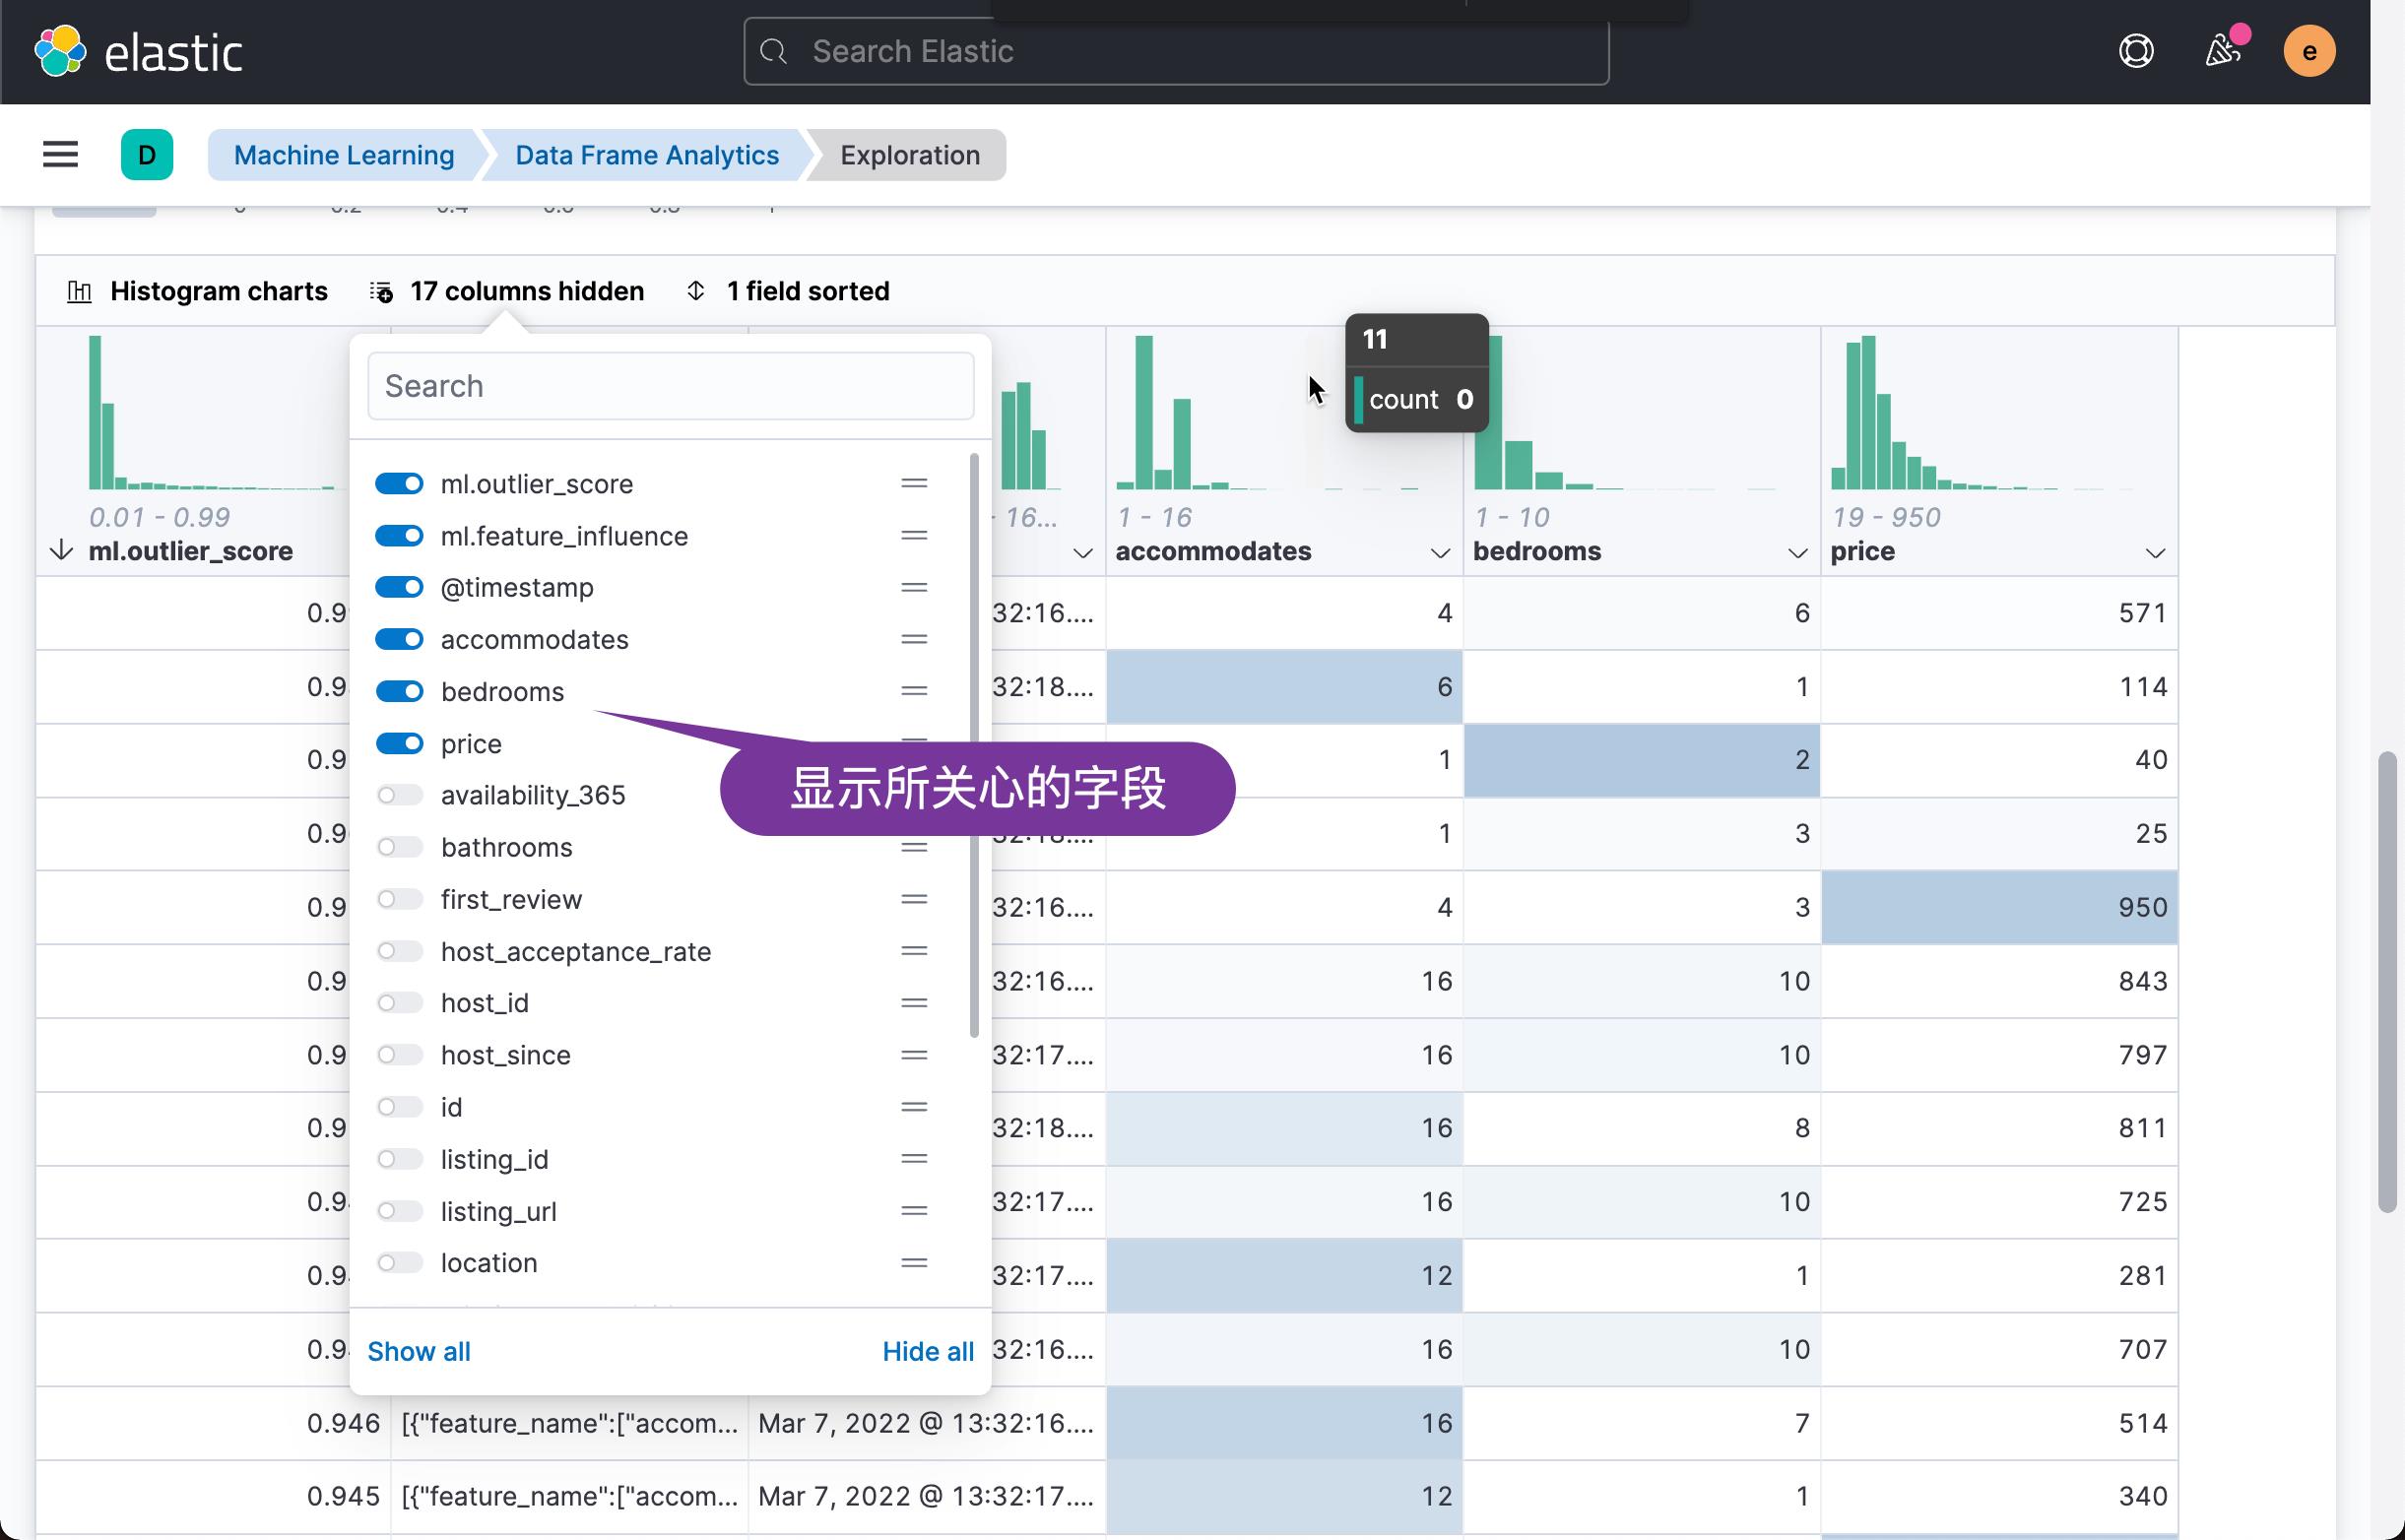
如上所示,我们想对满足 price > 10 and number_of_reviews > 2 and availability_365 > 0 这样条件的数据进行分析。我们接下来选择感兴趣的字段来进行分析:
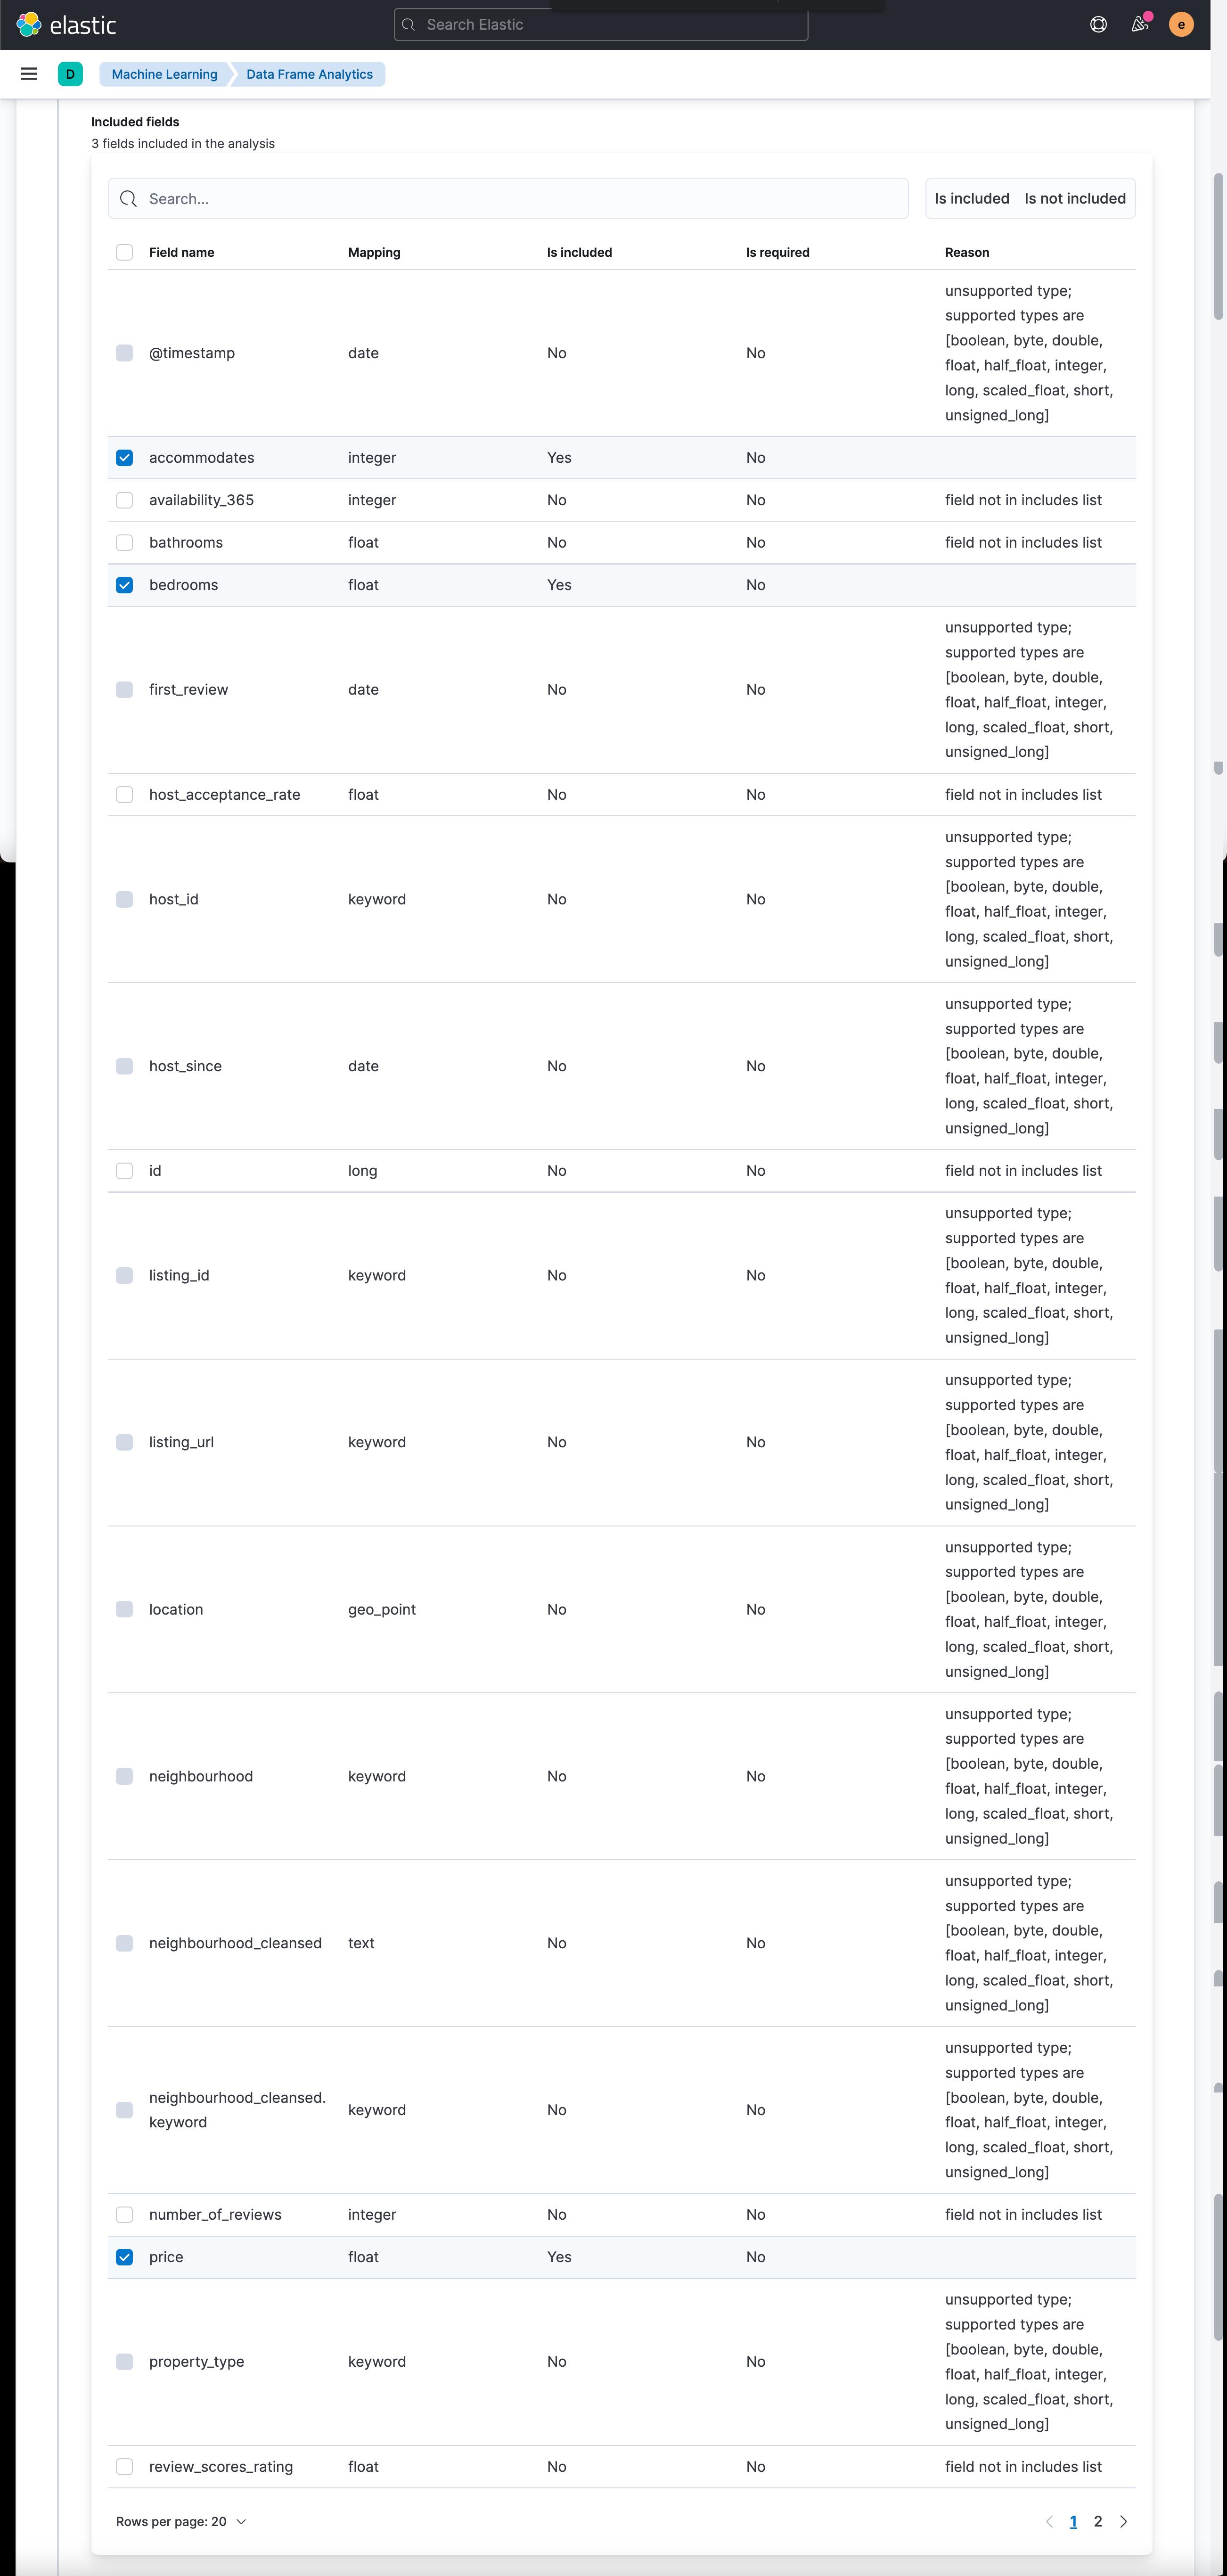
如上所示,我们选择 price(价钱的高低),bedroom(多少个 bedrooms) 以及 accomodate (最多能住多少人) 来进行分析:


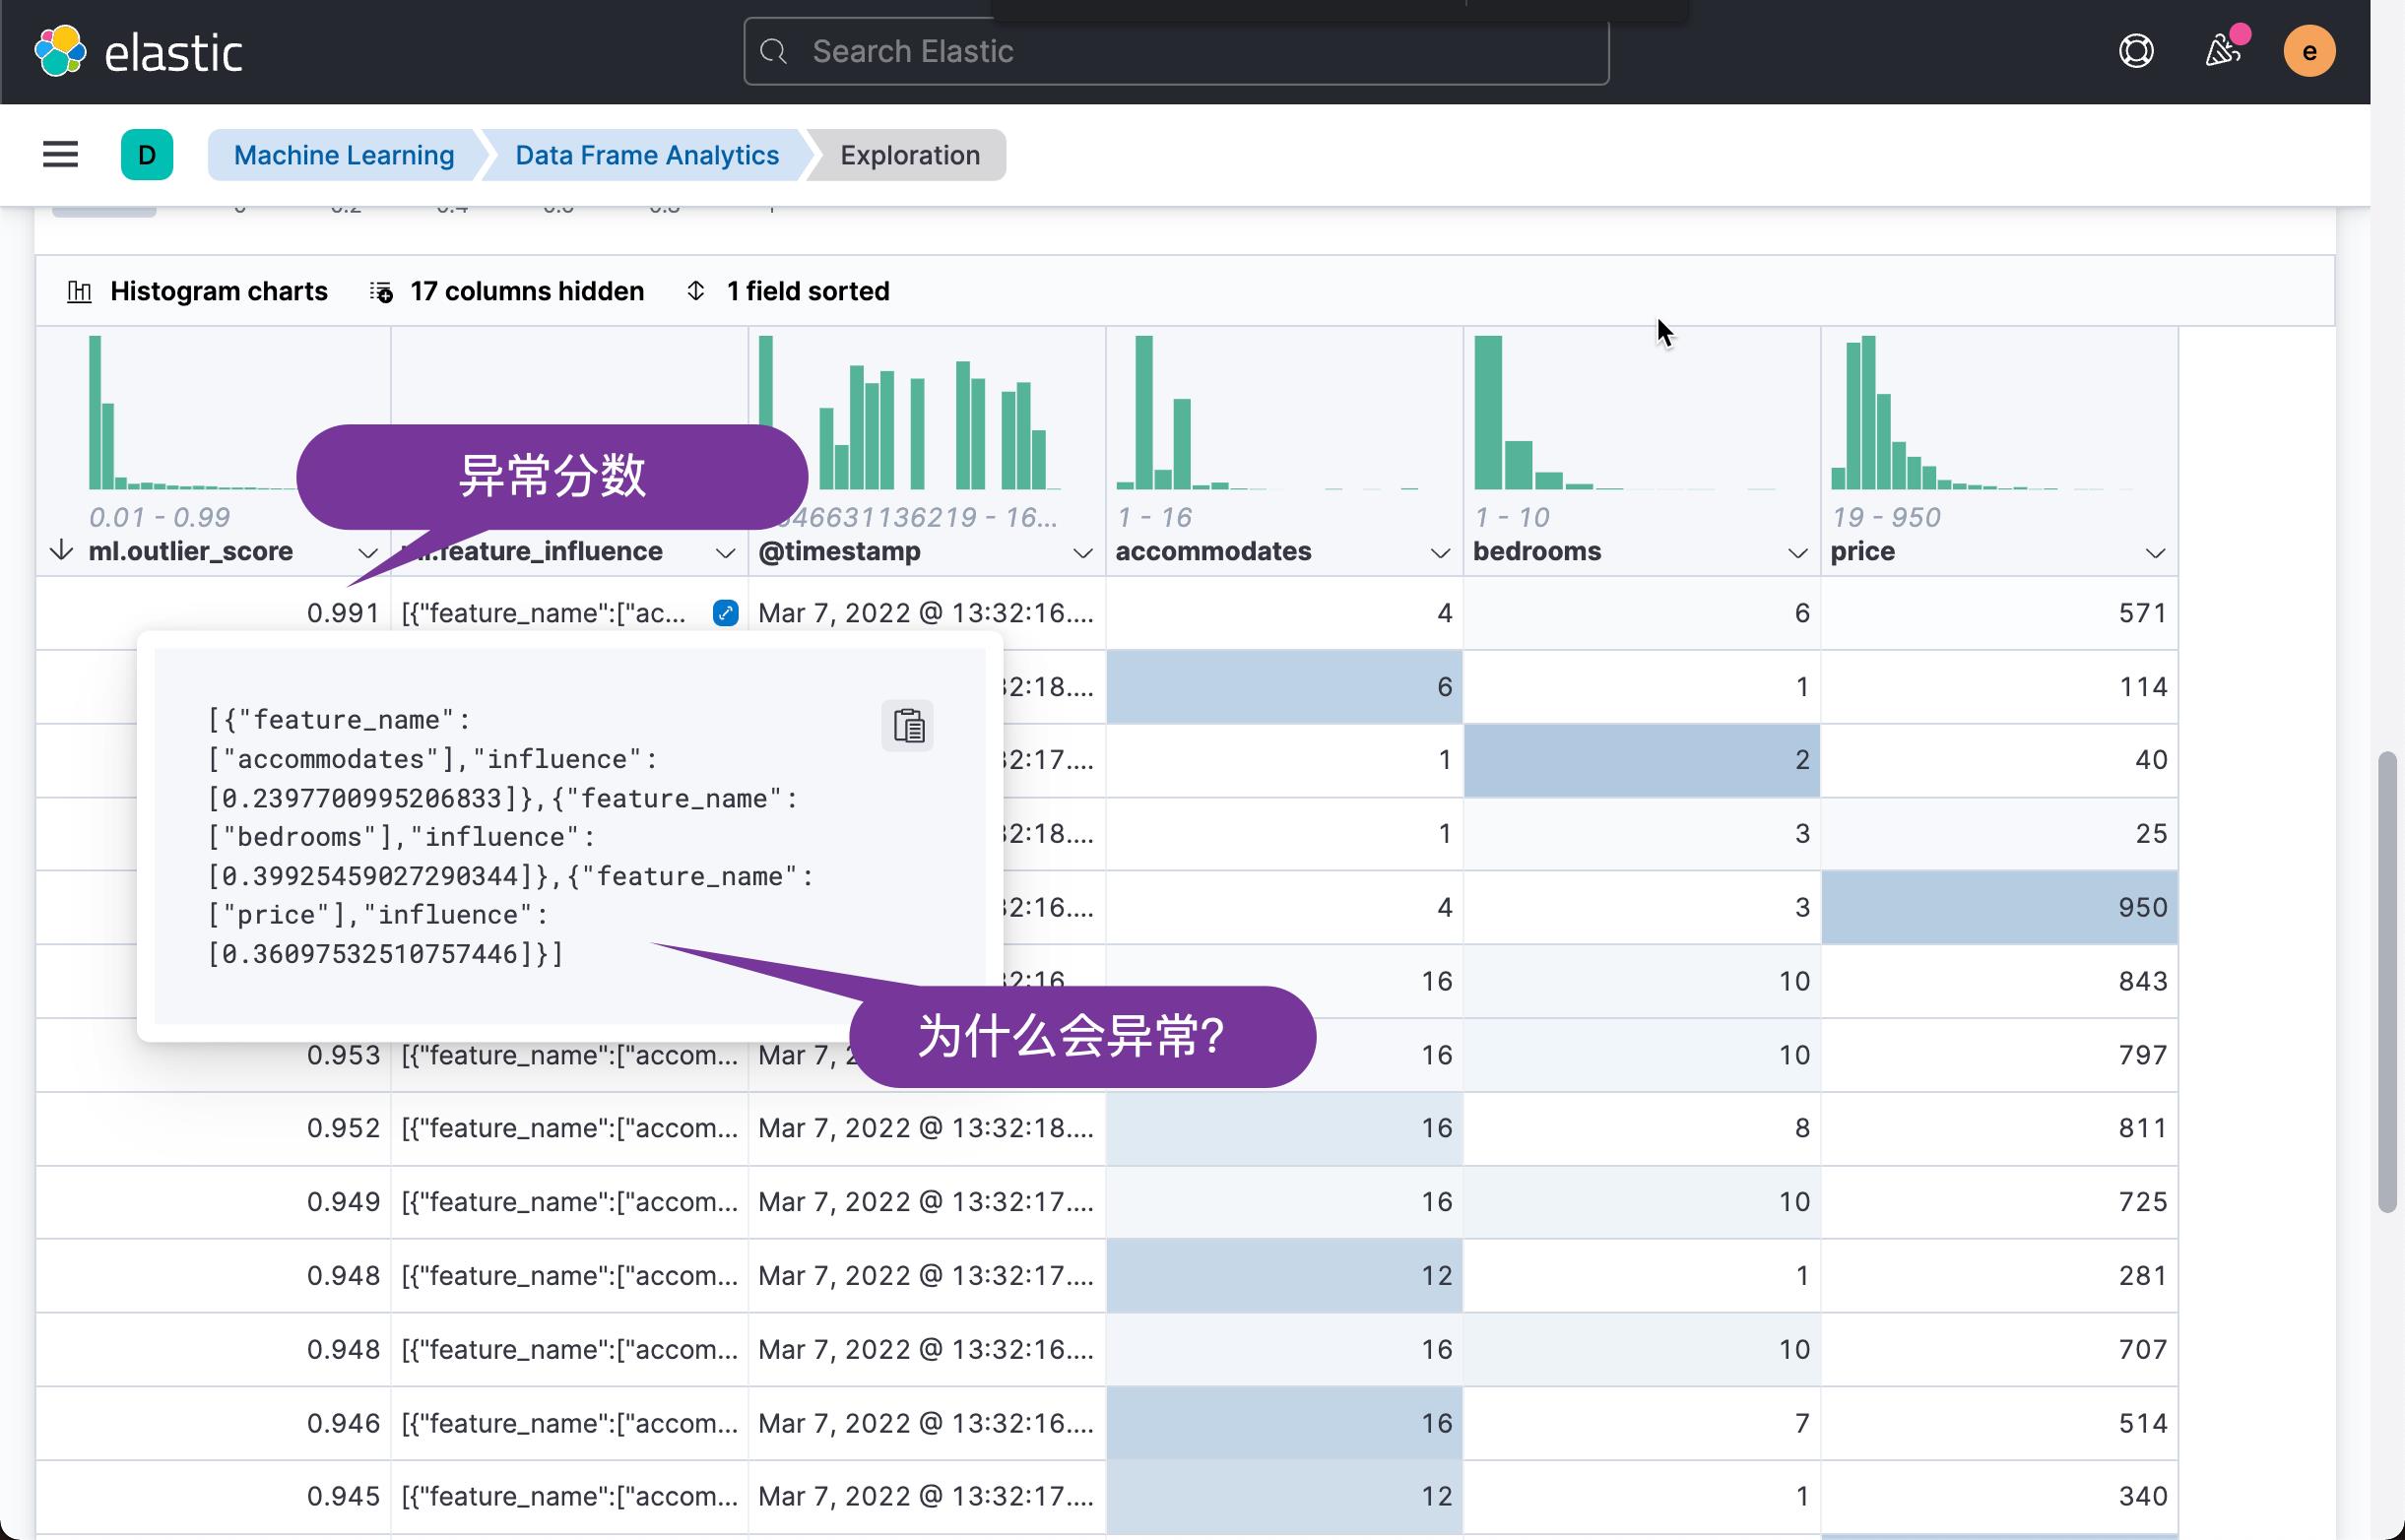
从上面的数据我们可以看出来,一个最多能住 4 个人的房屋,带有6个 bedrooms,价钱高达 571,而另外一个做多能住6个人,却只有一个卧房的房间,价钱是114。这两个数据占据异常的最高点。它们的异常分数分别达到 0.991 及 0.981。
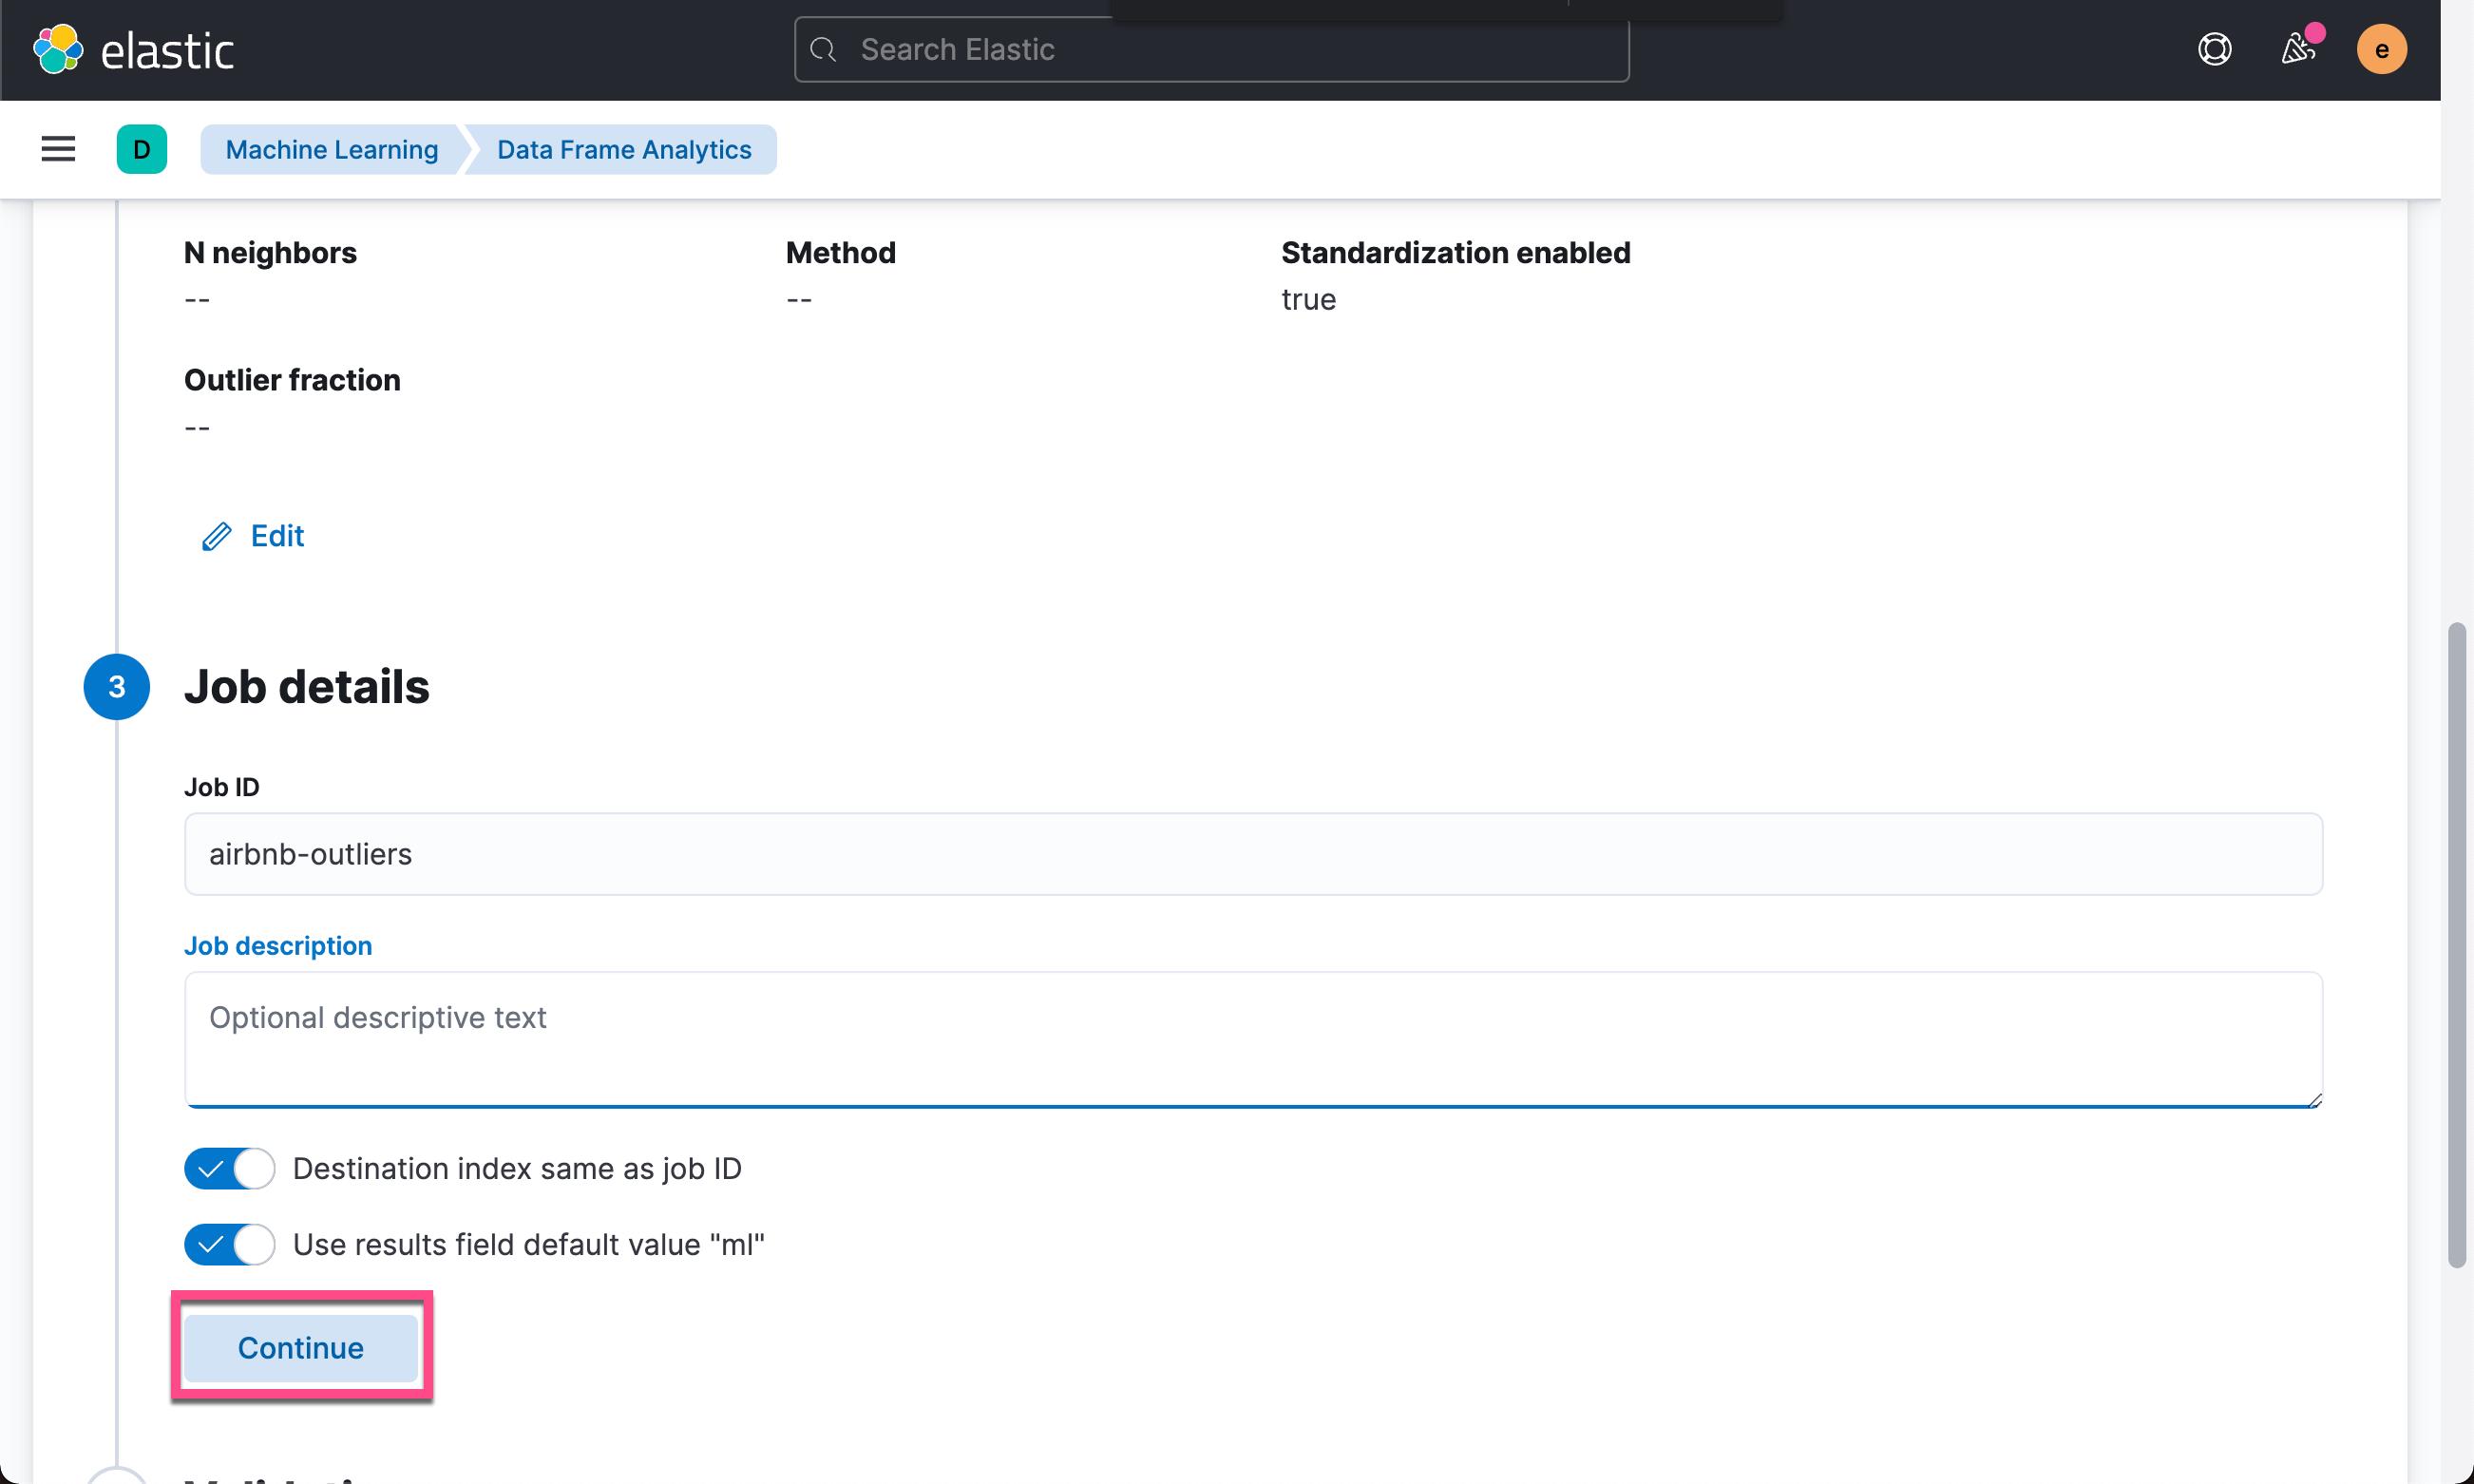
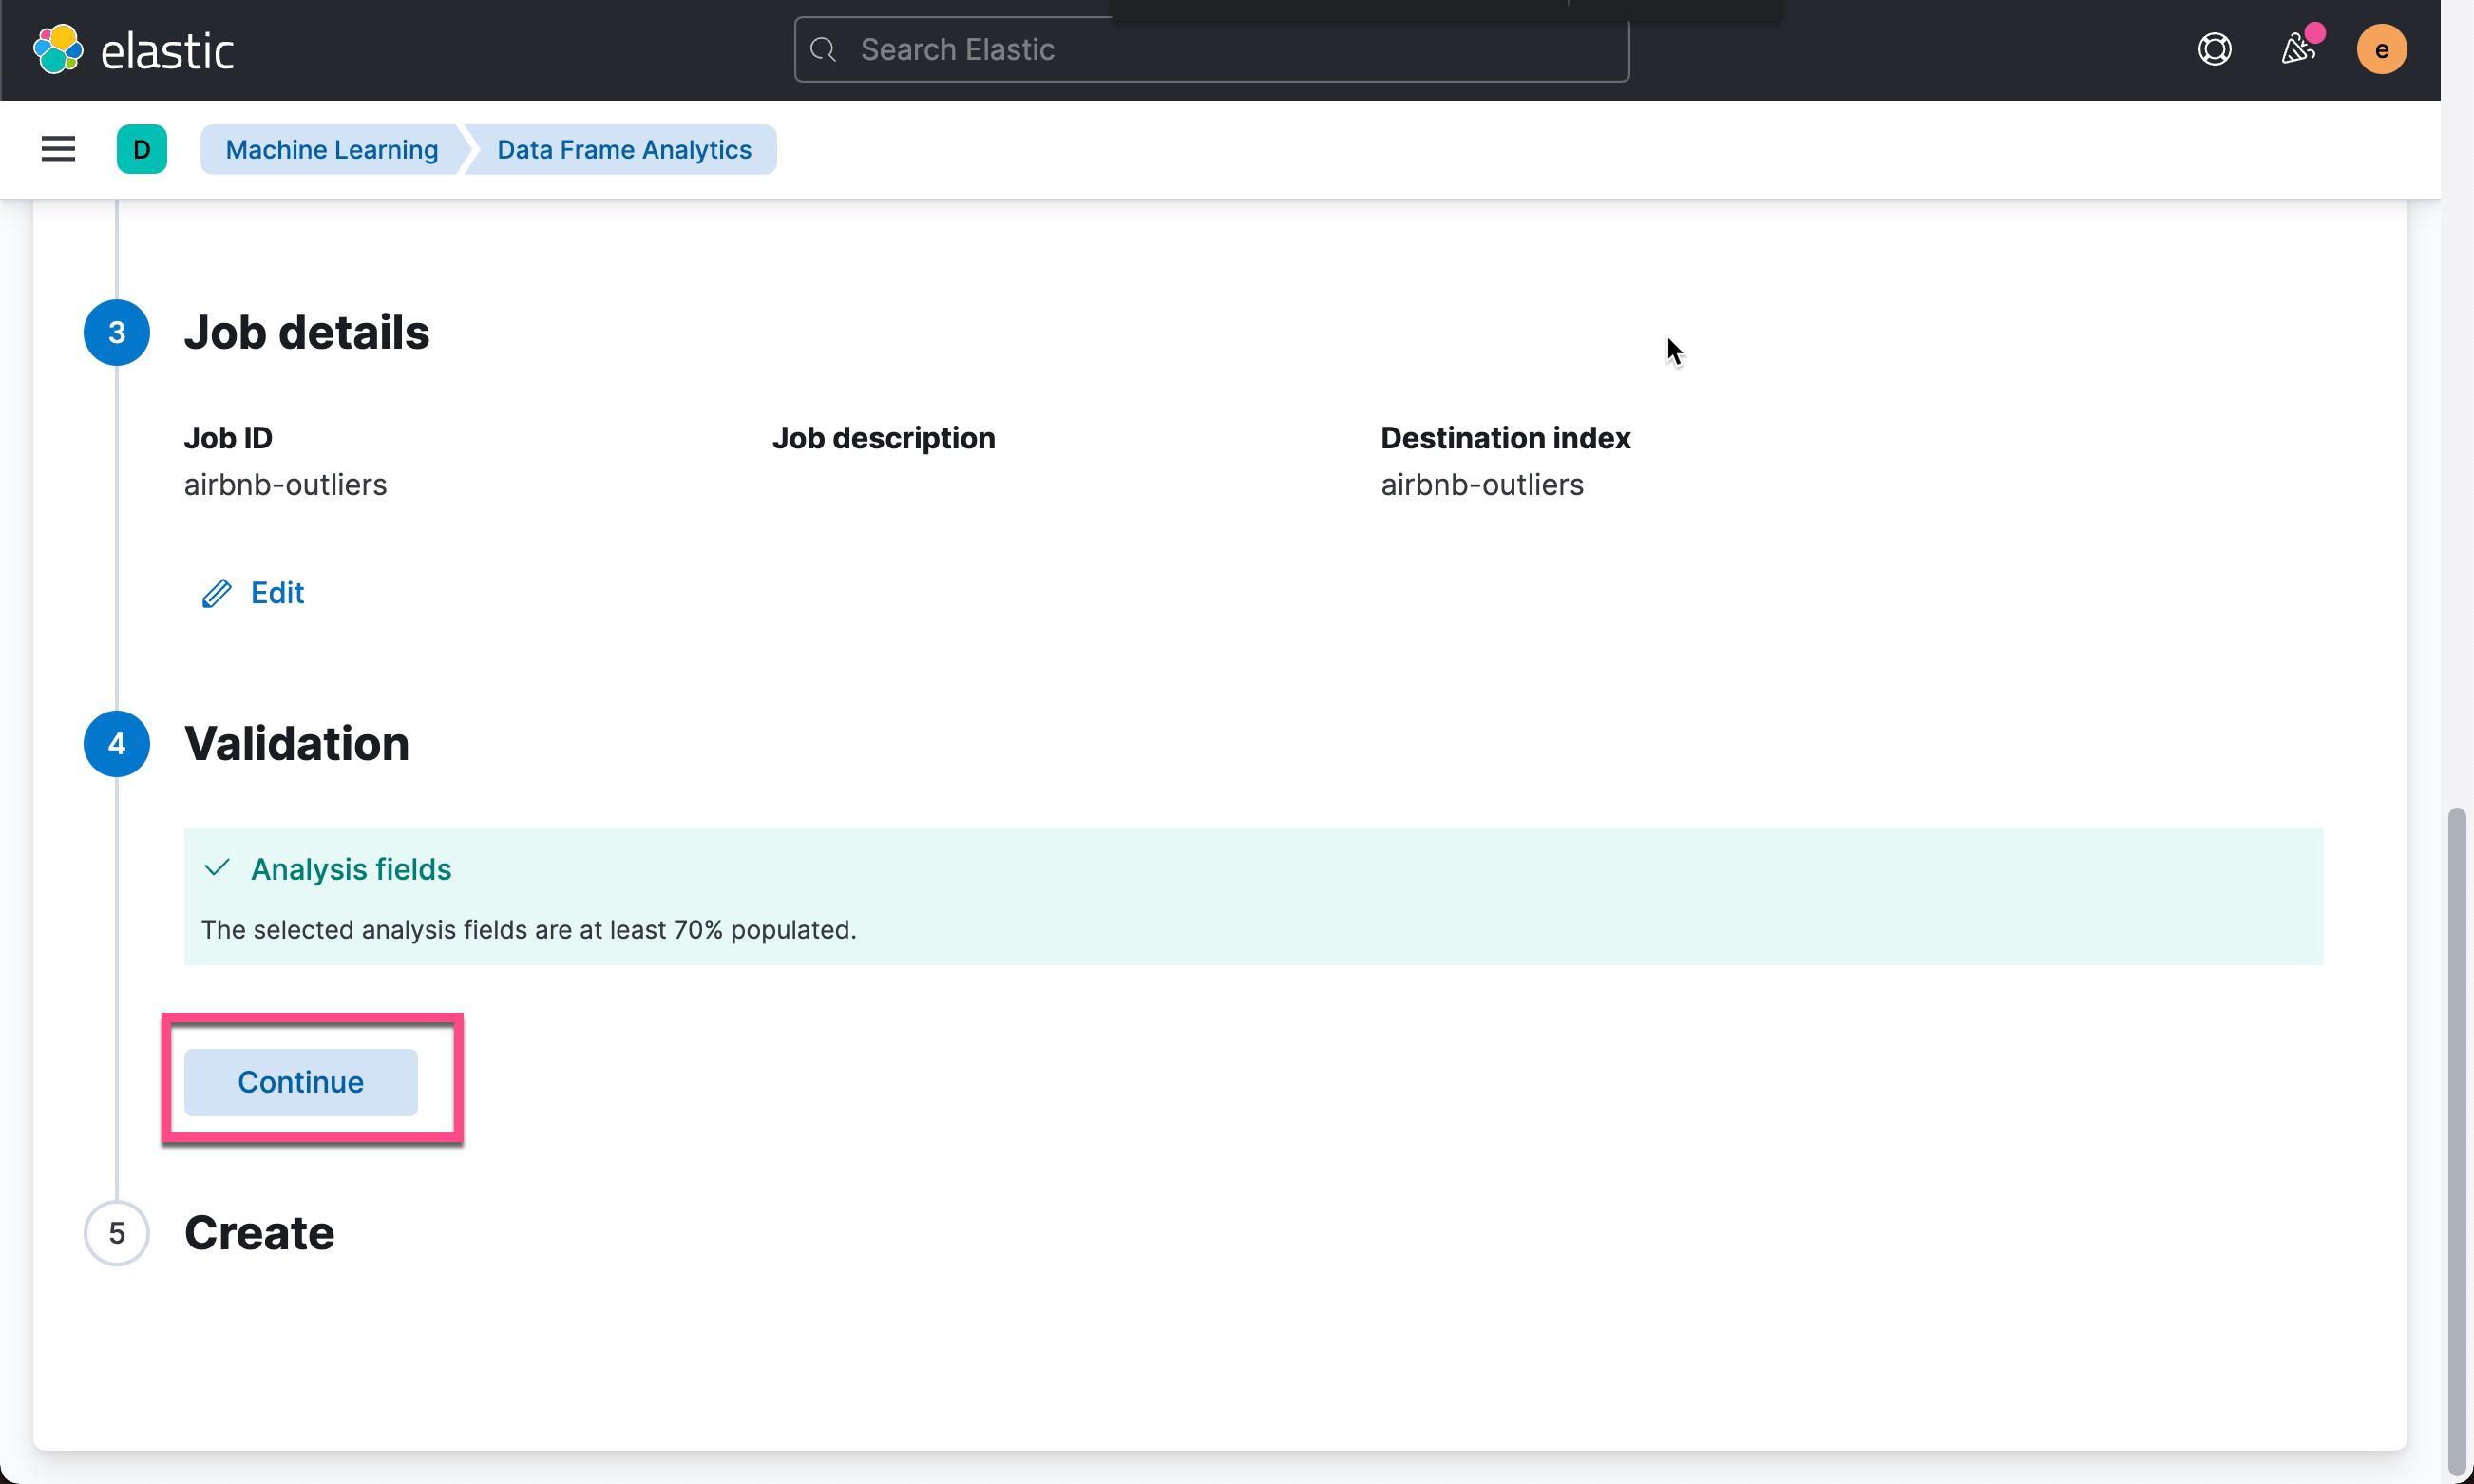
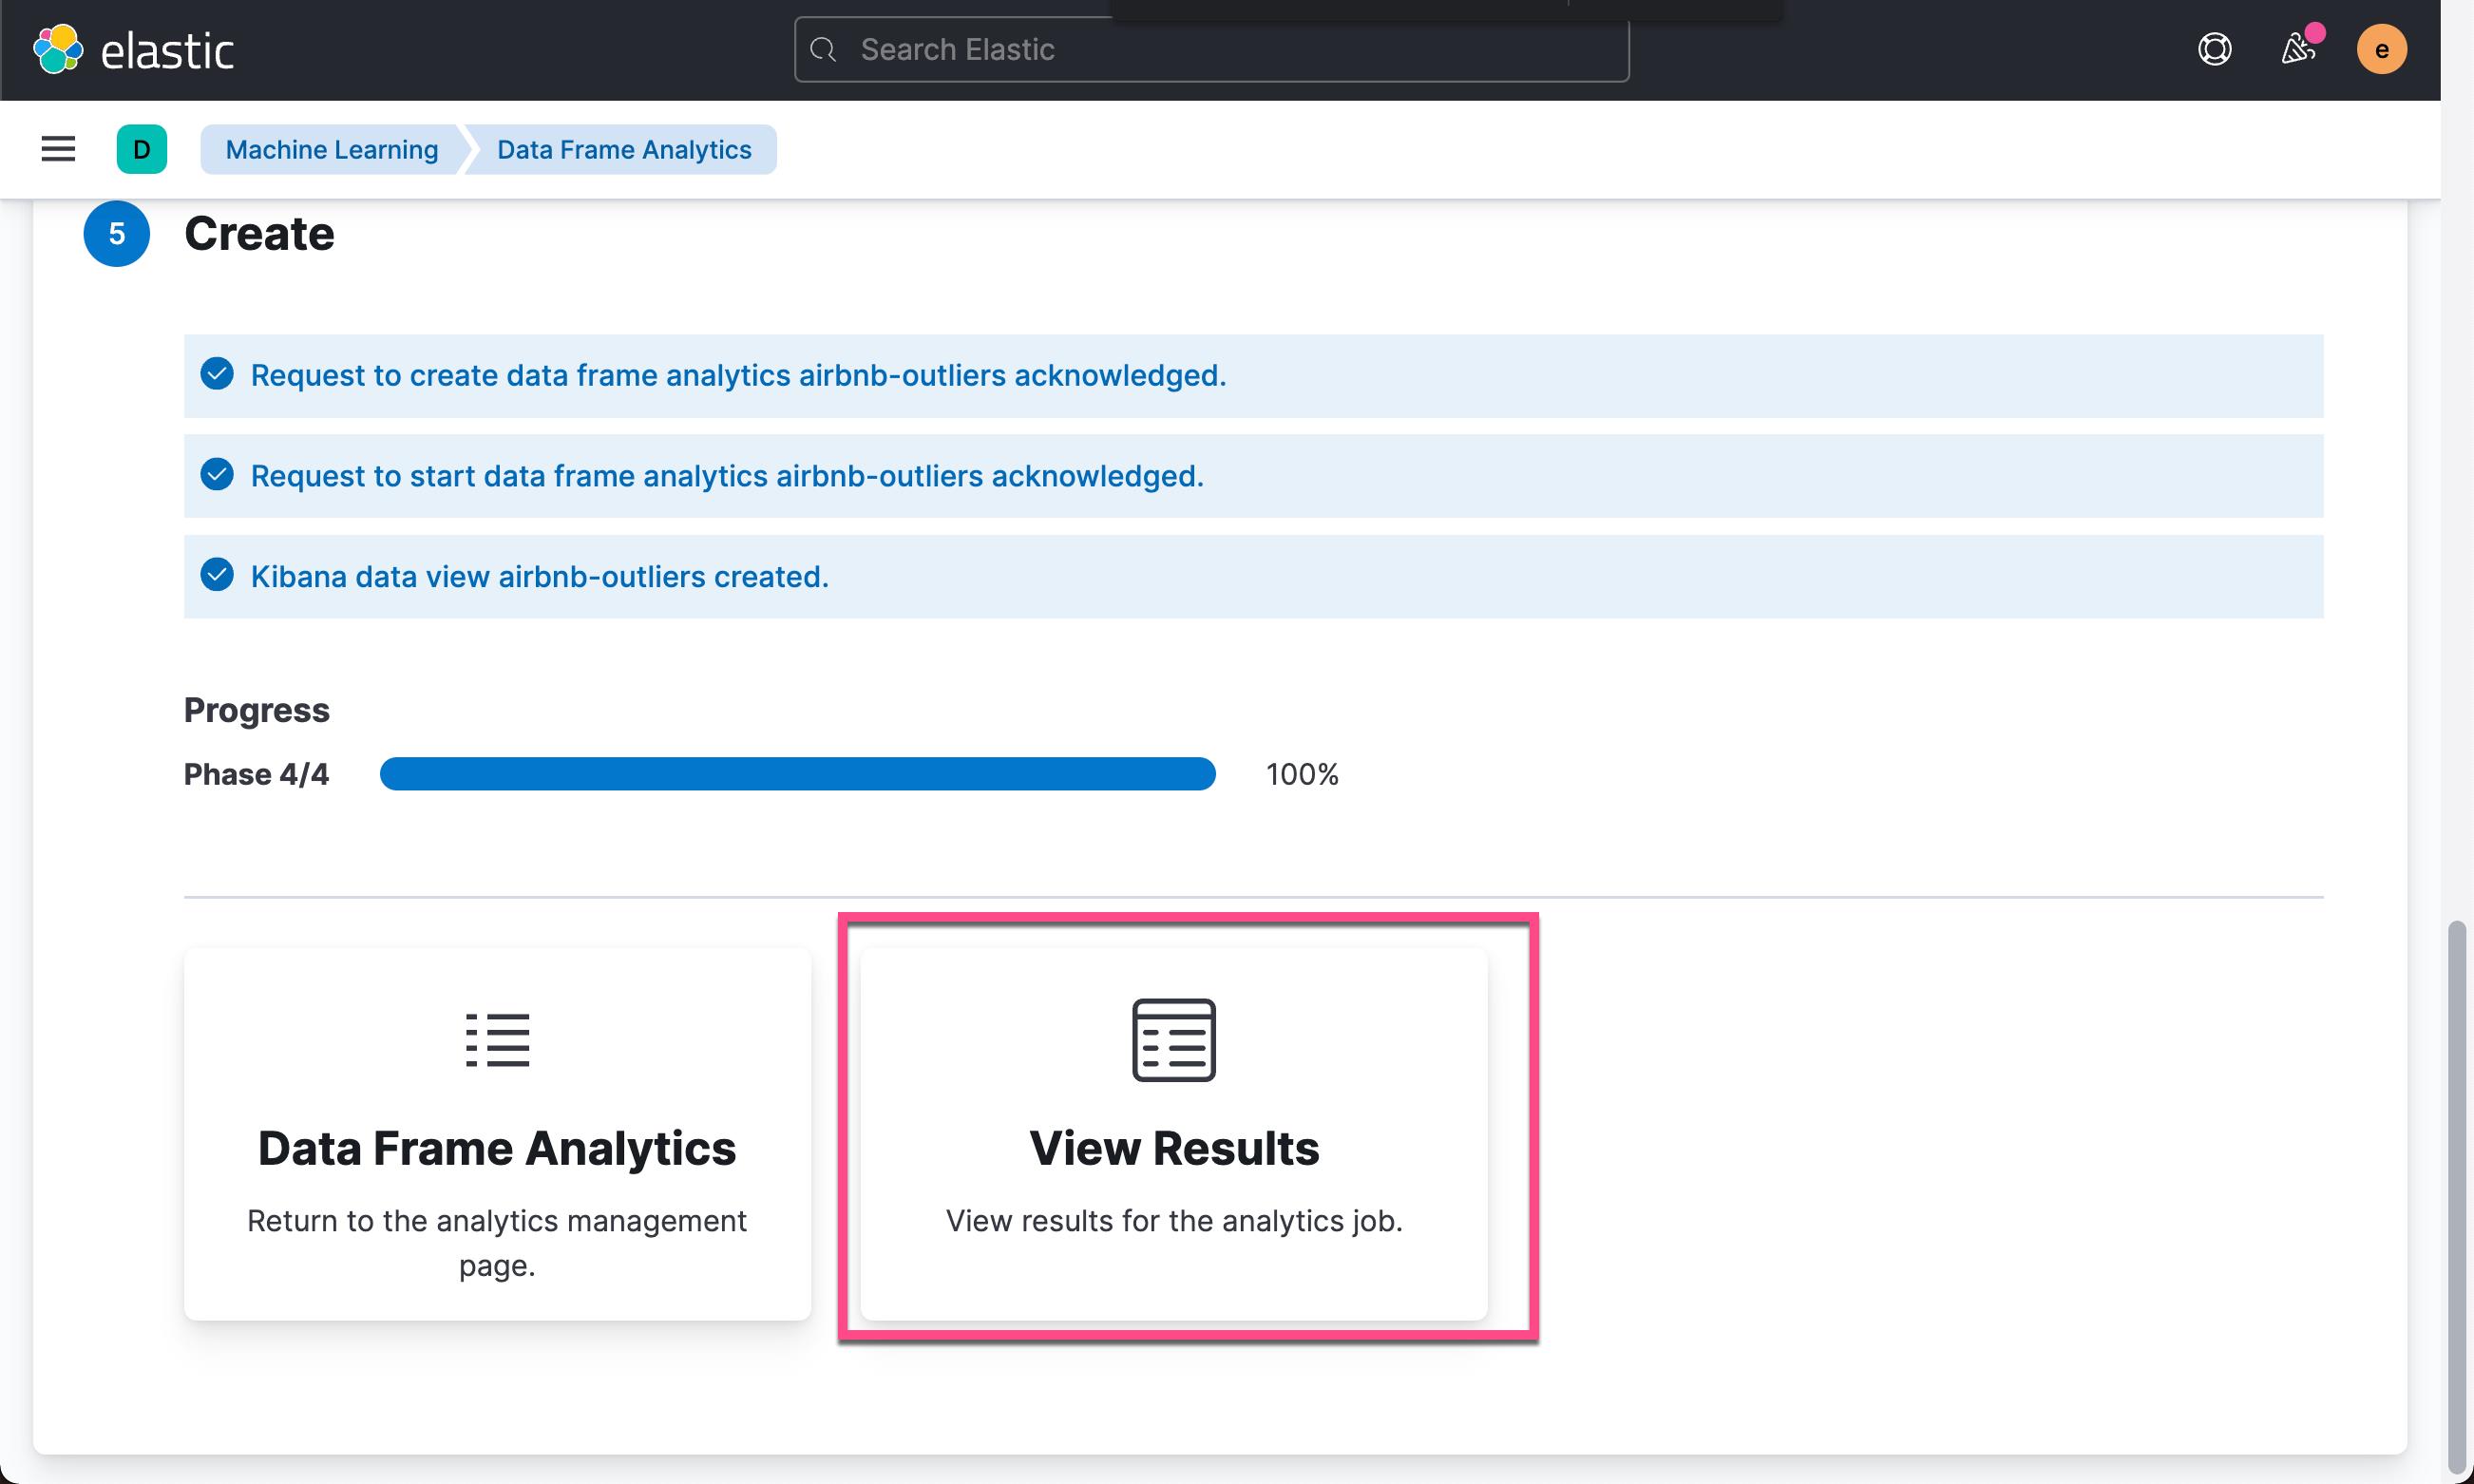
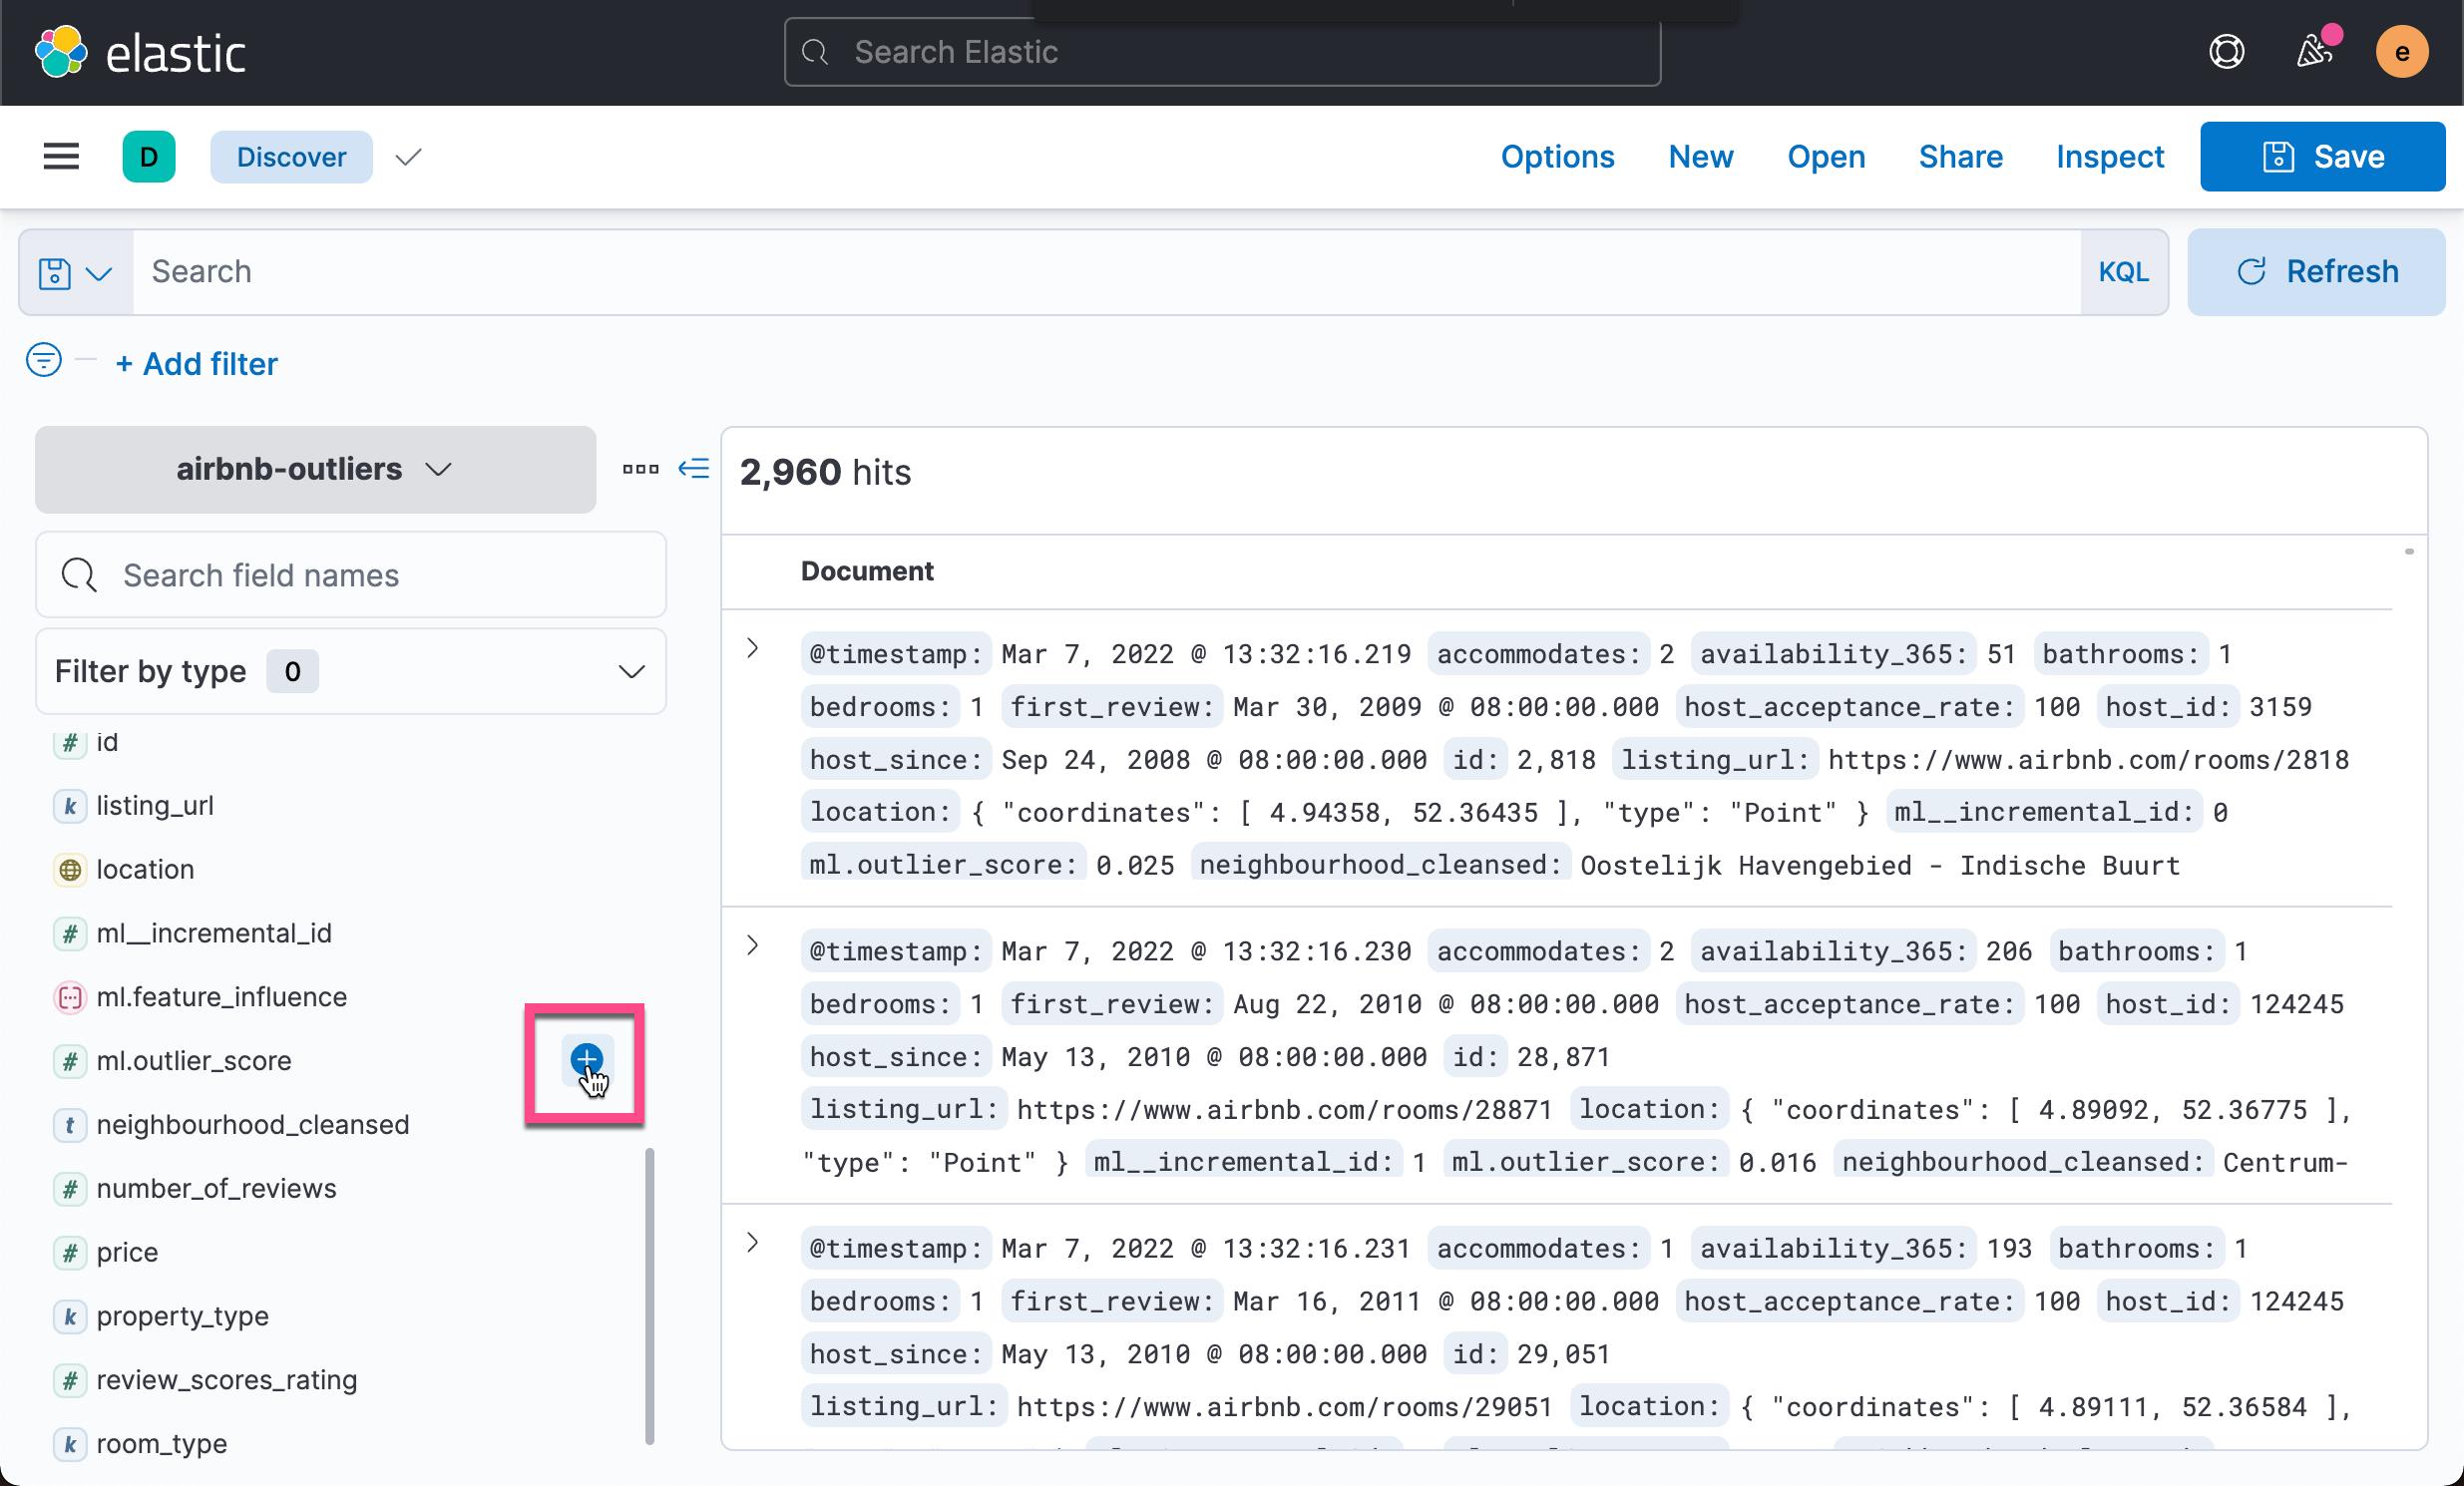
在上面的过程中,它生成了一个叫做 airbnb-outliers 的索引。我们重新回到 Discover 界面:

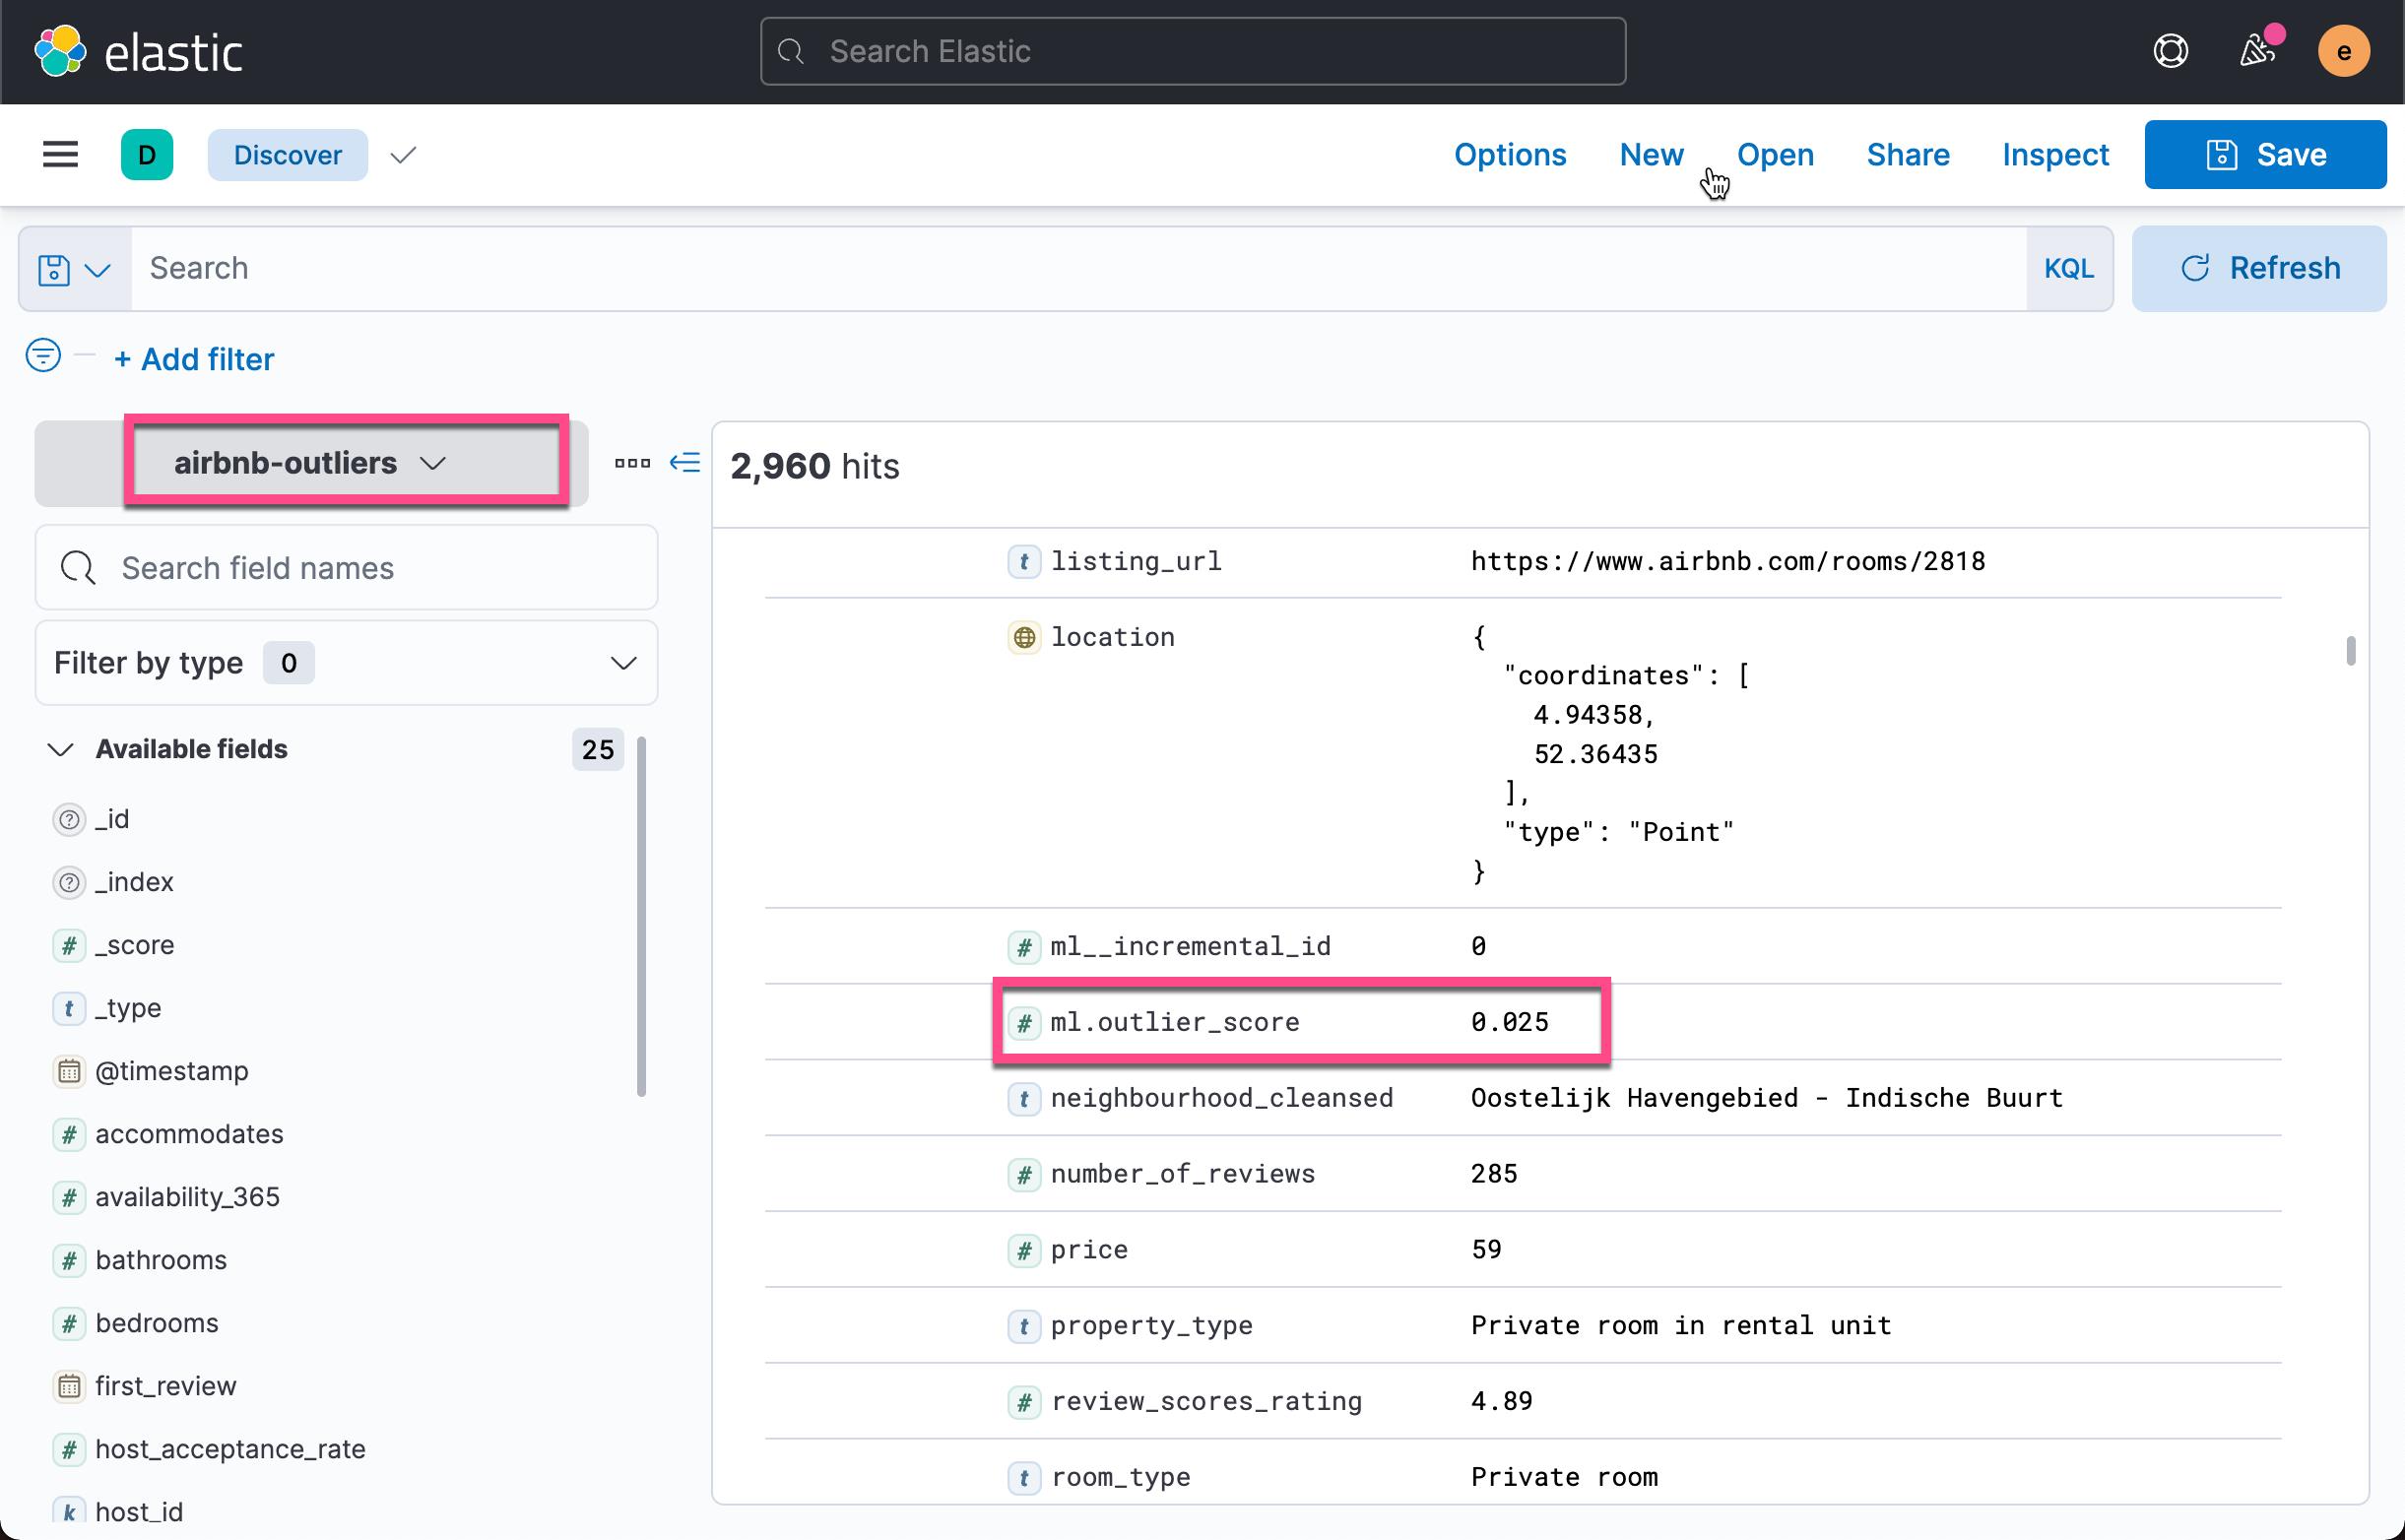
从上面的文档中,我们可以看出来,这个新生成的索引含有一项叫做 ml.outlier_score 的字段。它代表这个数据的异常值。
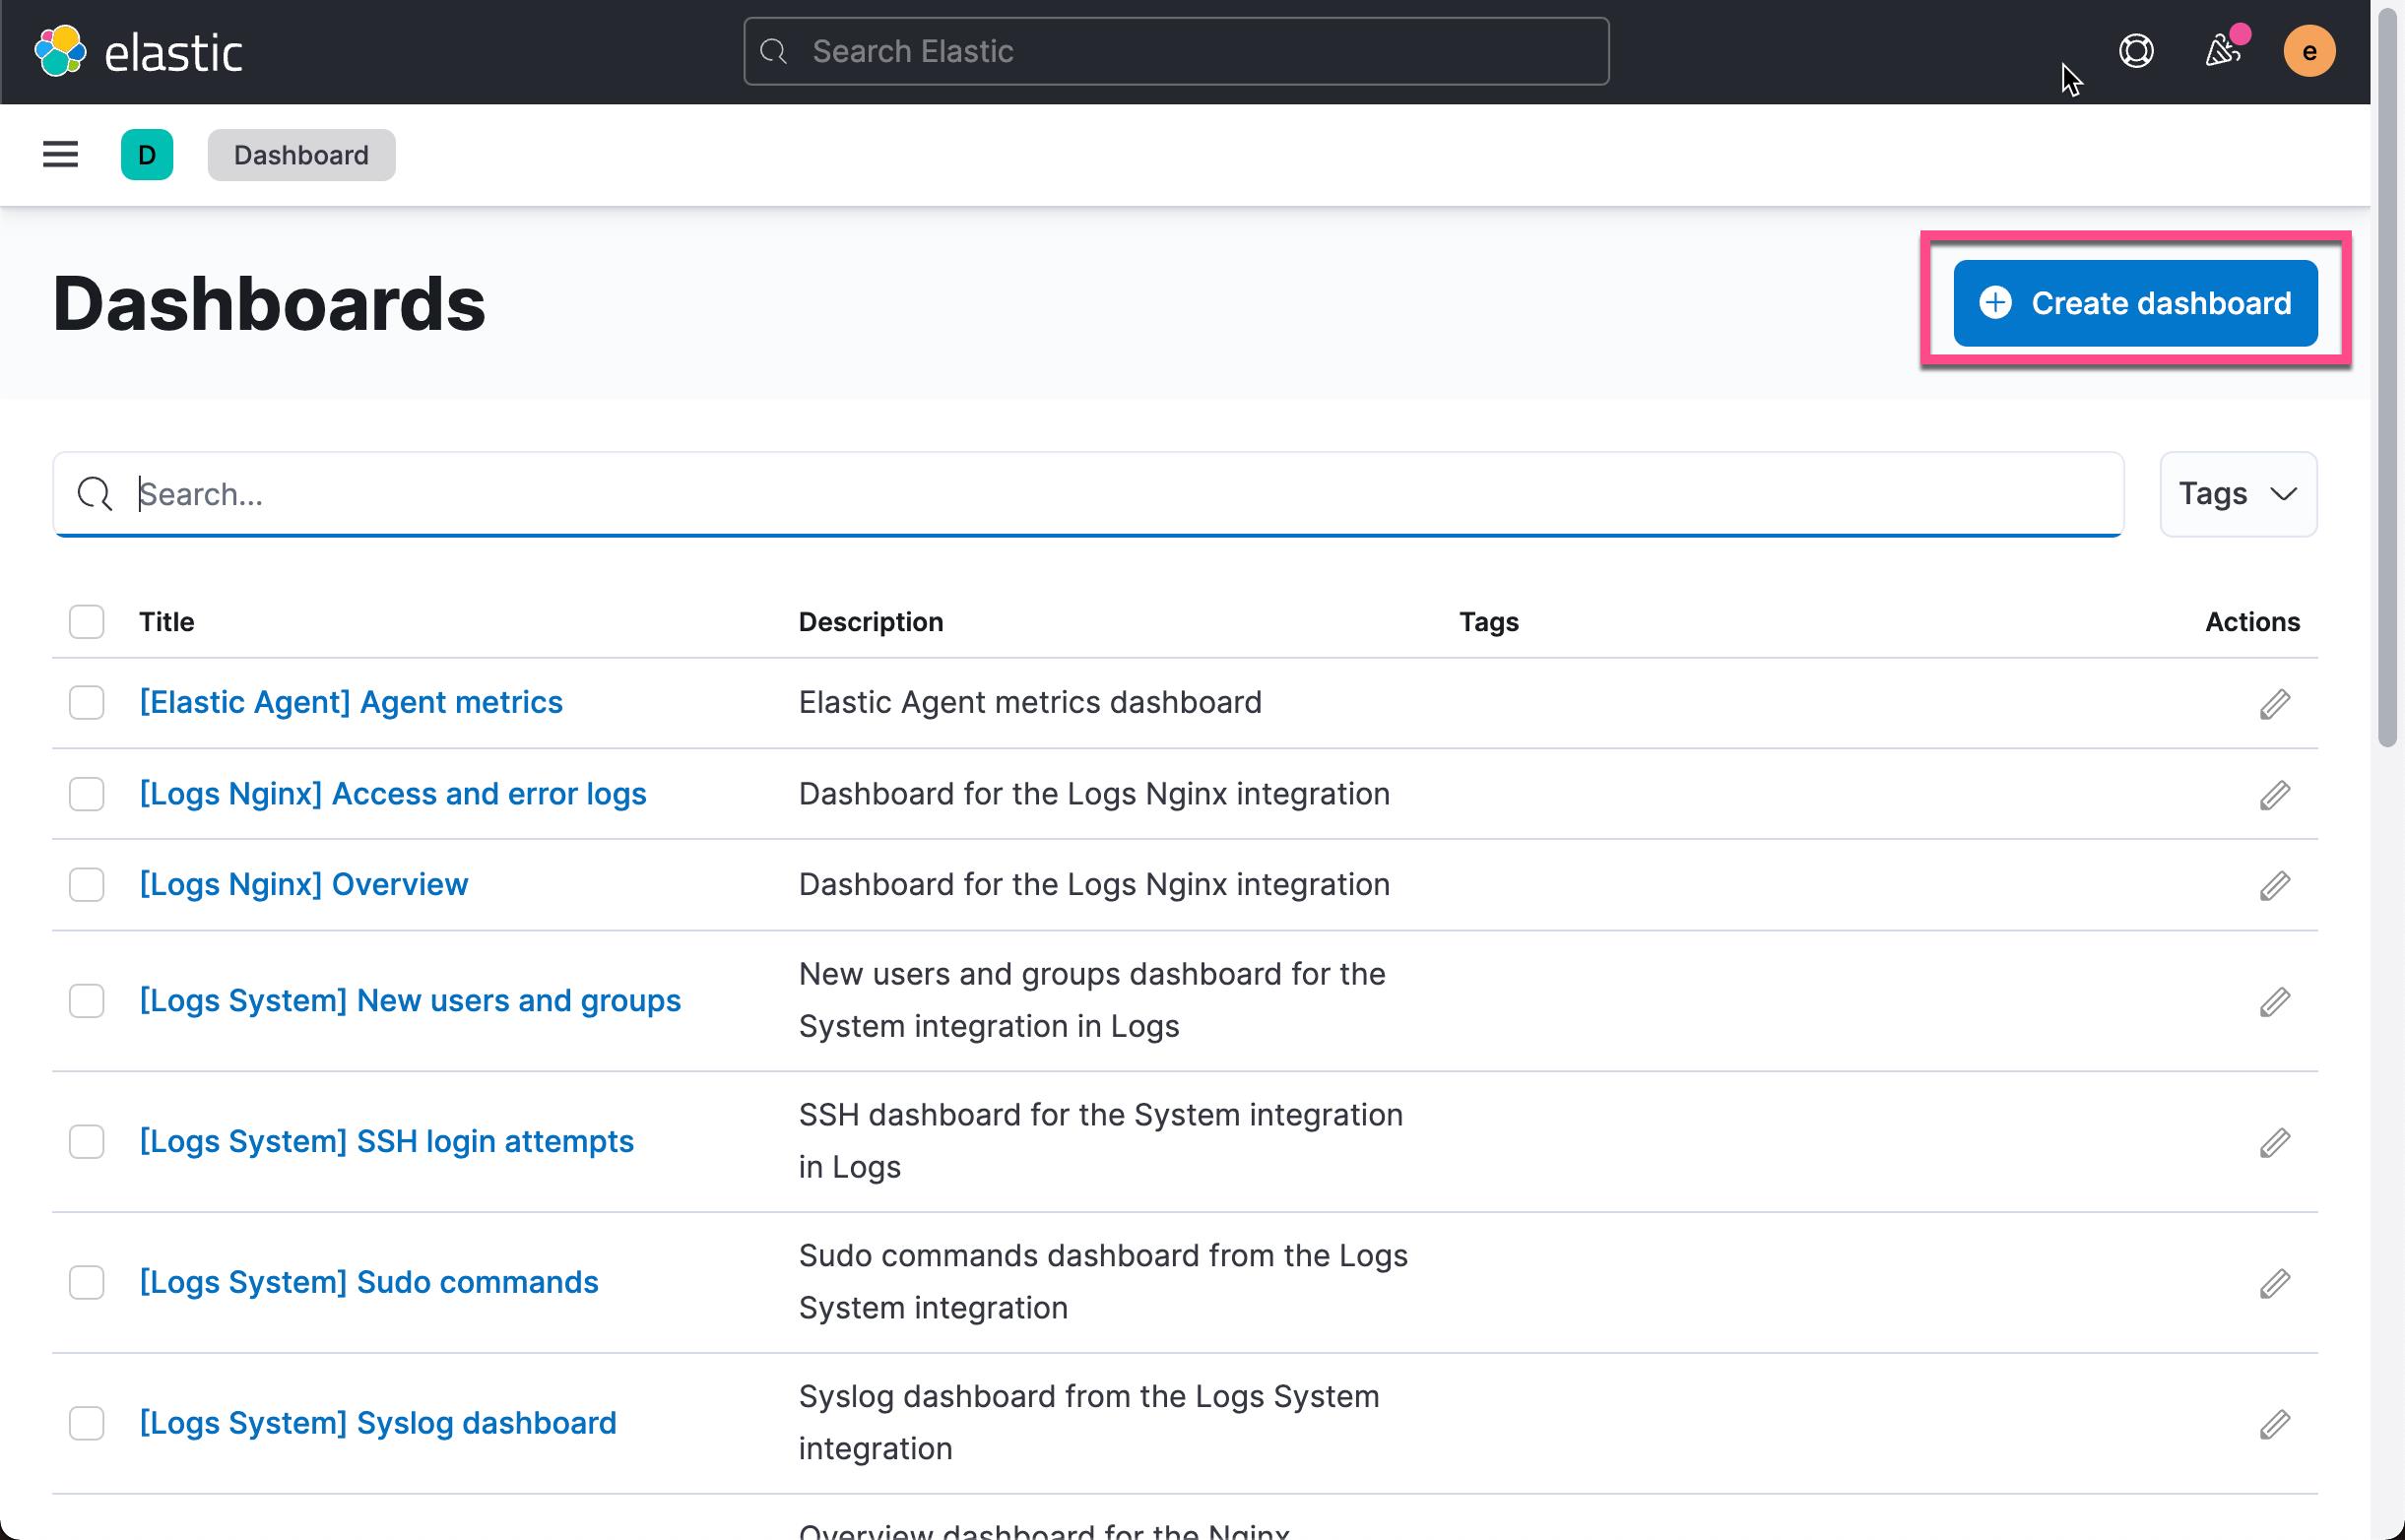
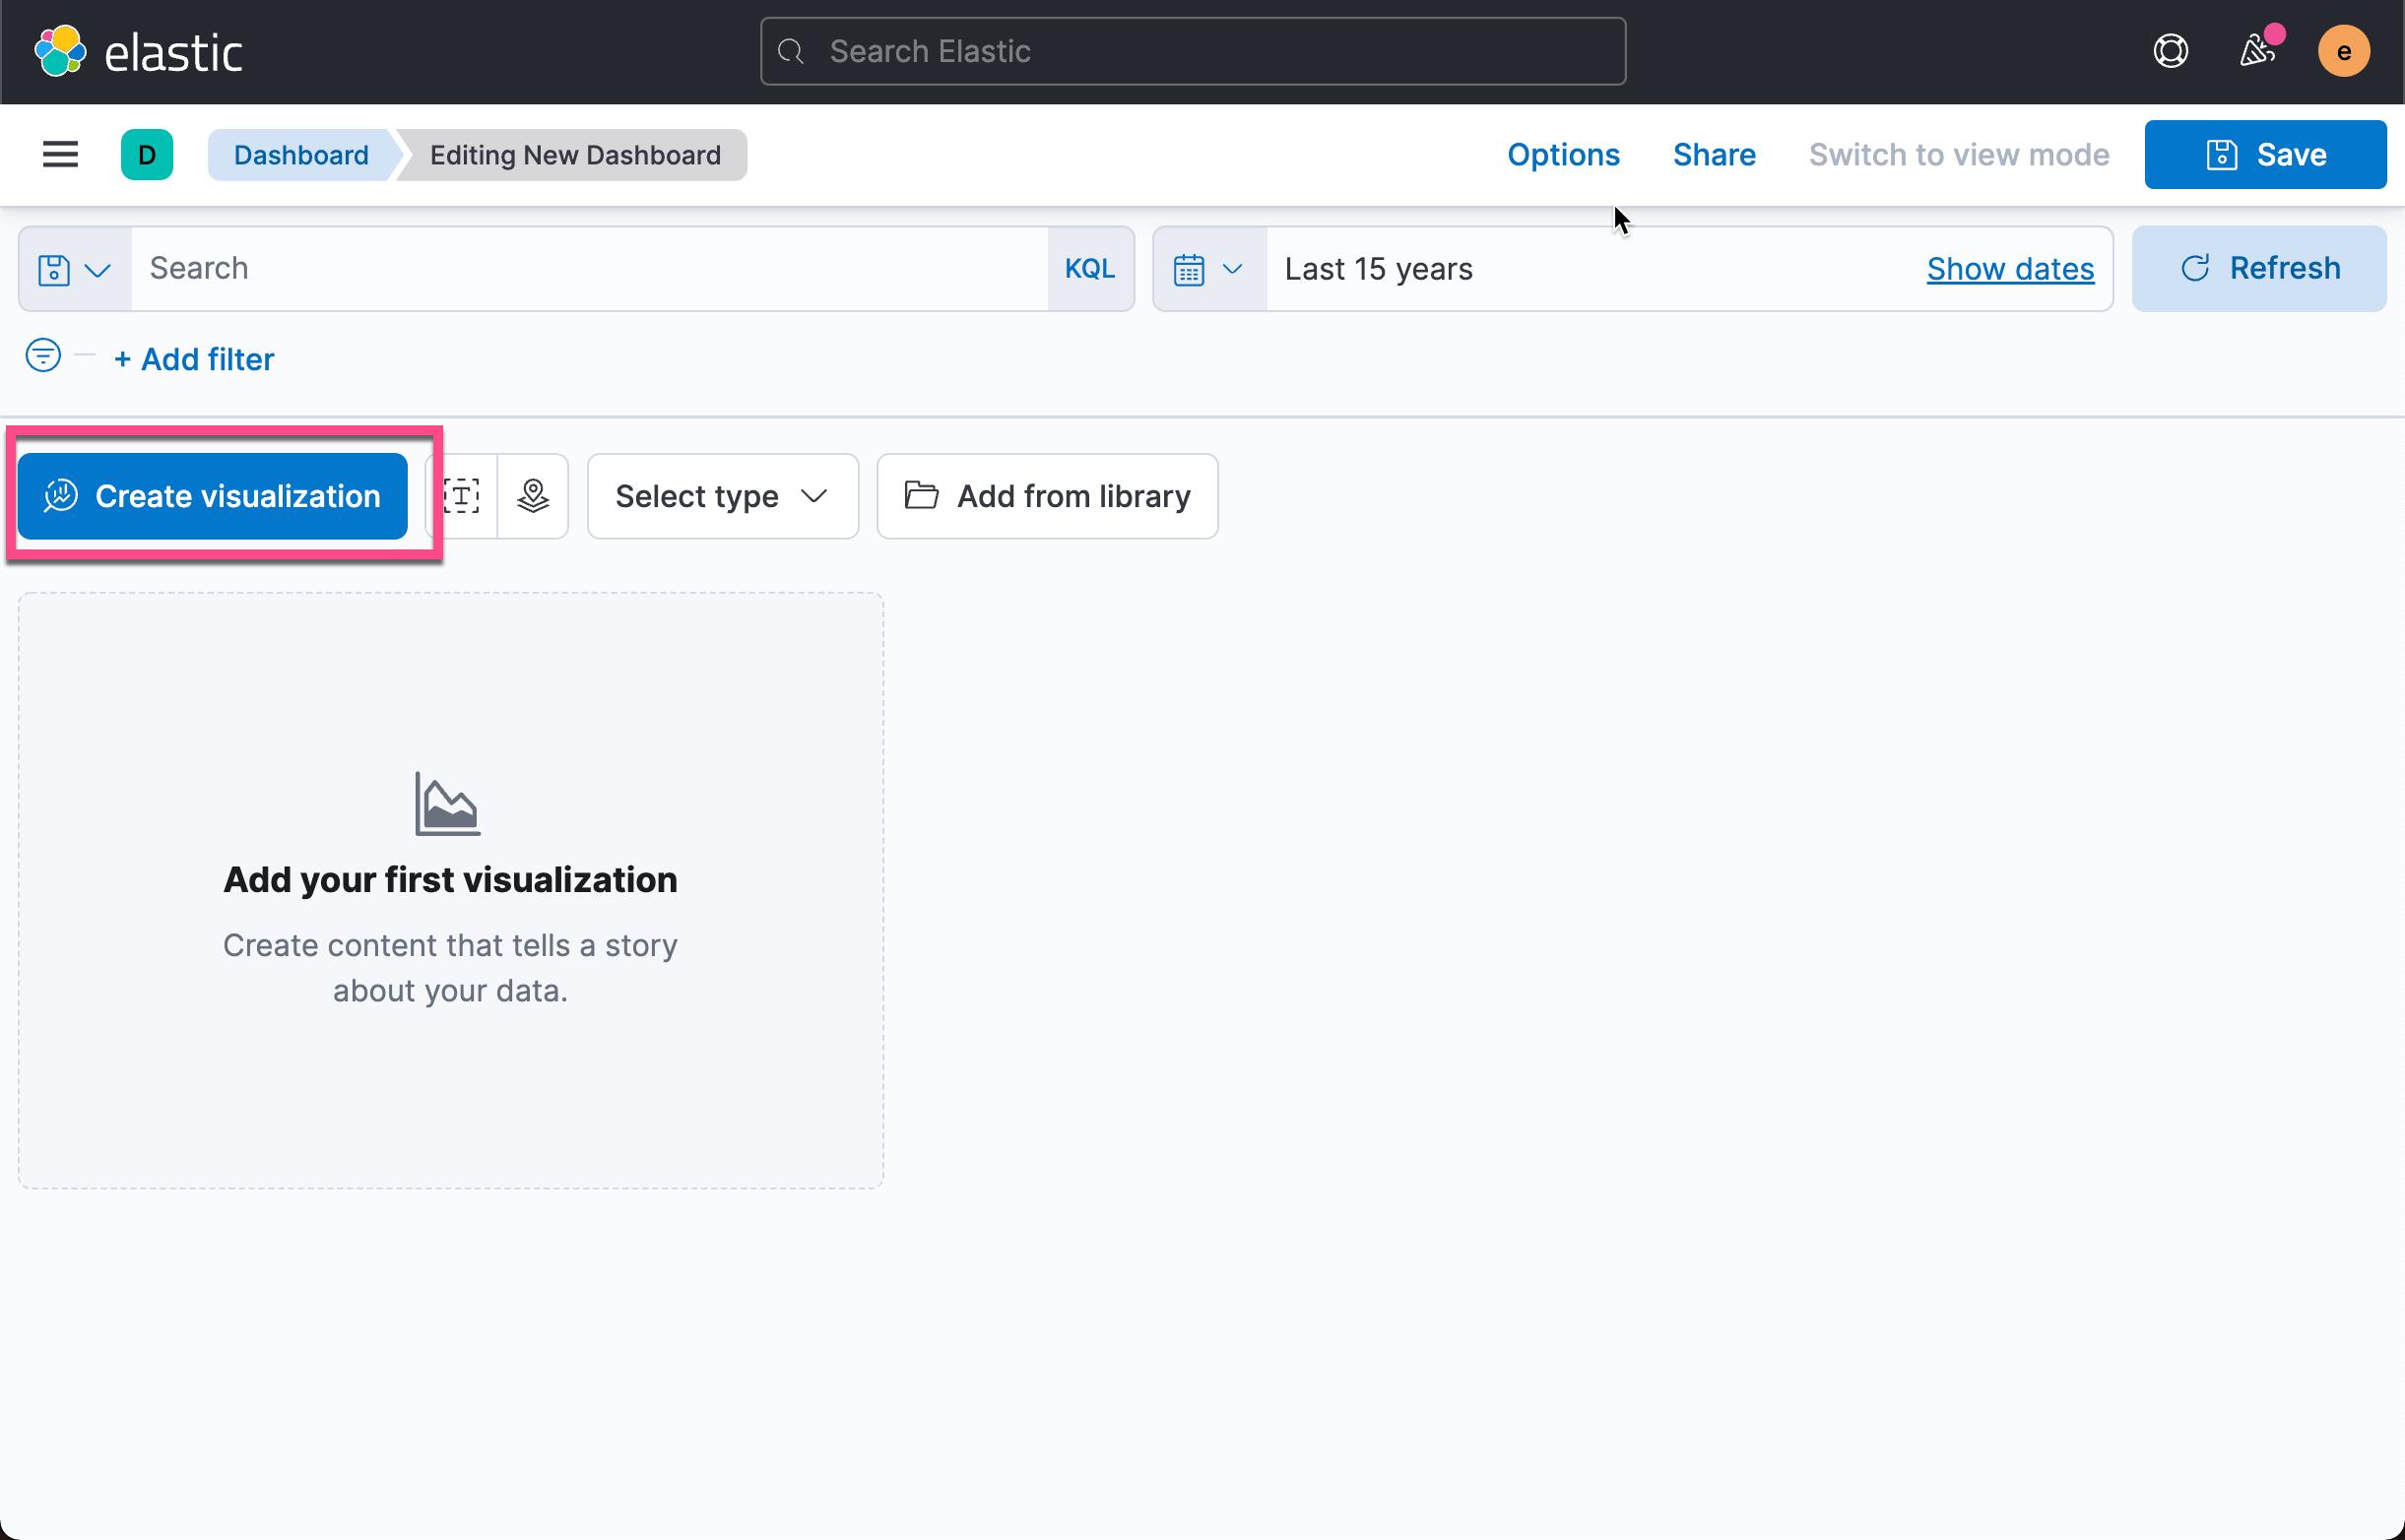
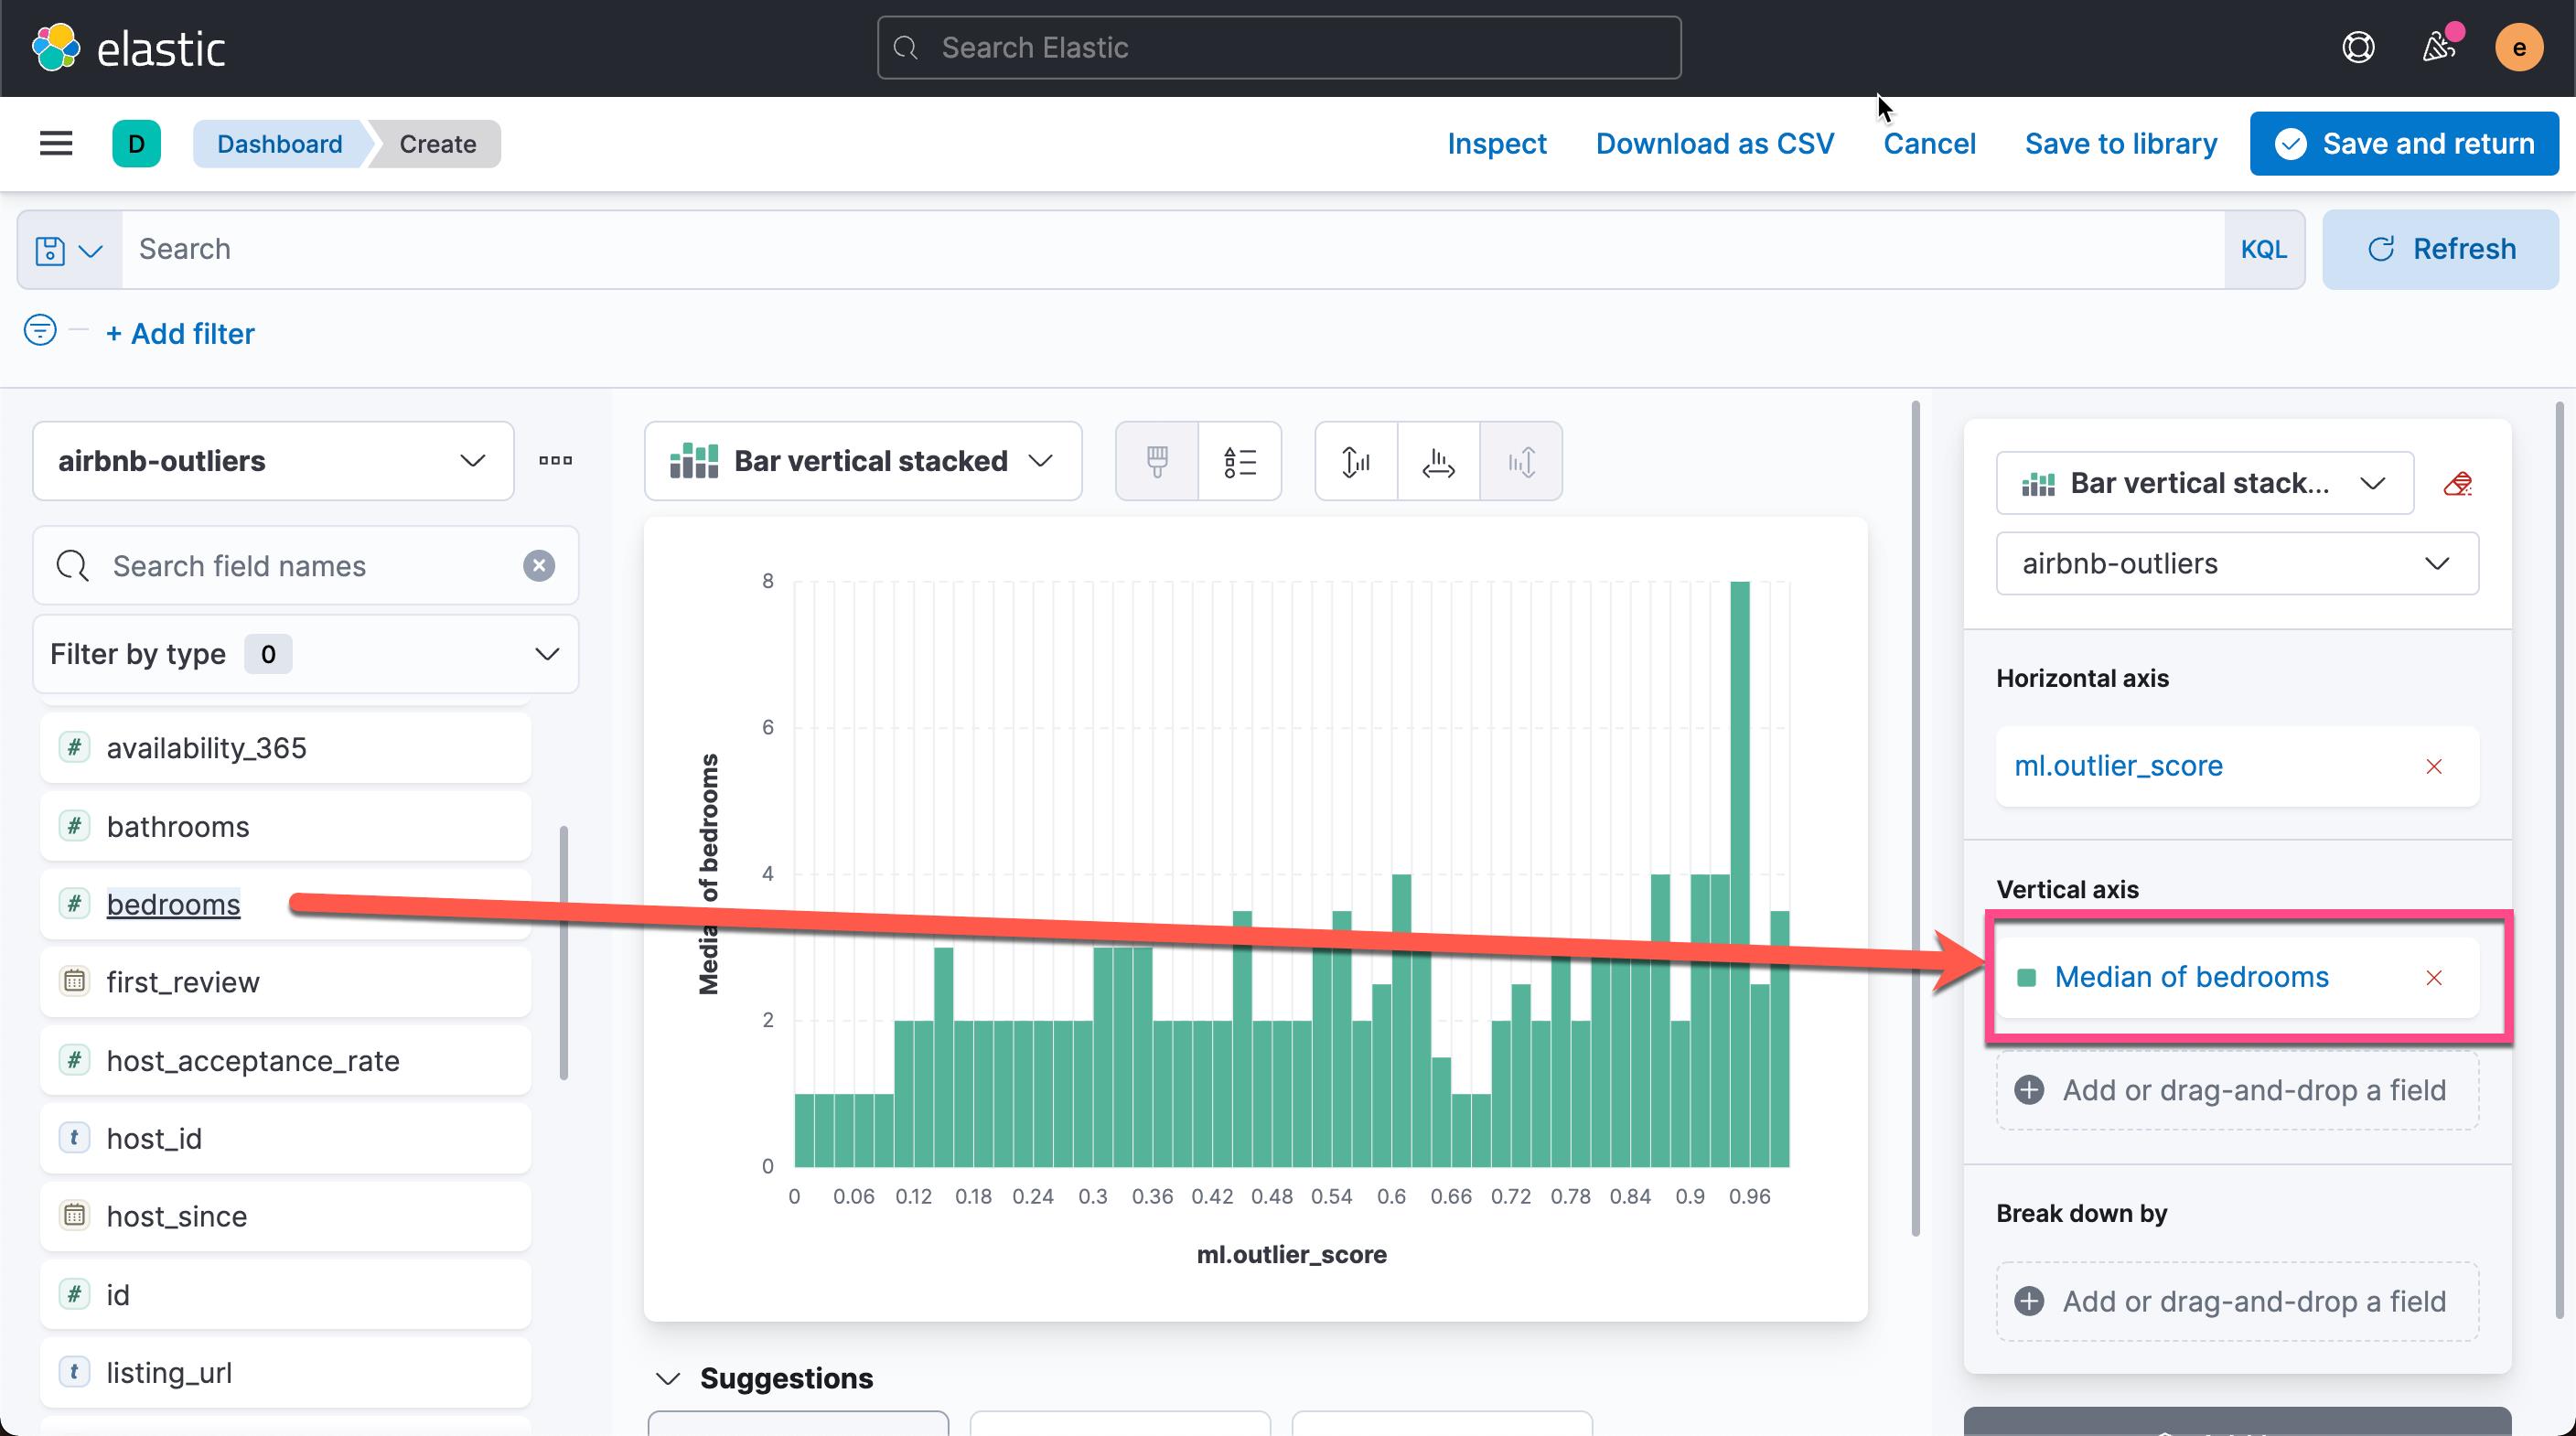
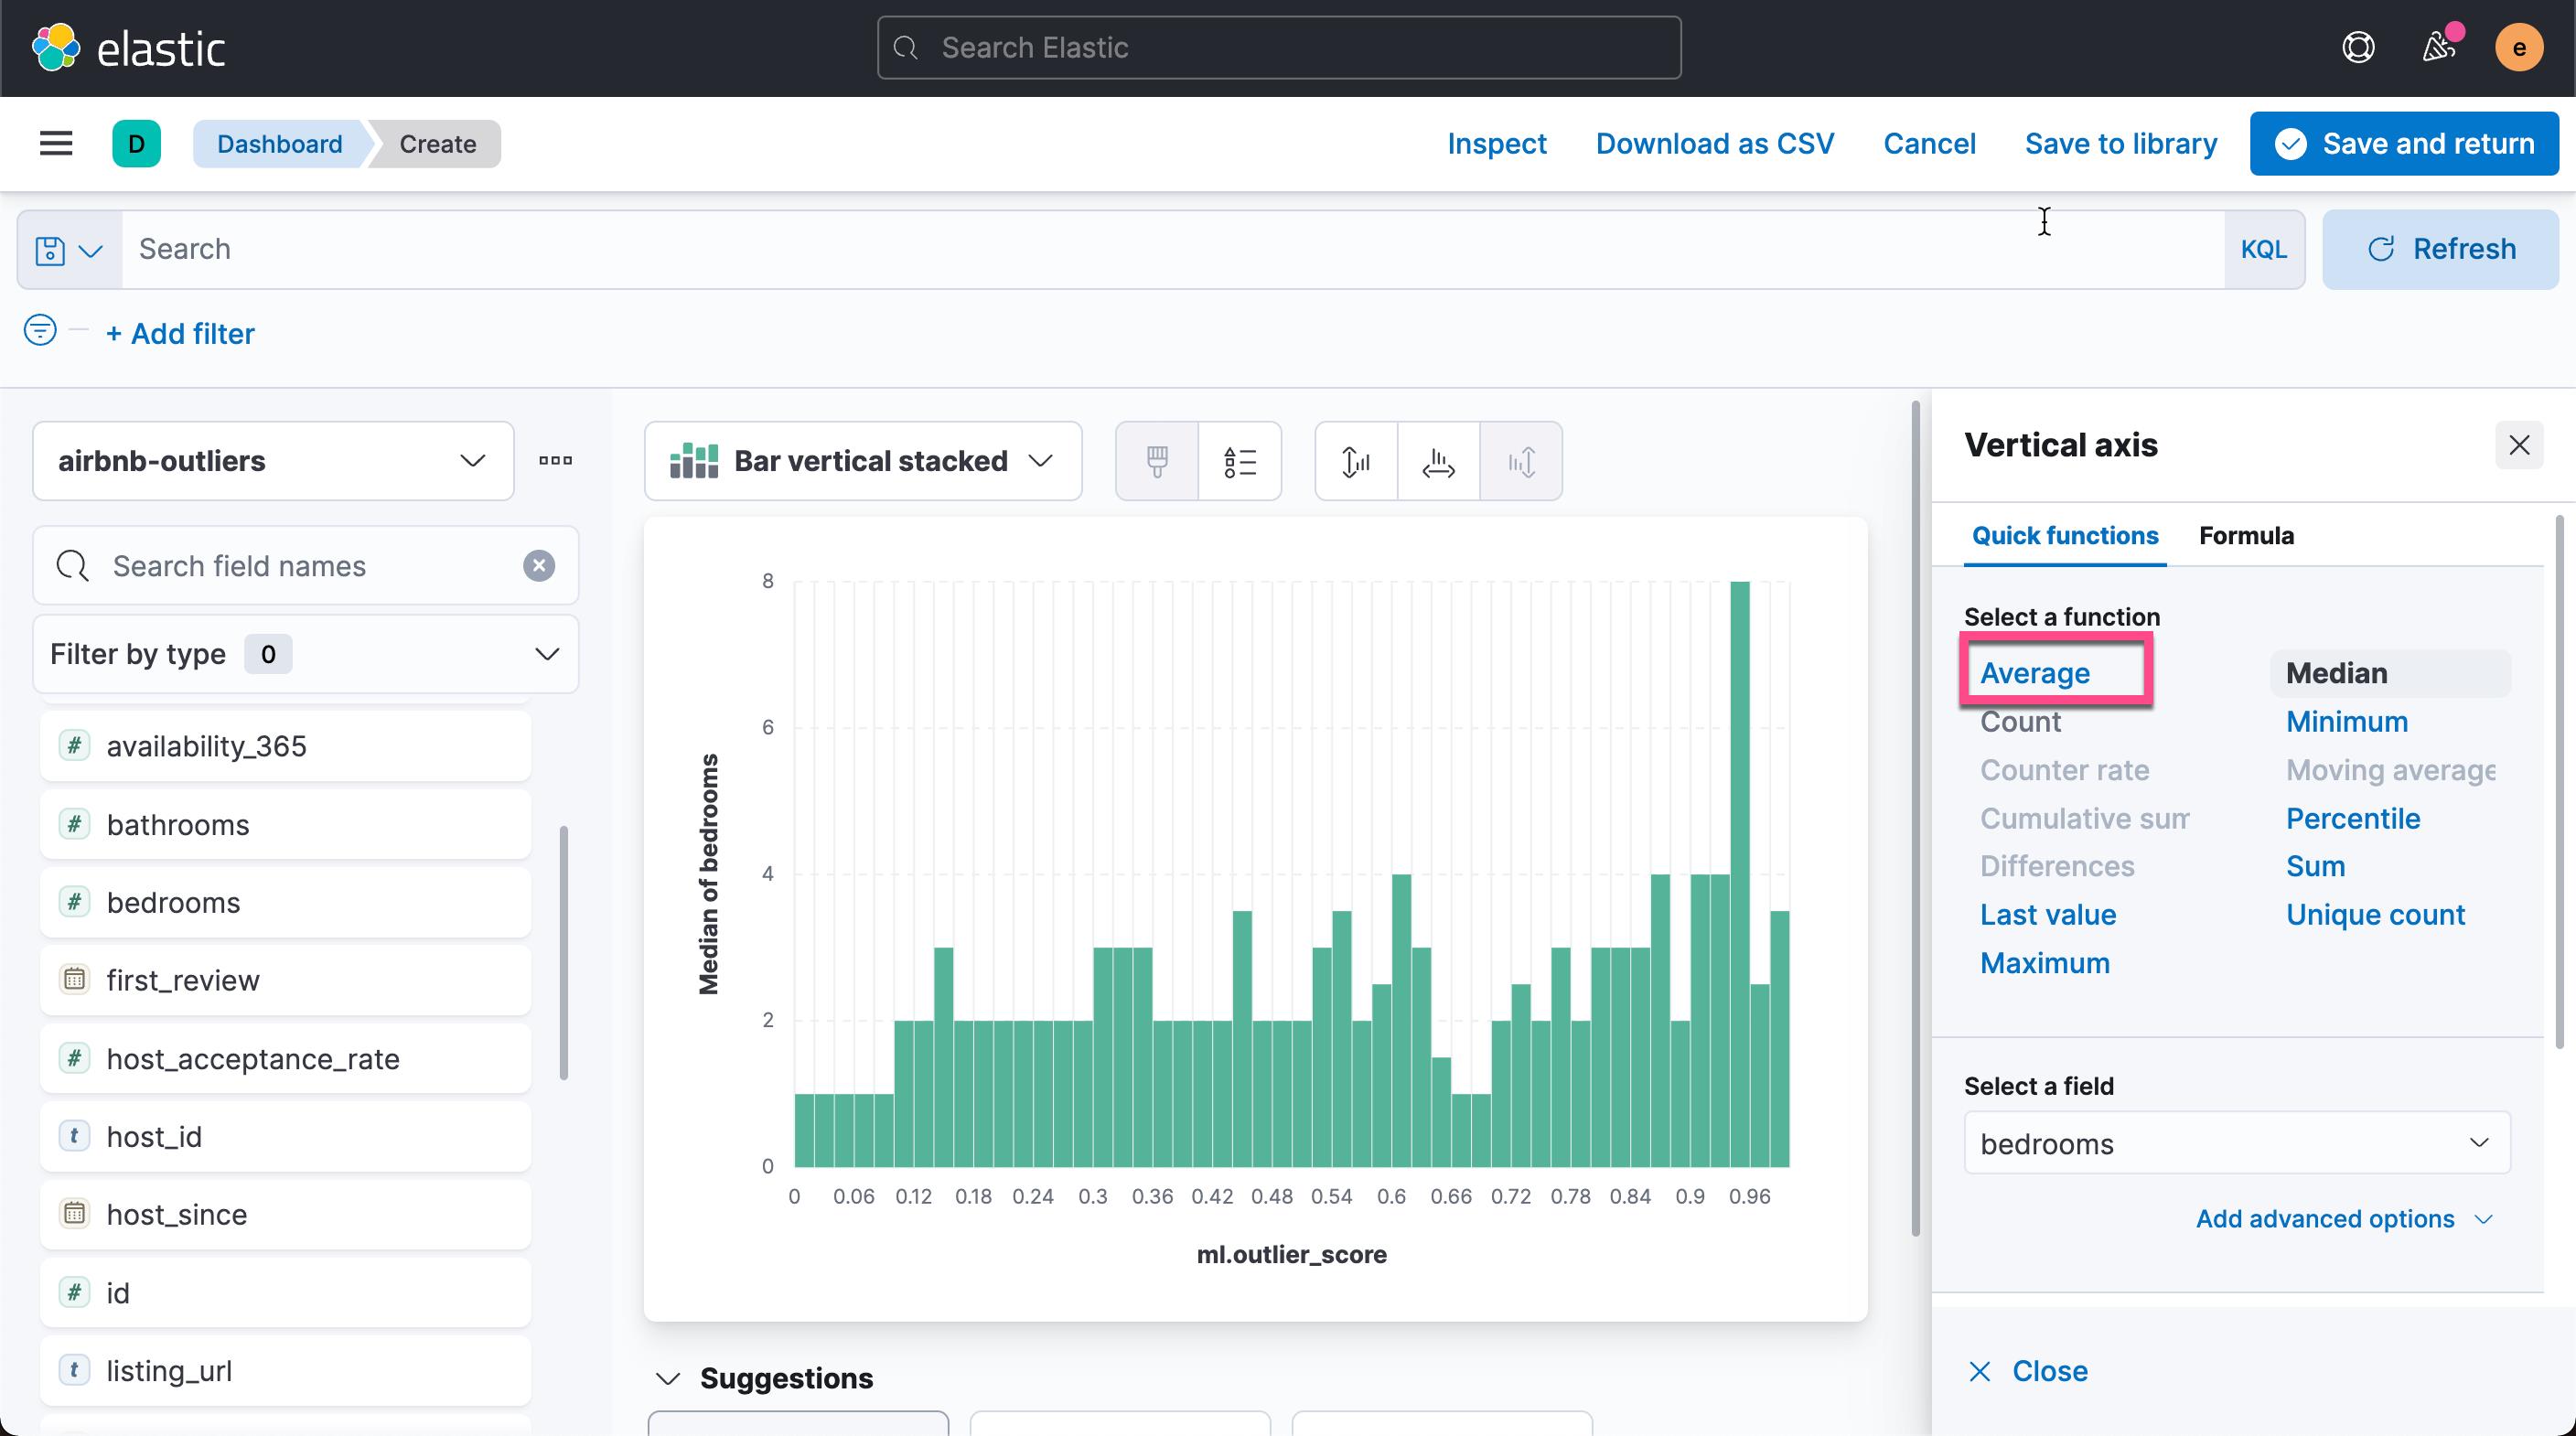
可视化数据
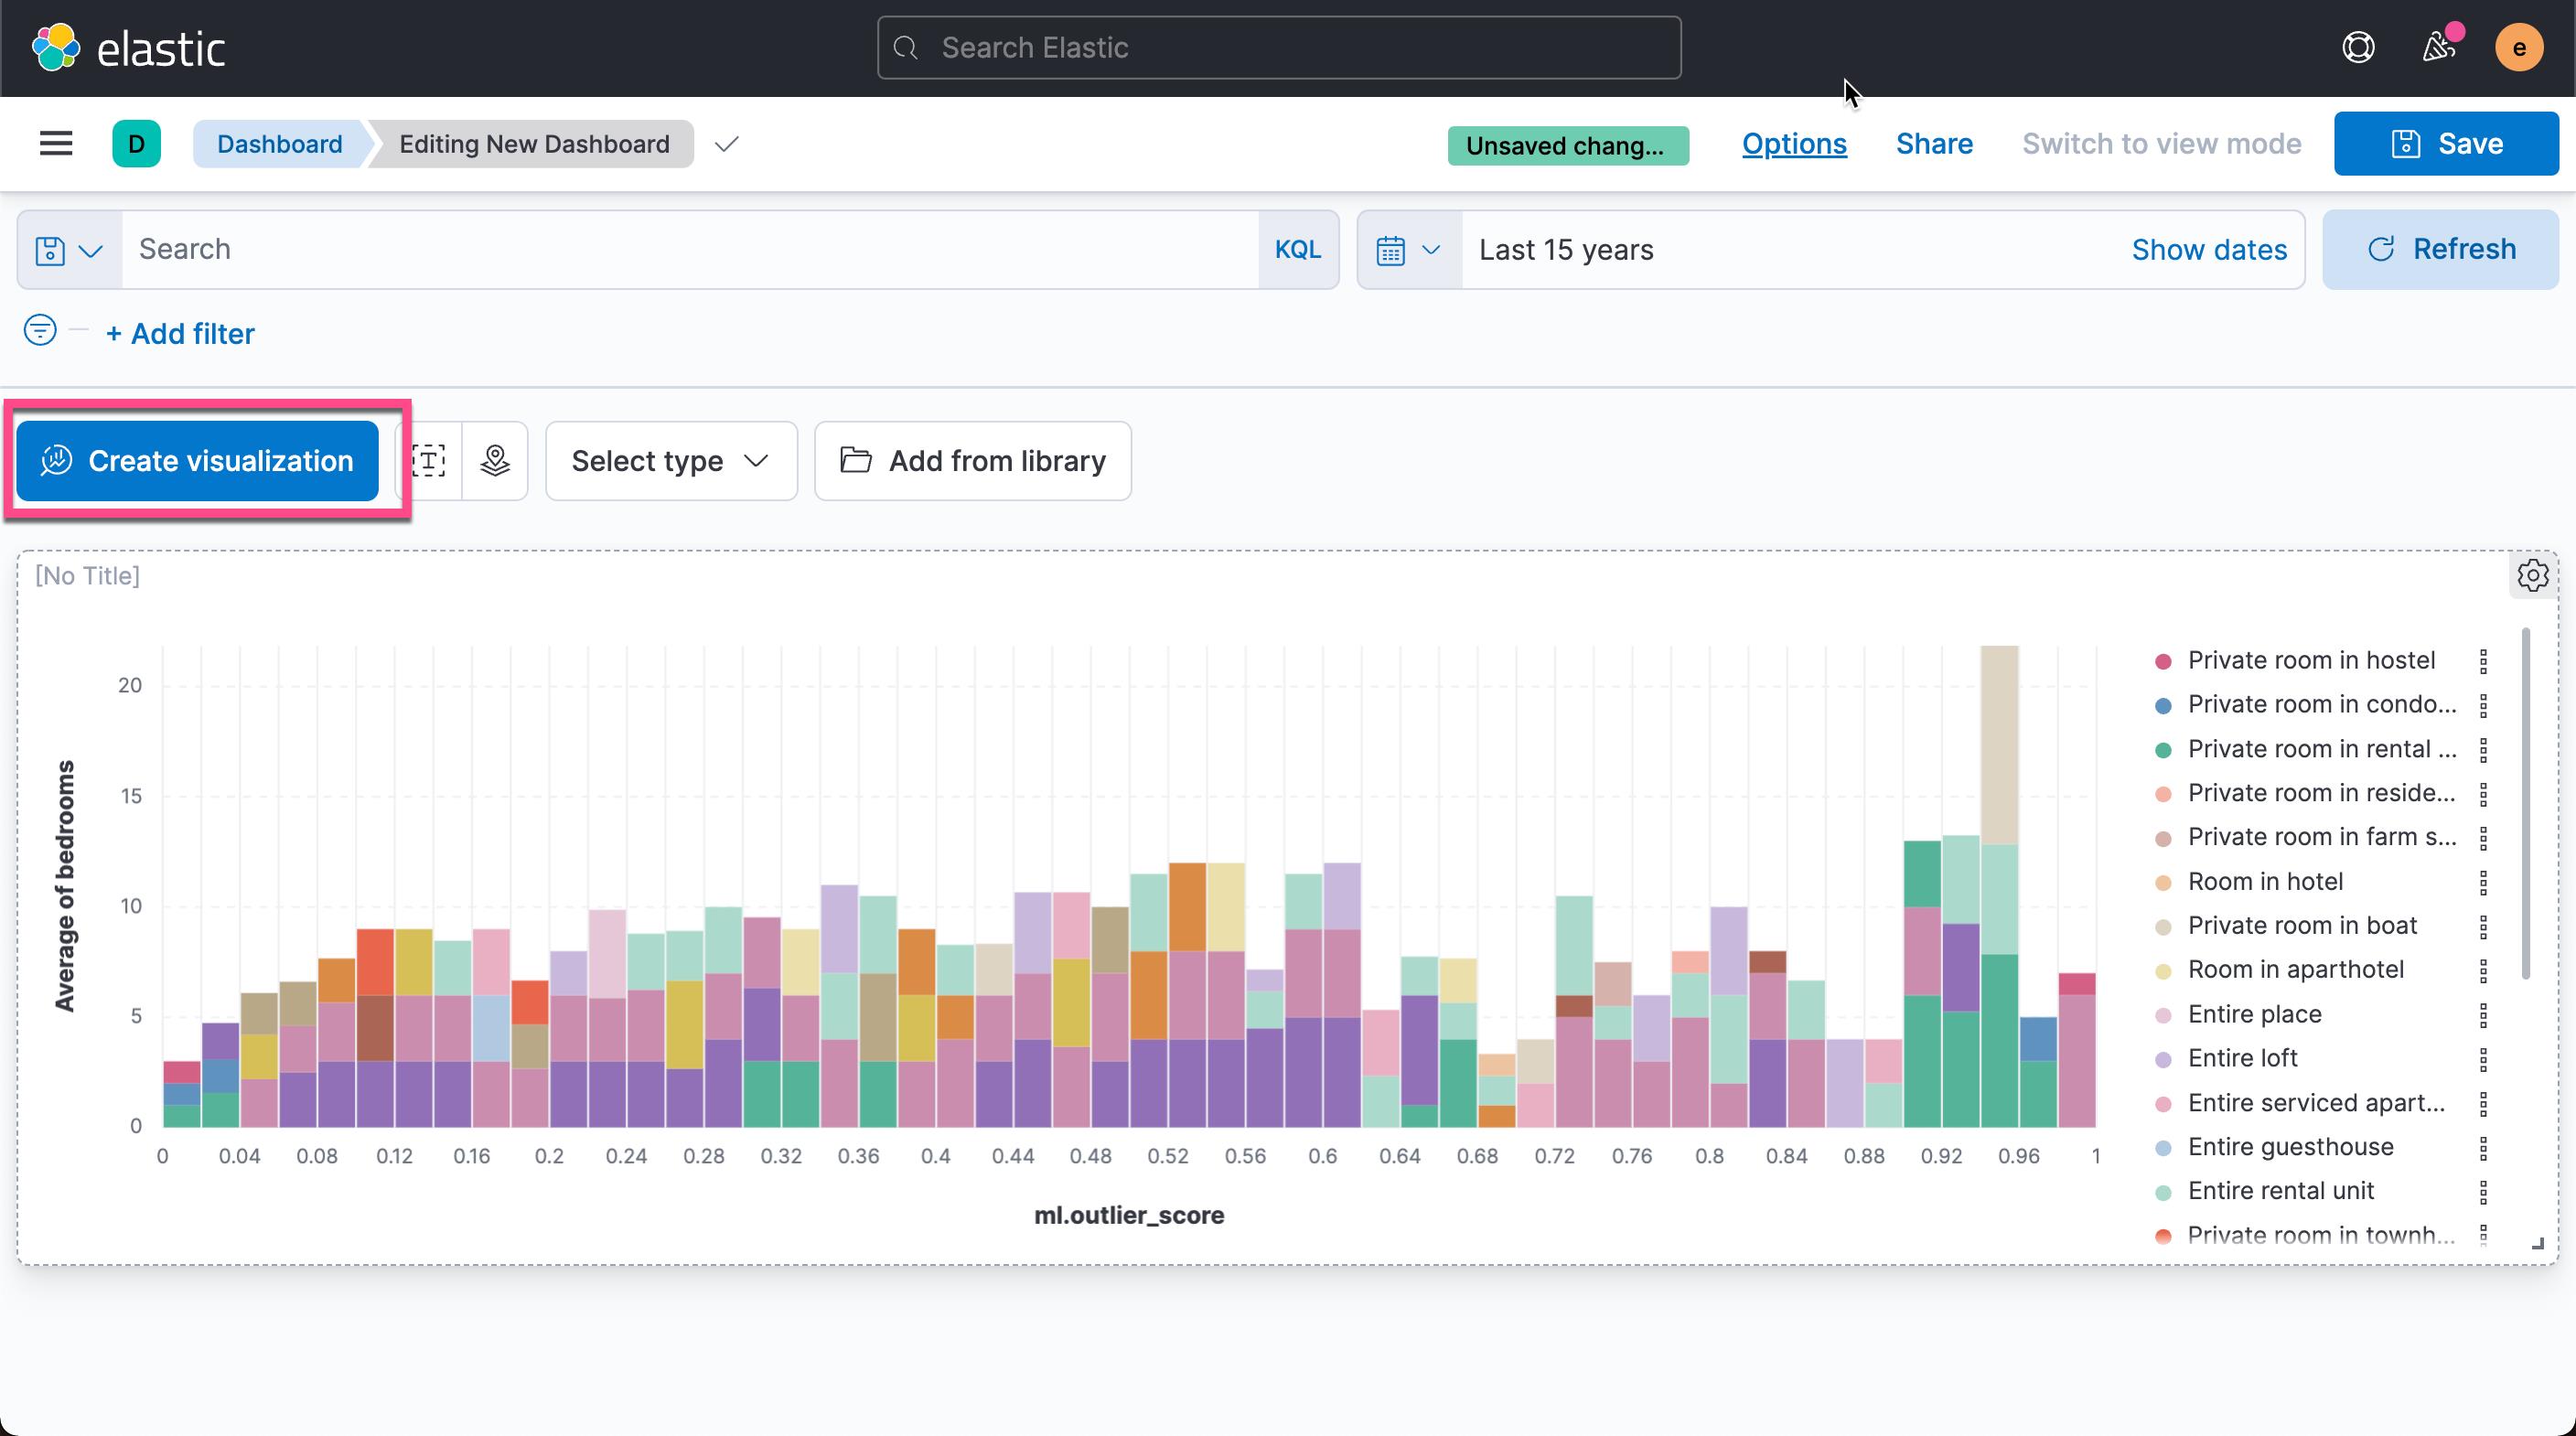
接下来,我们使用 Kibana 强大的可视化功能来对数据进行可视化:

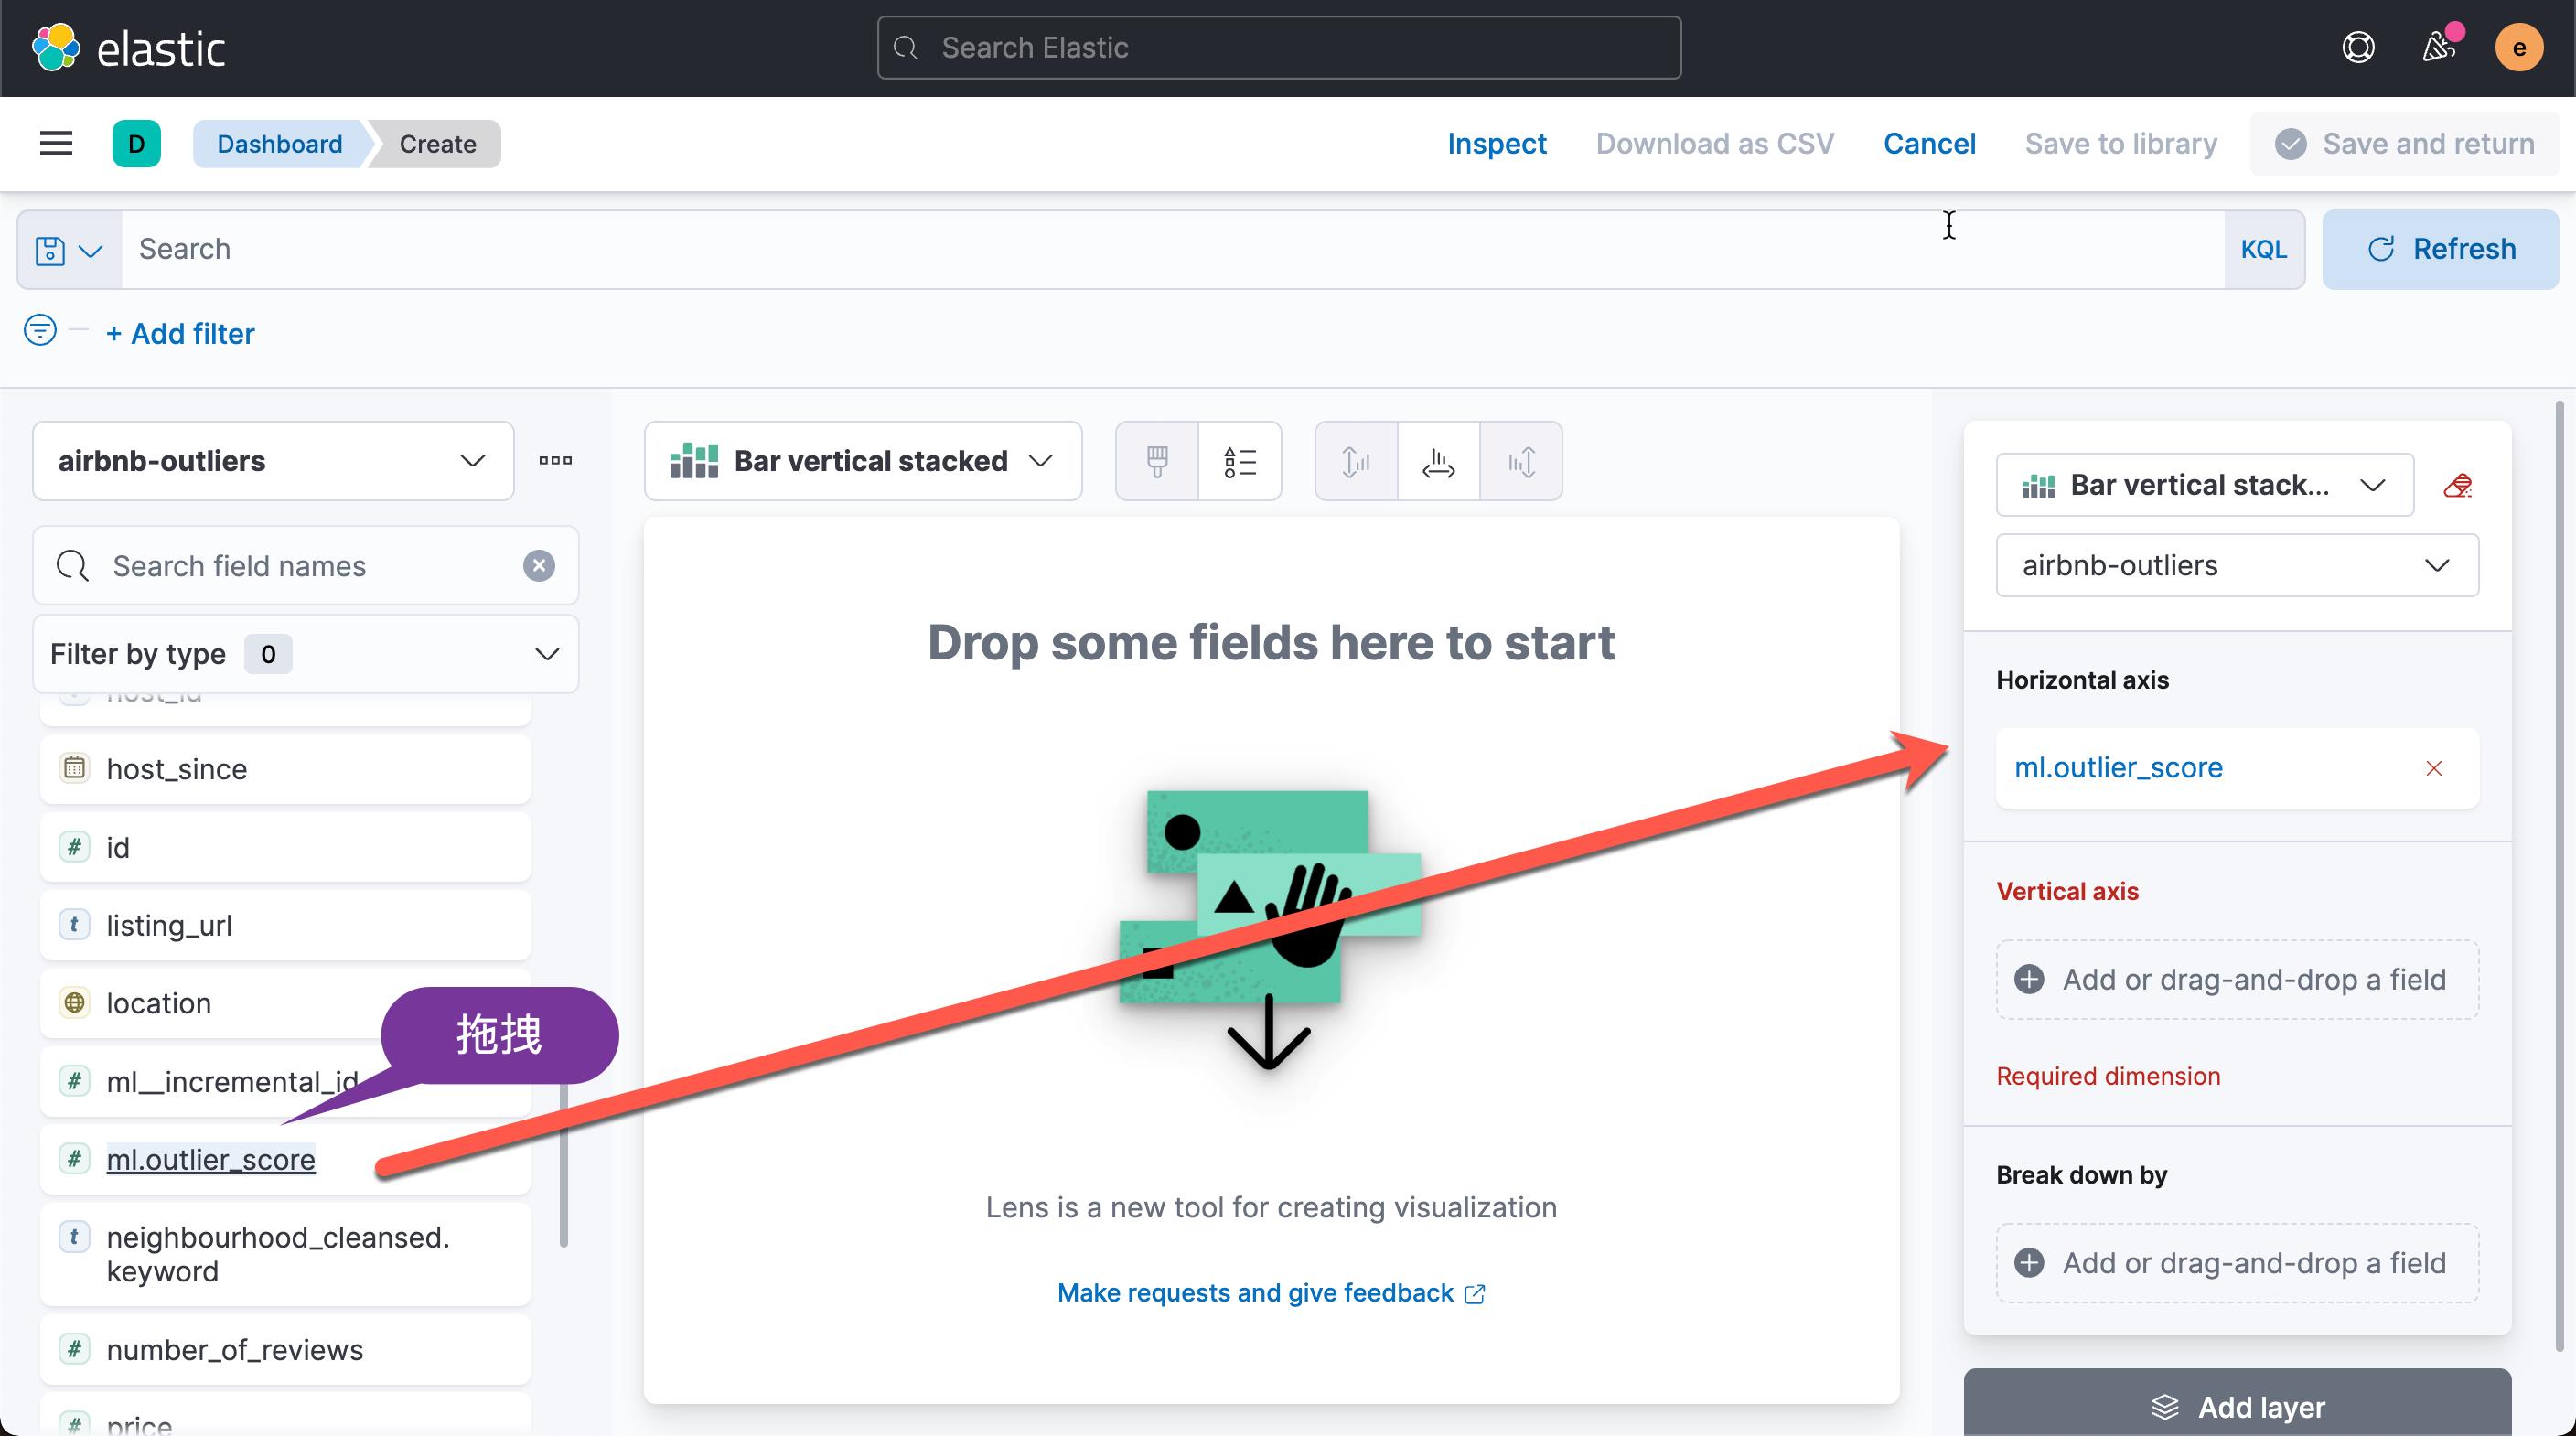
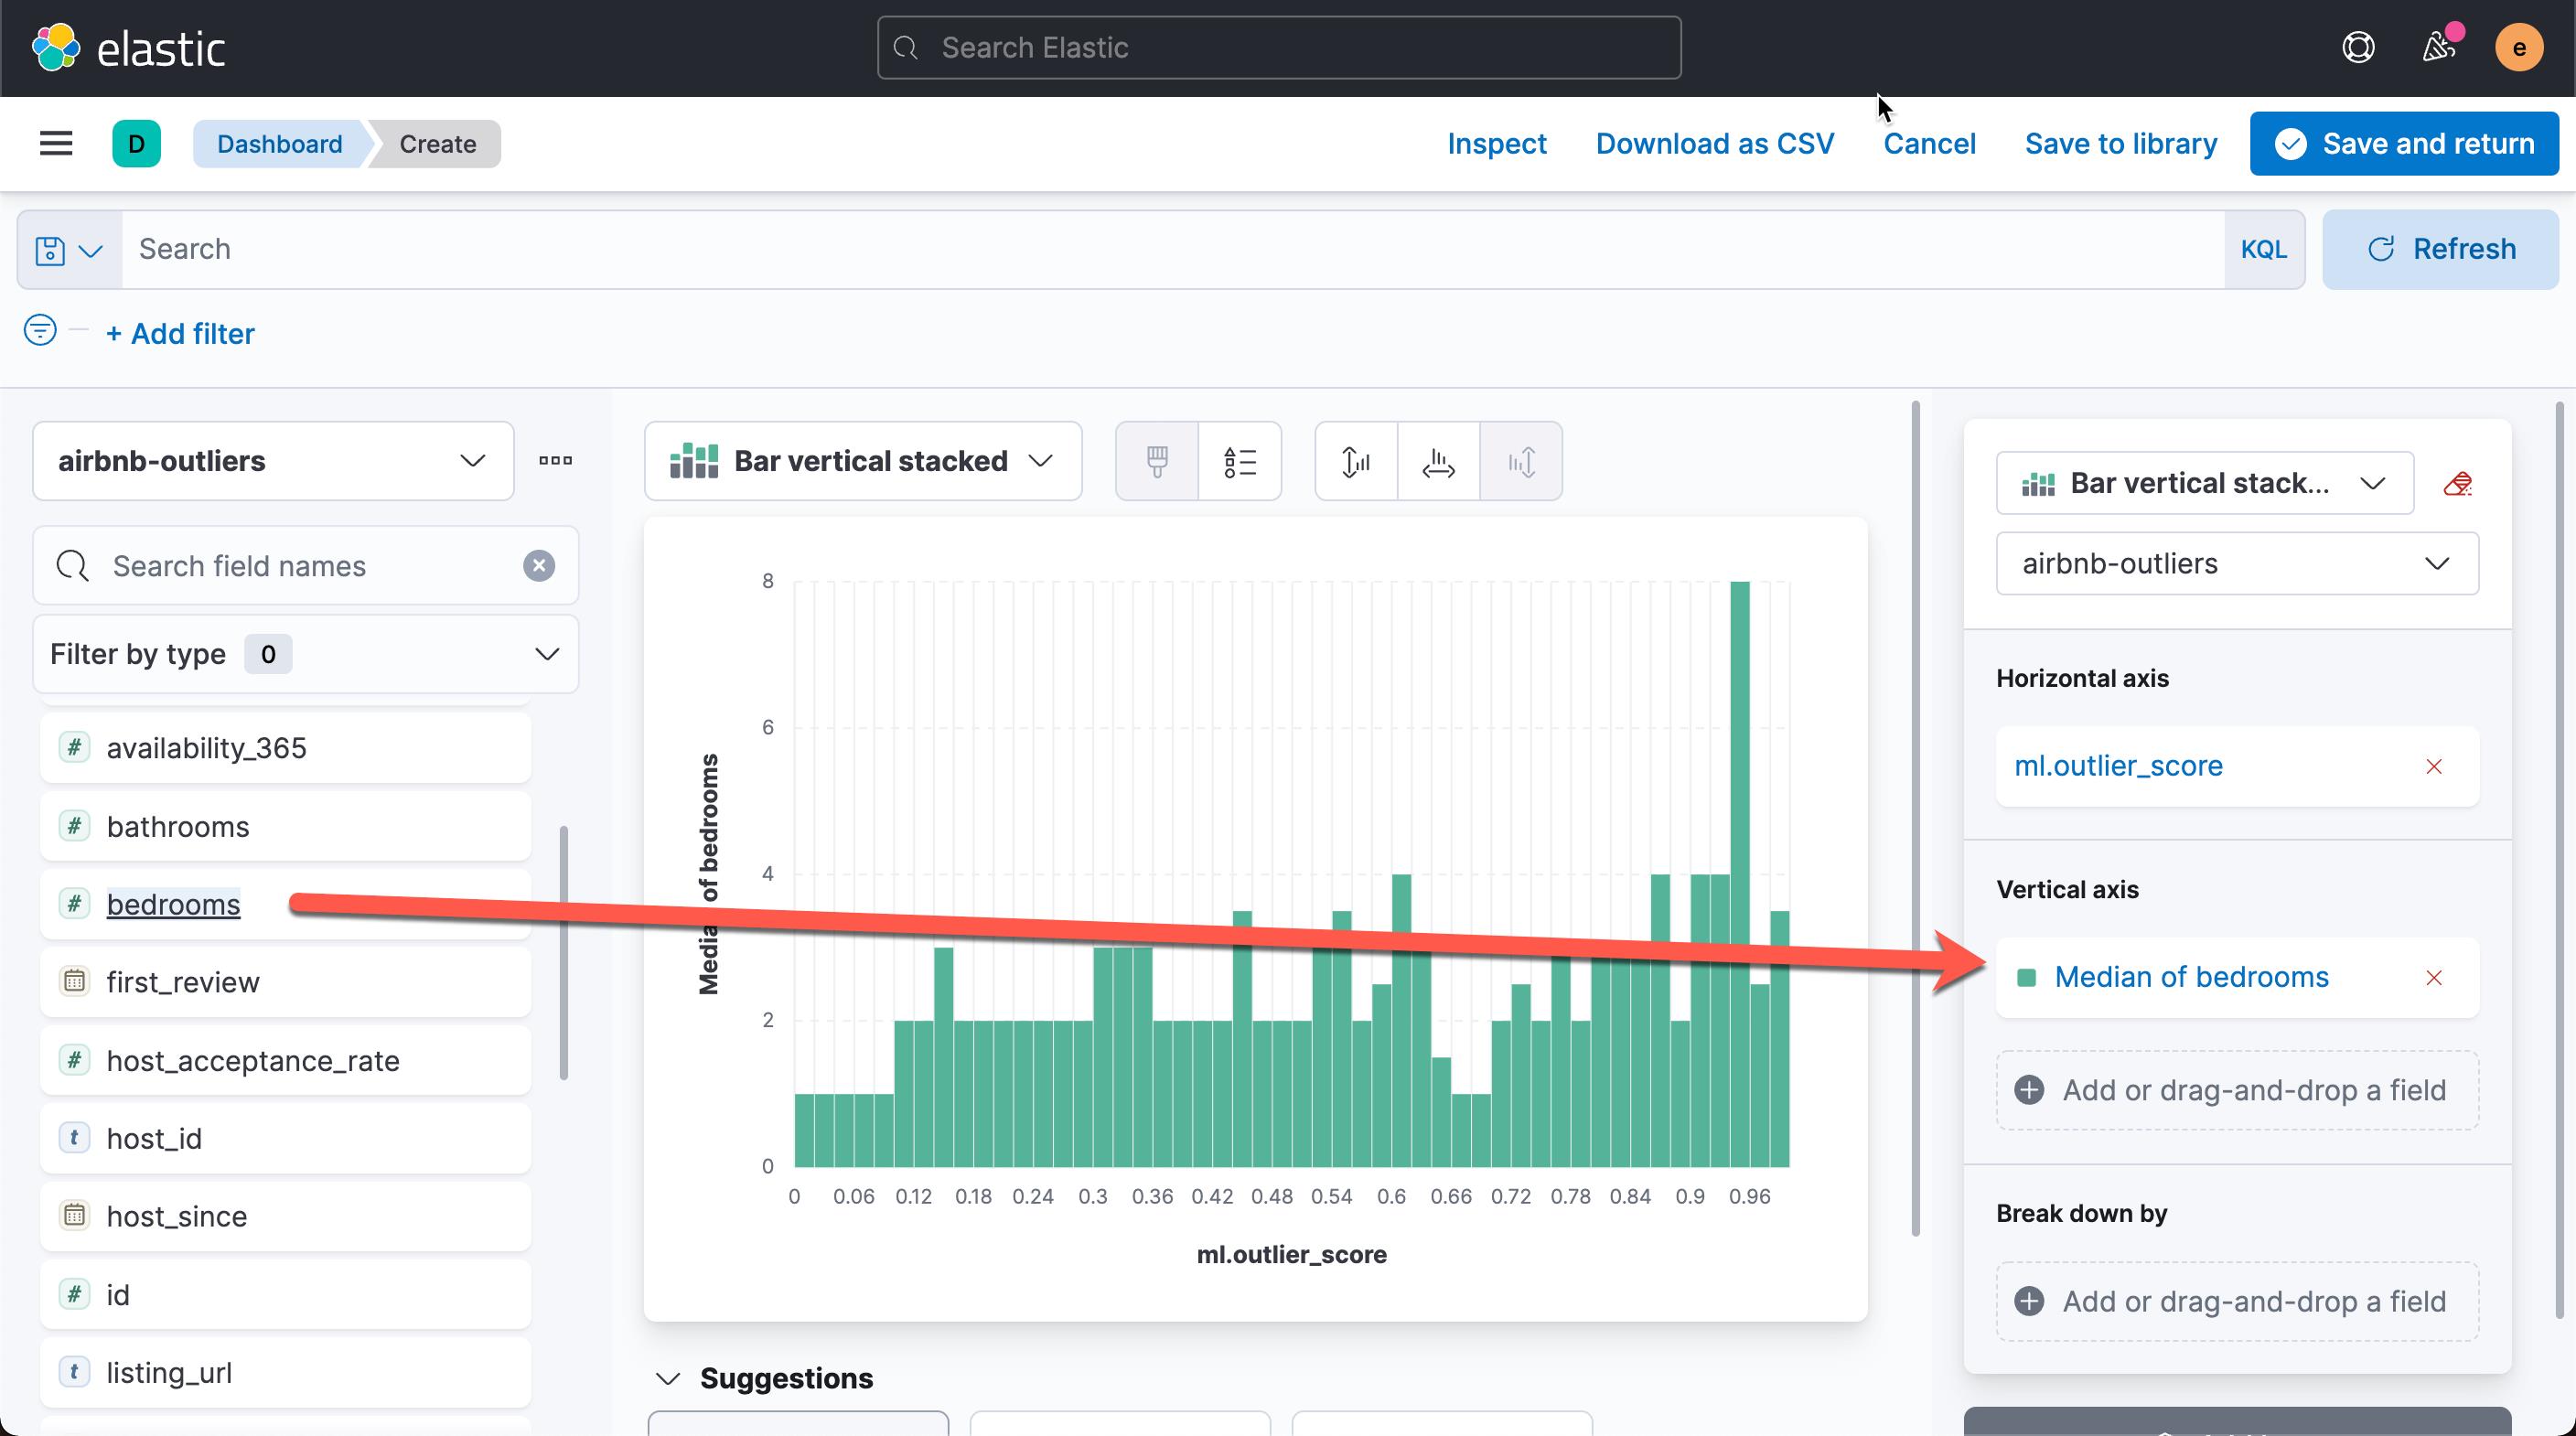
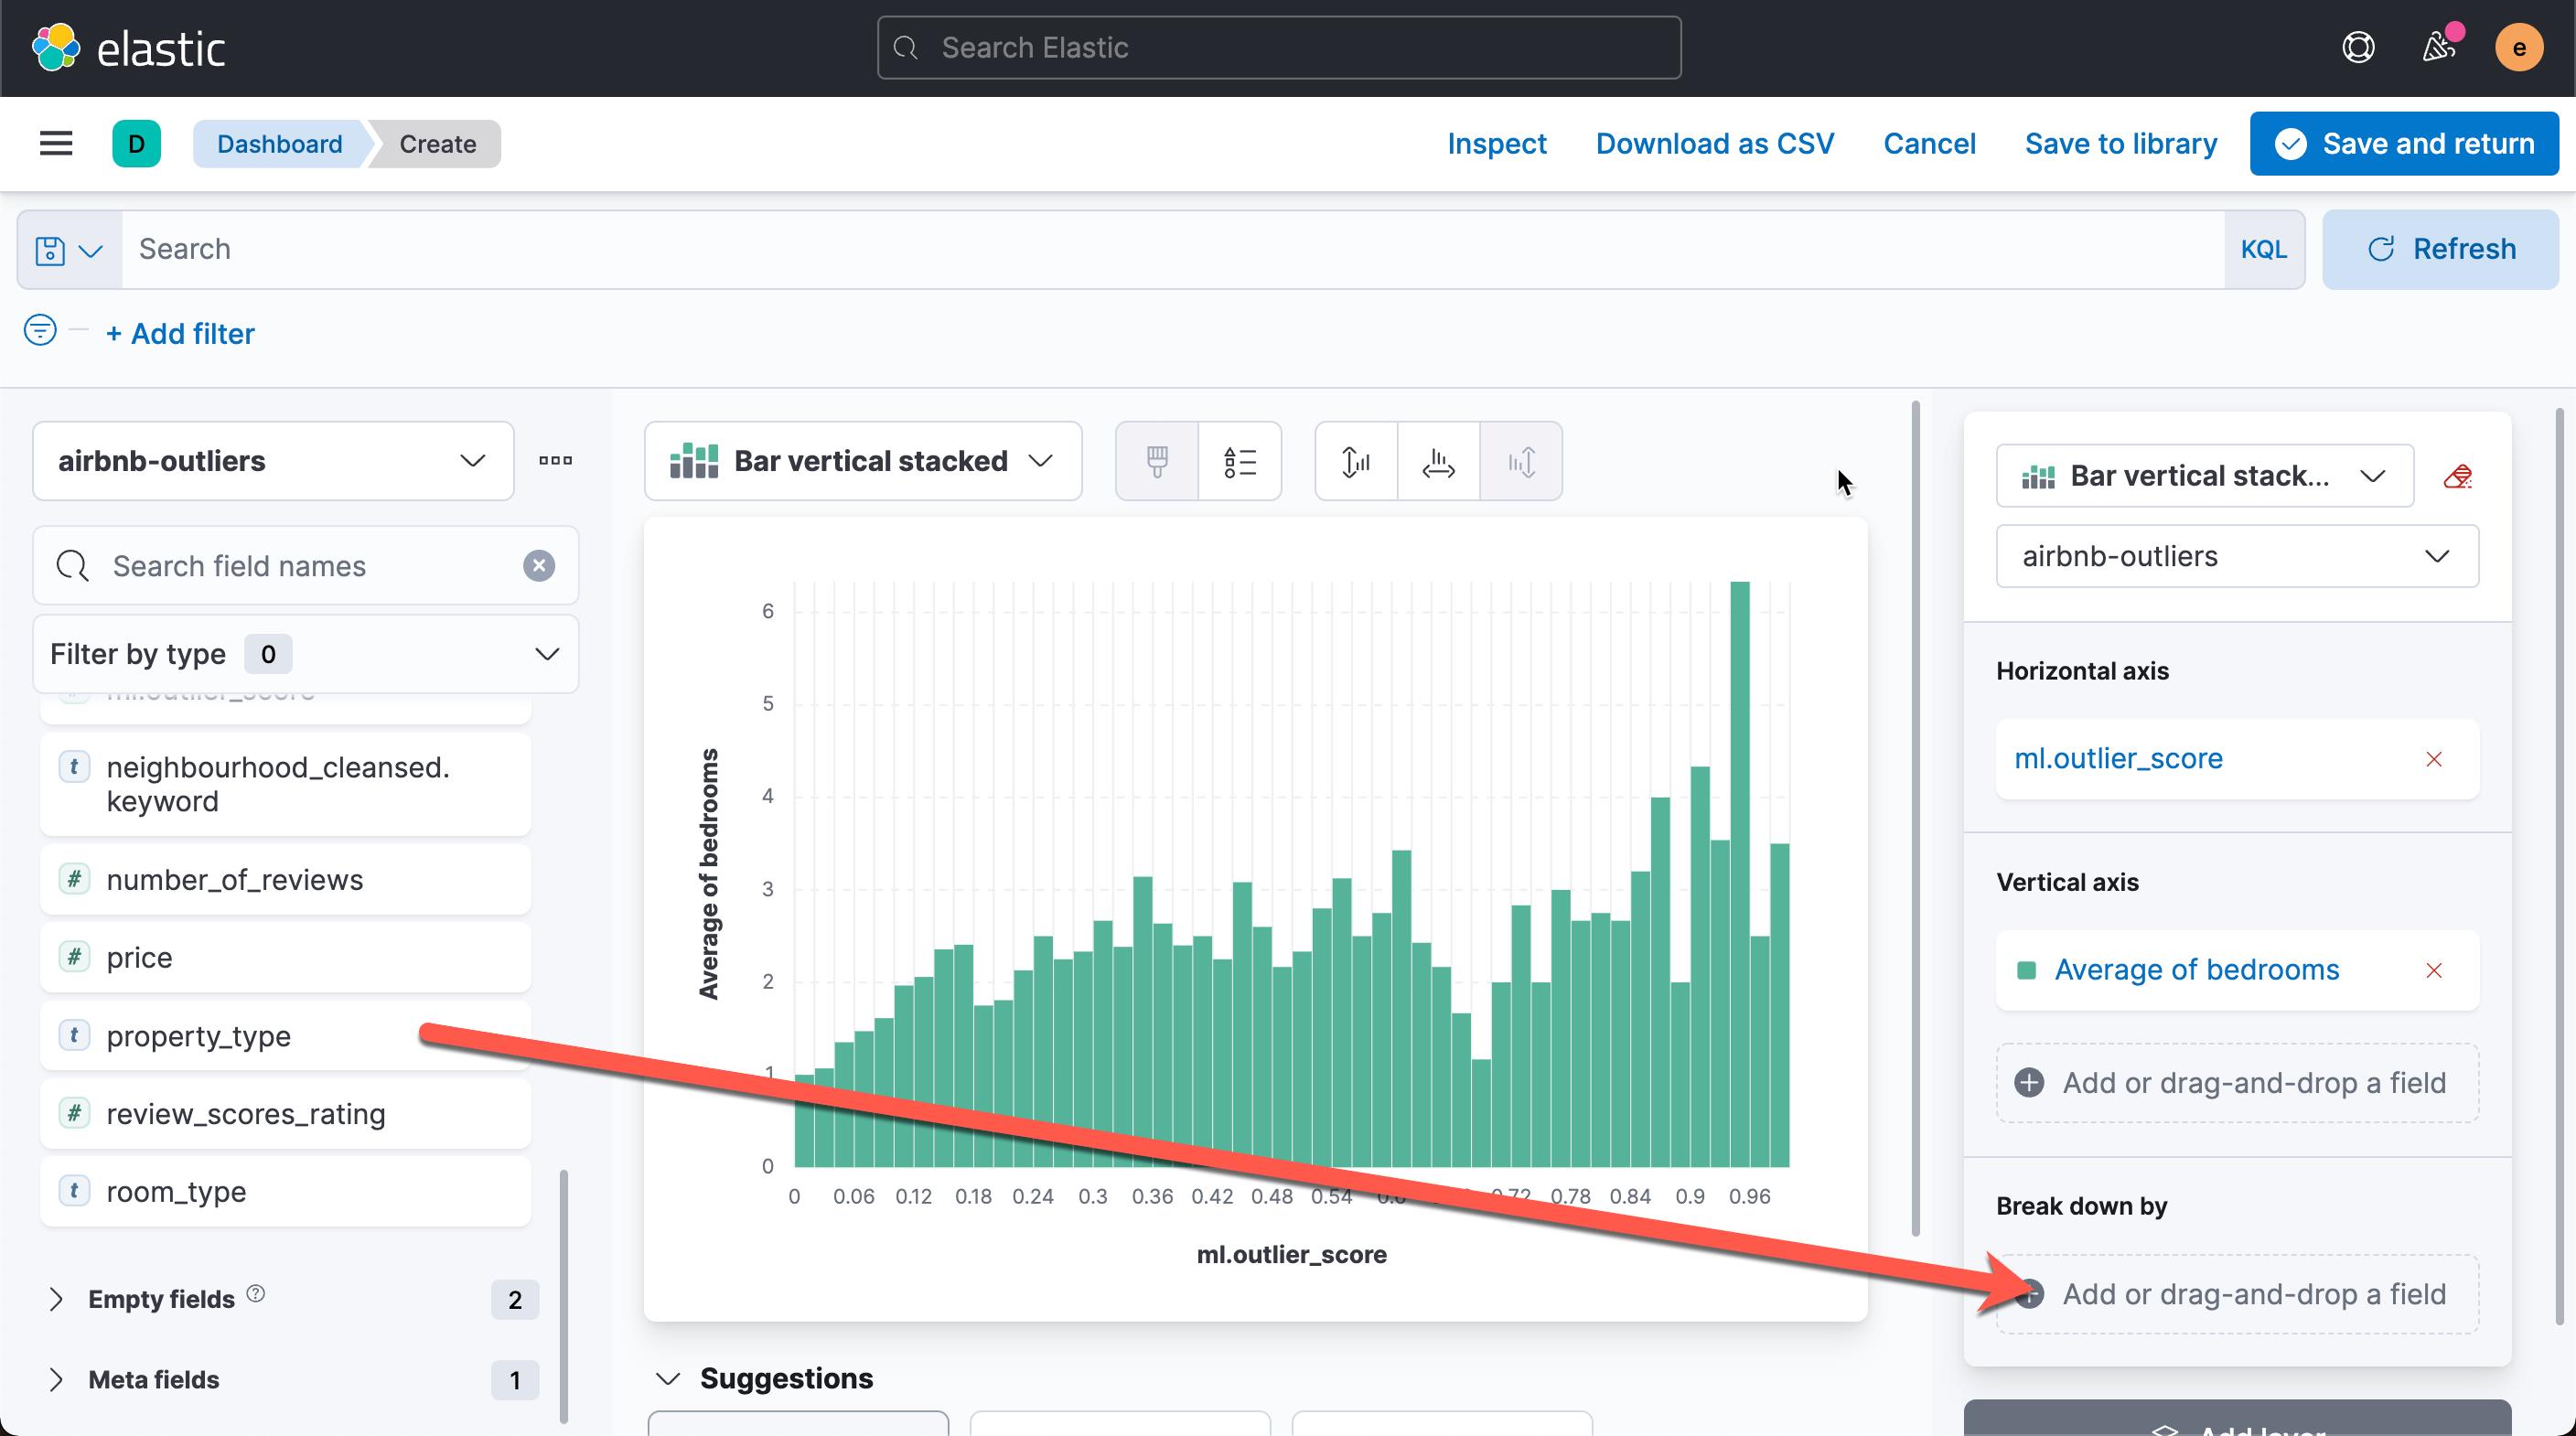
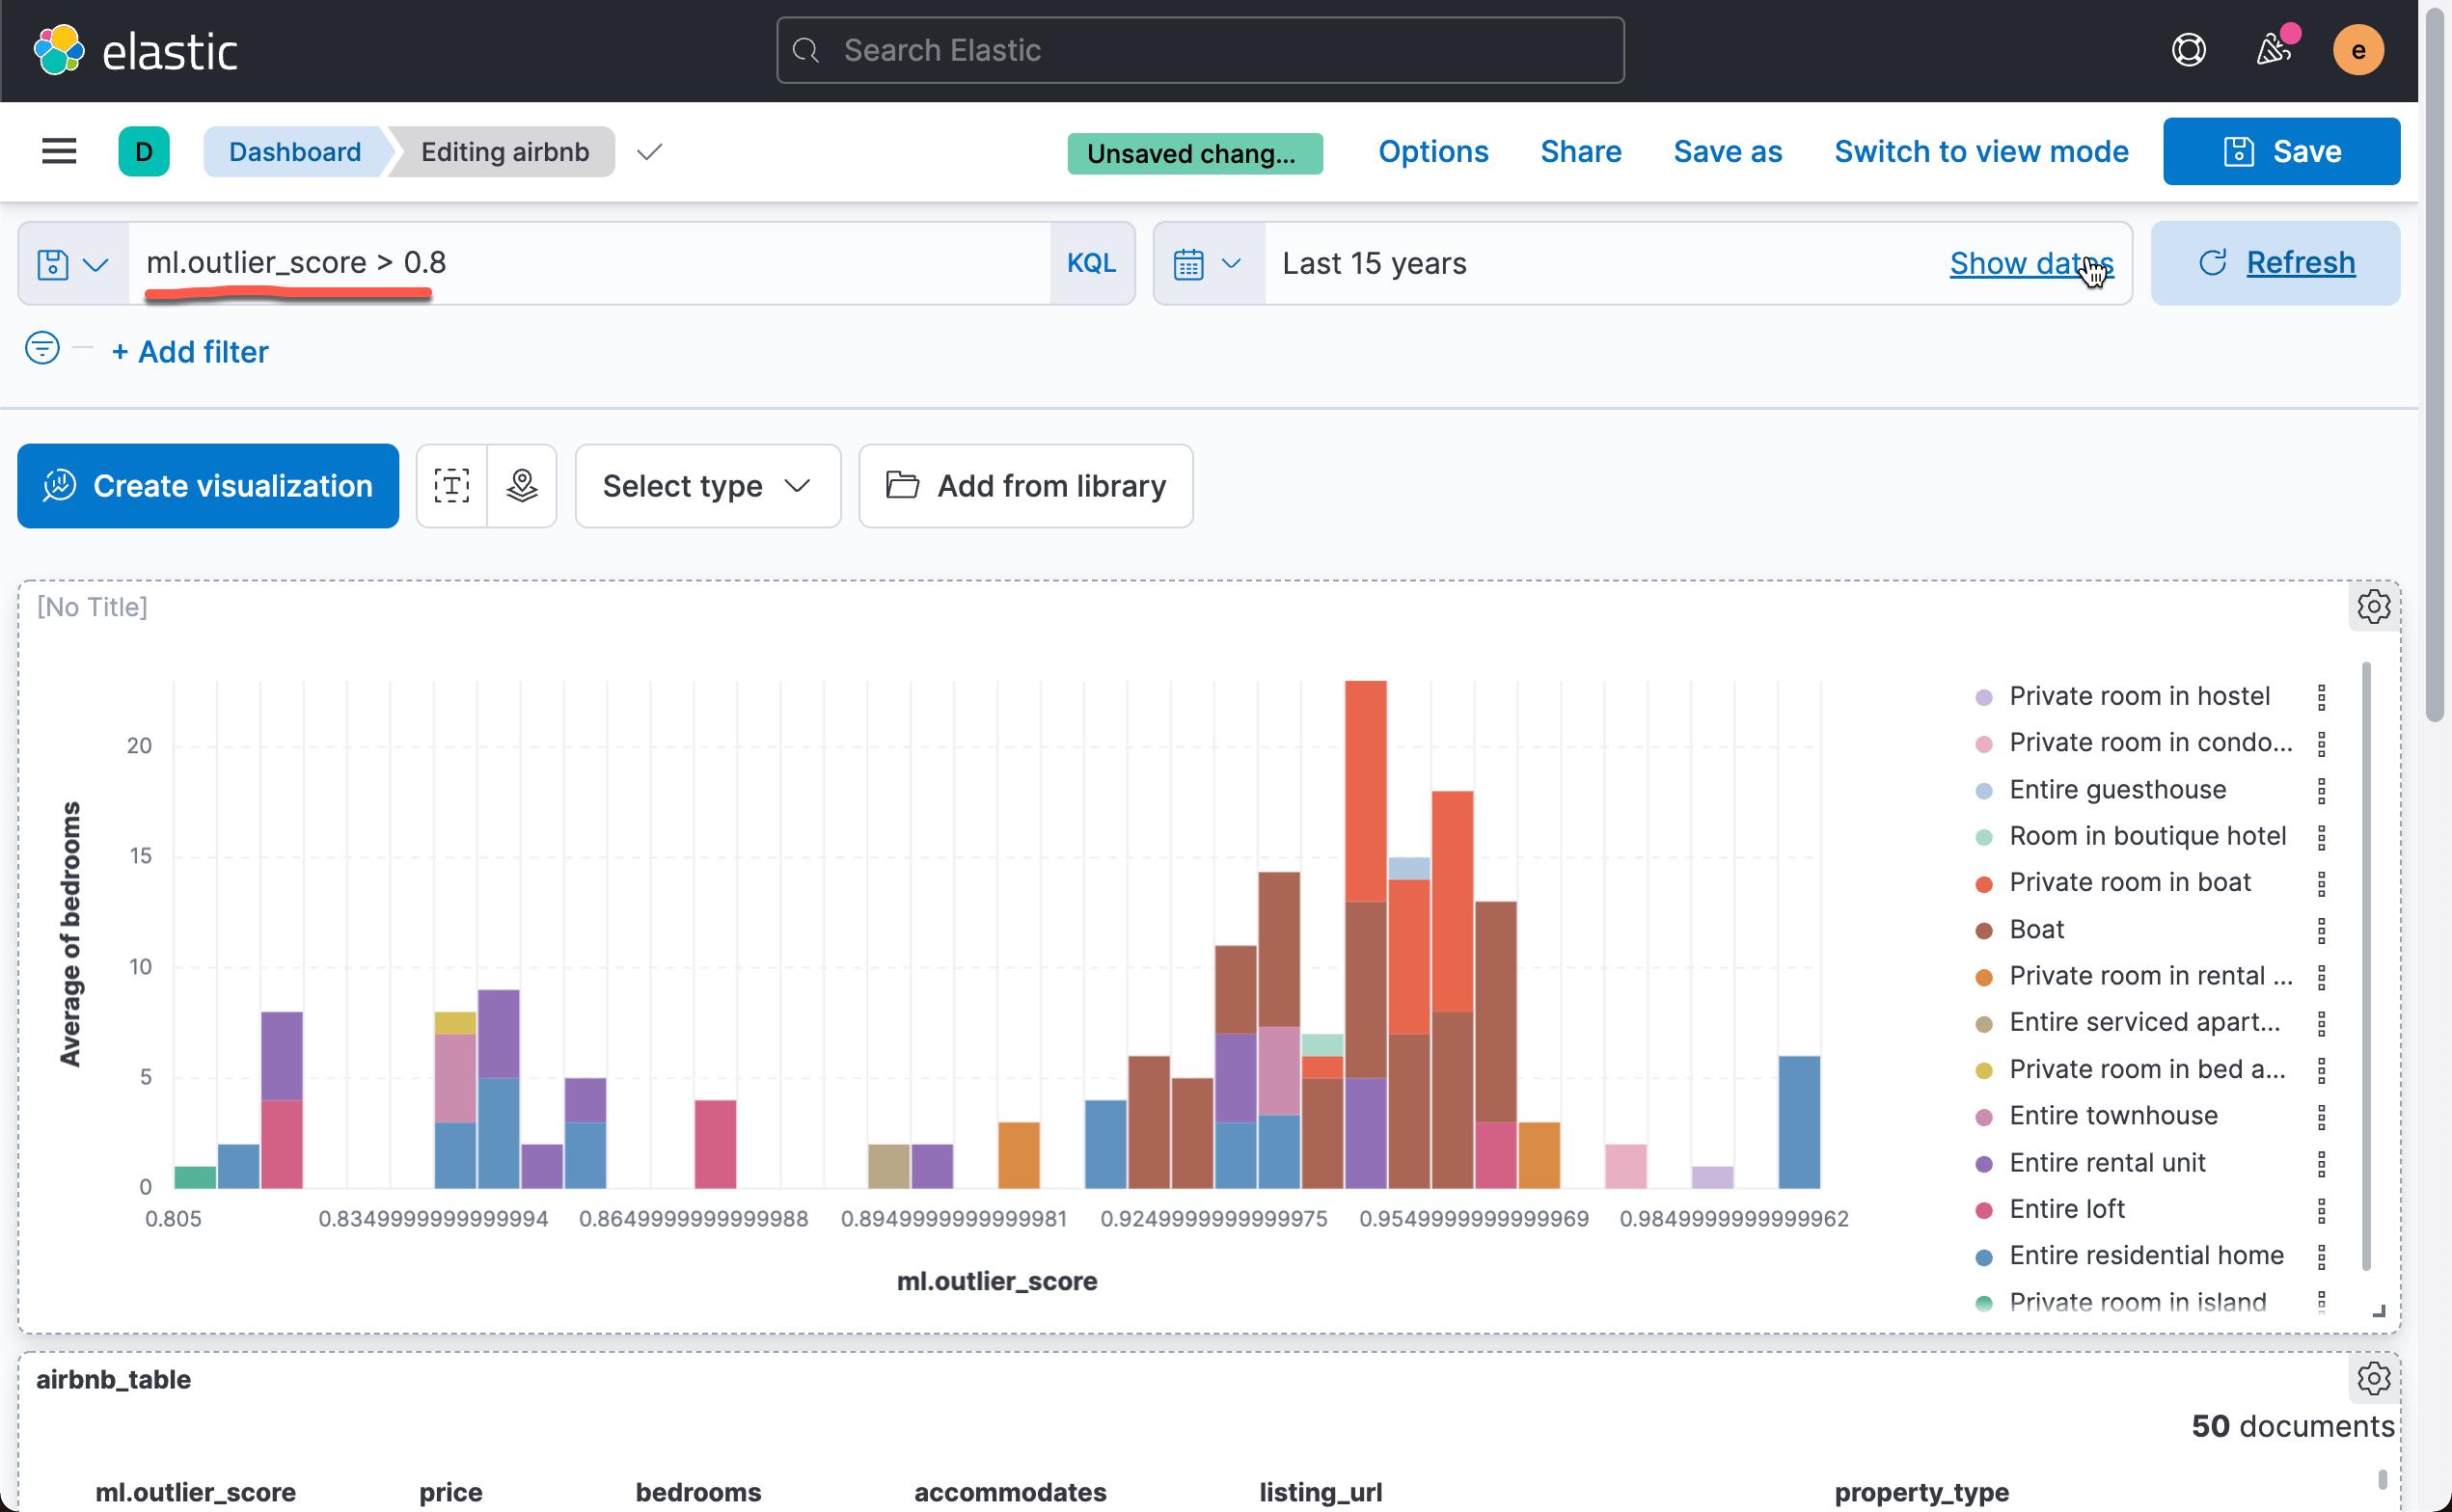
从上面的图中,我们可以看出每个异常值对应的的平均房间数。平均房间数为6.333 时,异常值为最高。我们还可以再把 property_type 来进行 break down:
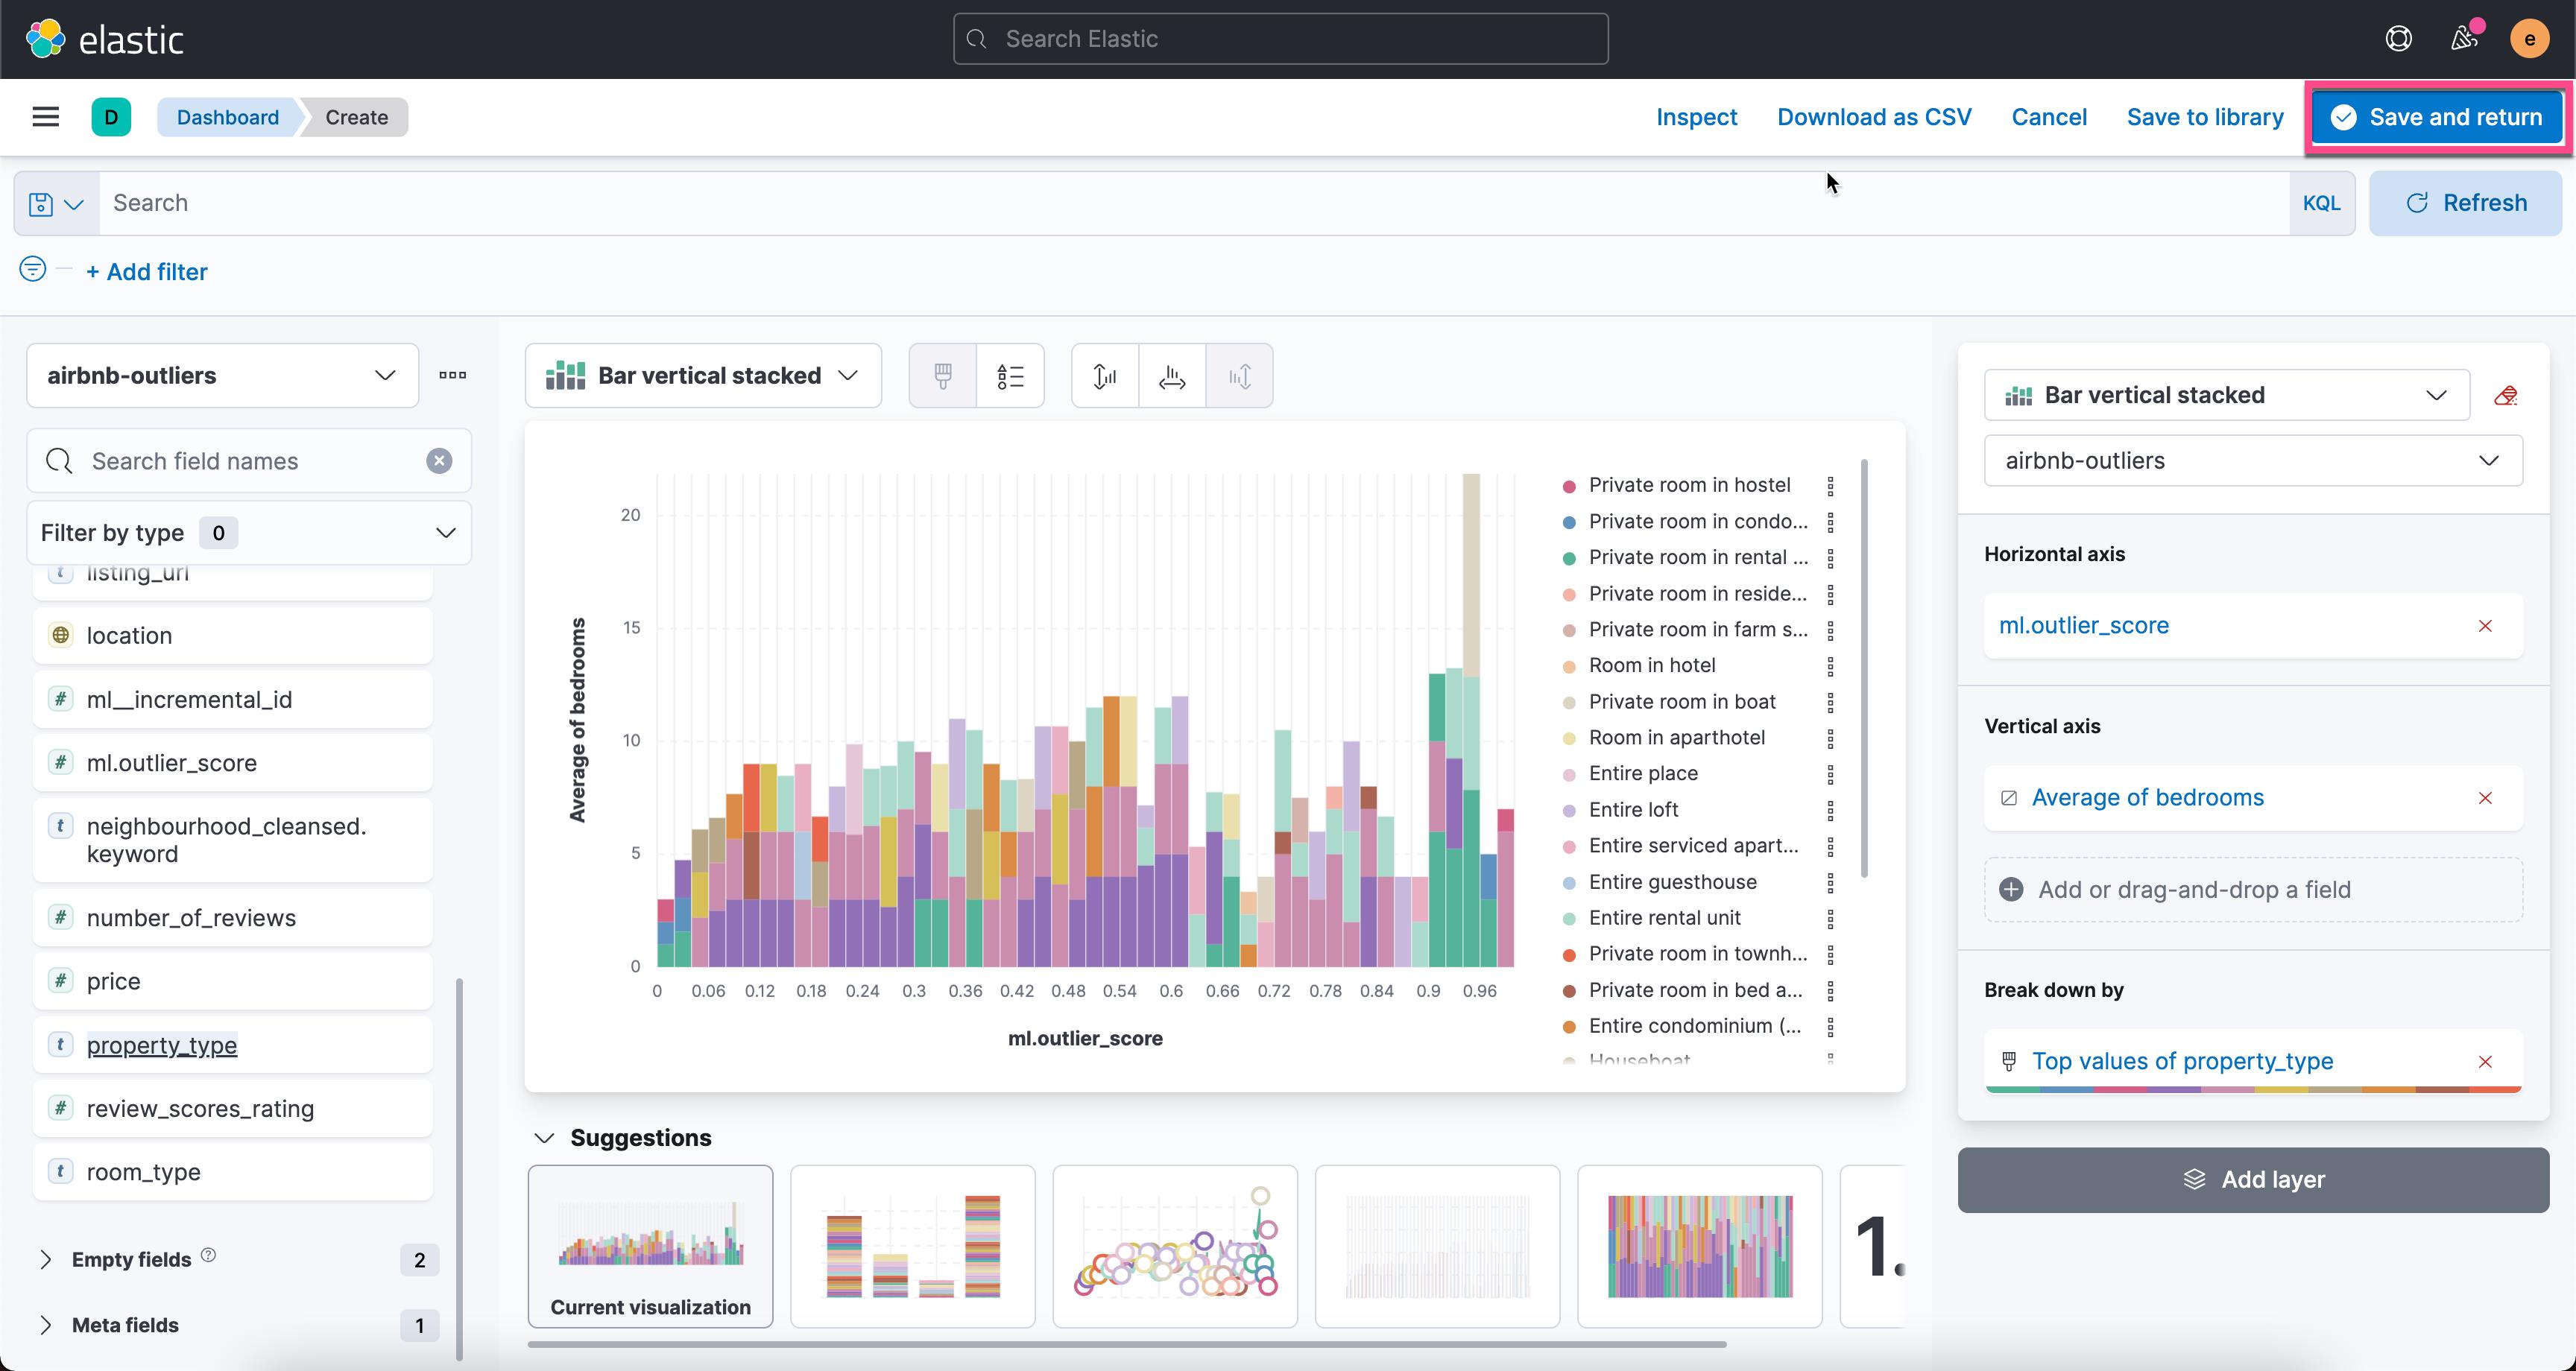
我们点击有上角的 Save and return。这样我们就生成了第一个可视化图:
我们接下来把异常的数据制成我们想要的表格。我们回到 Discover 界面:
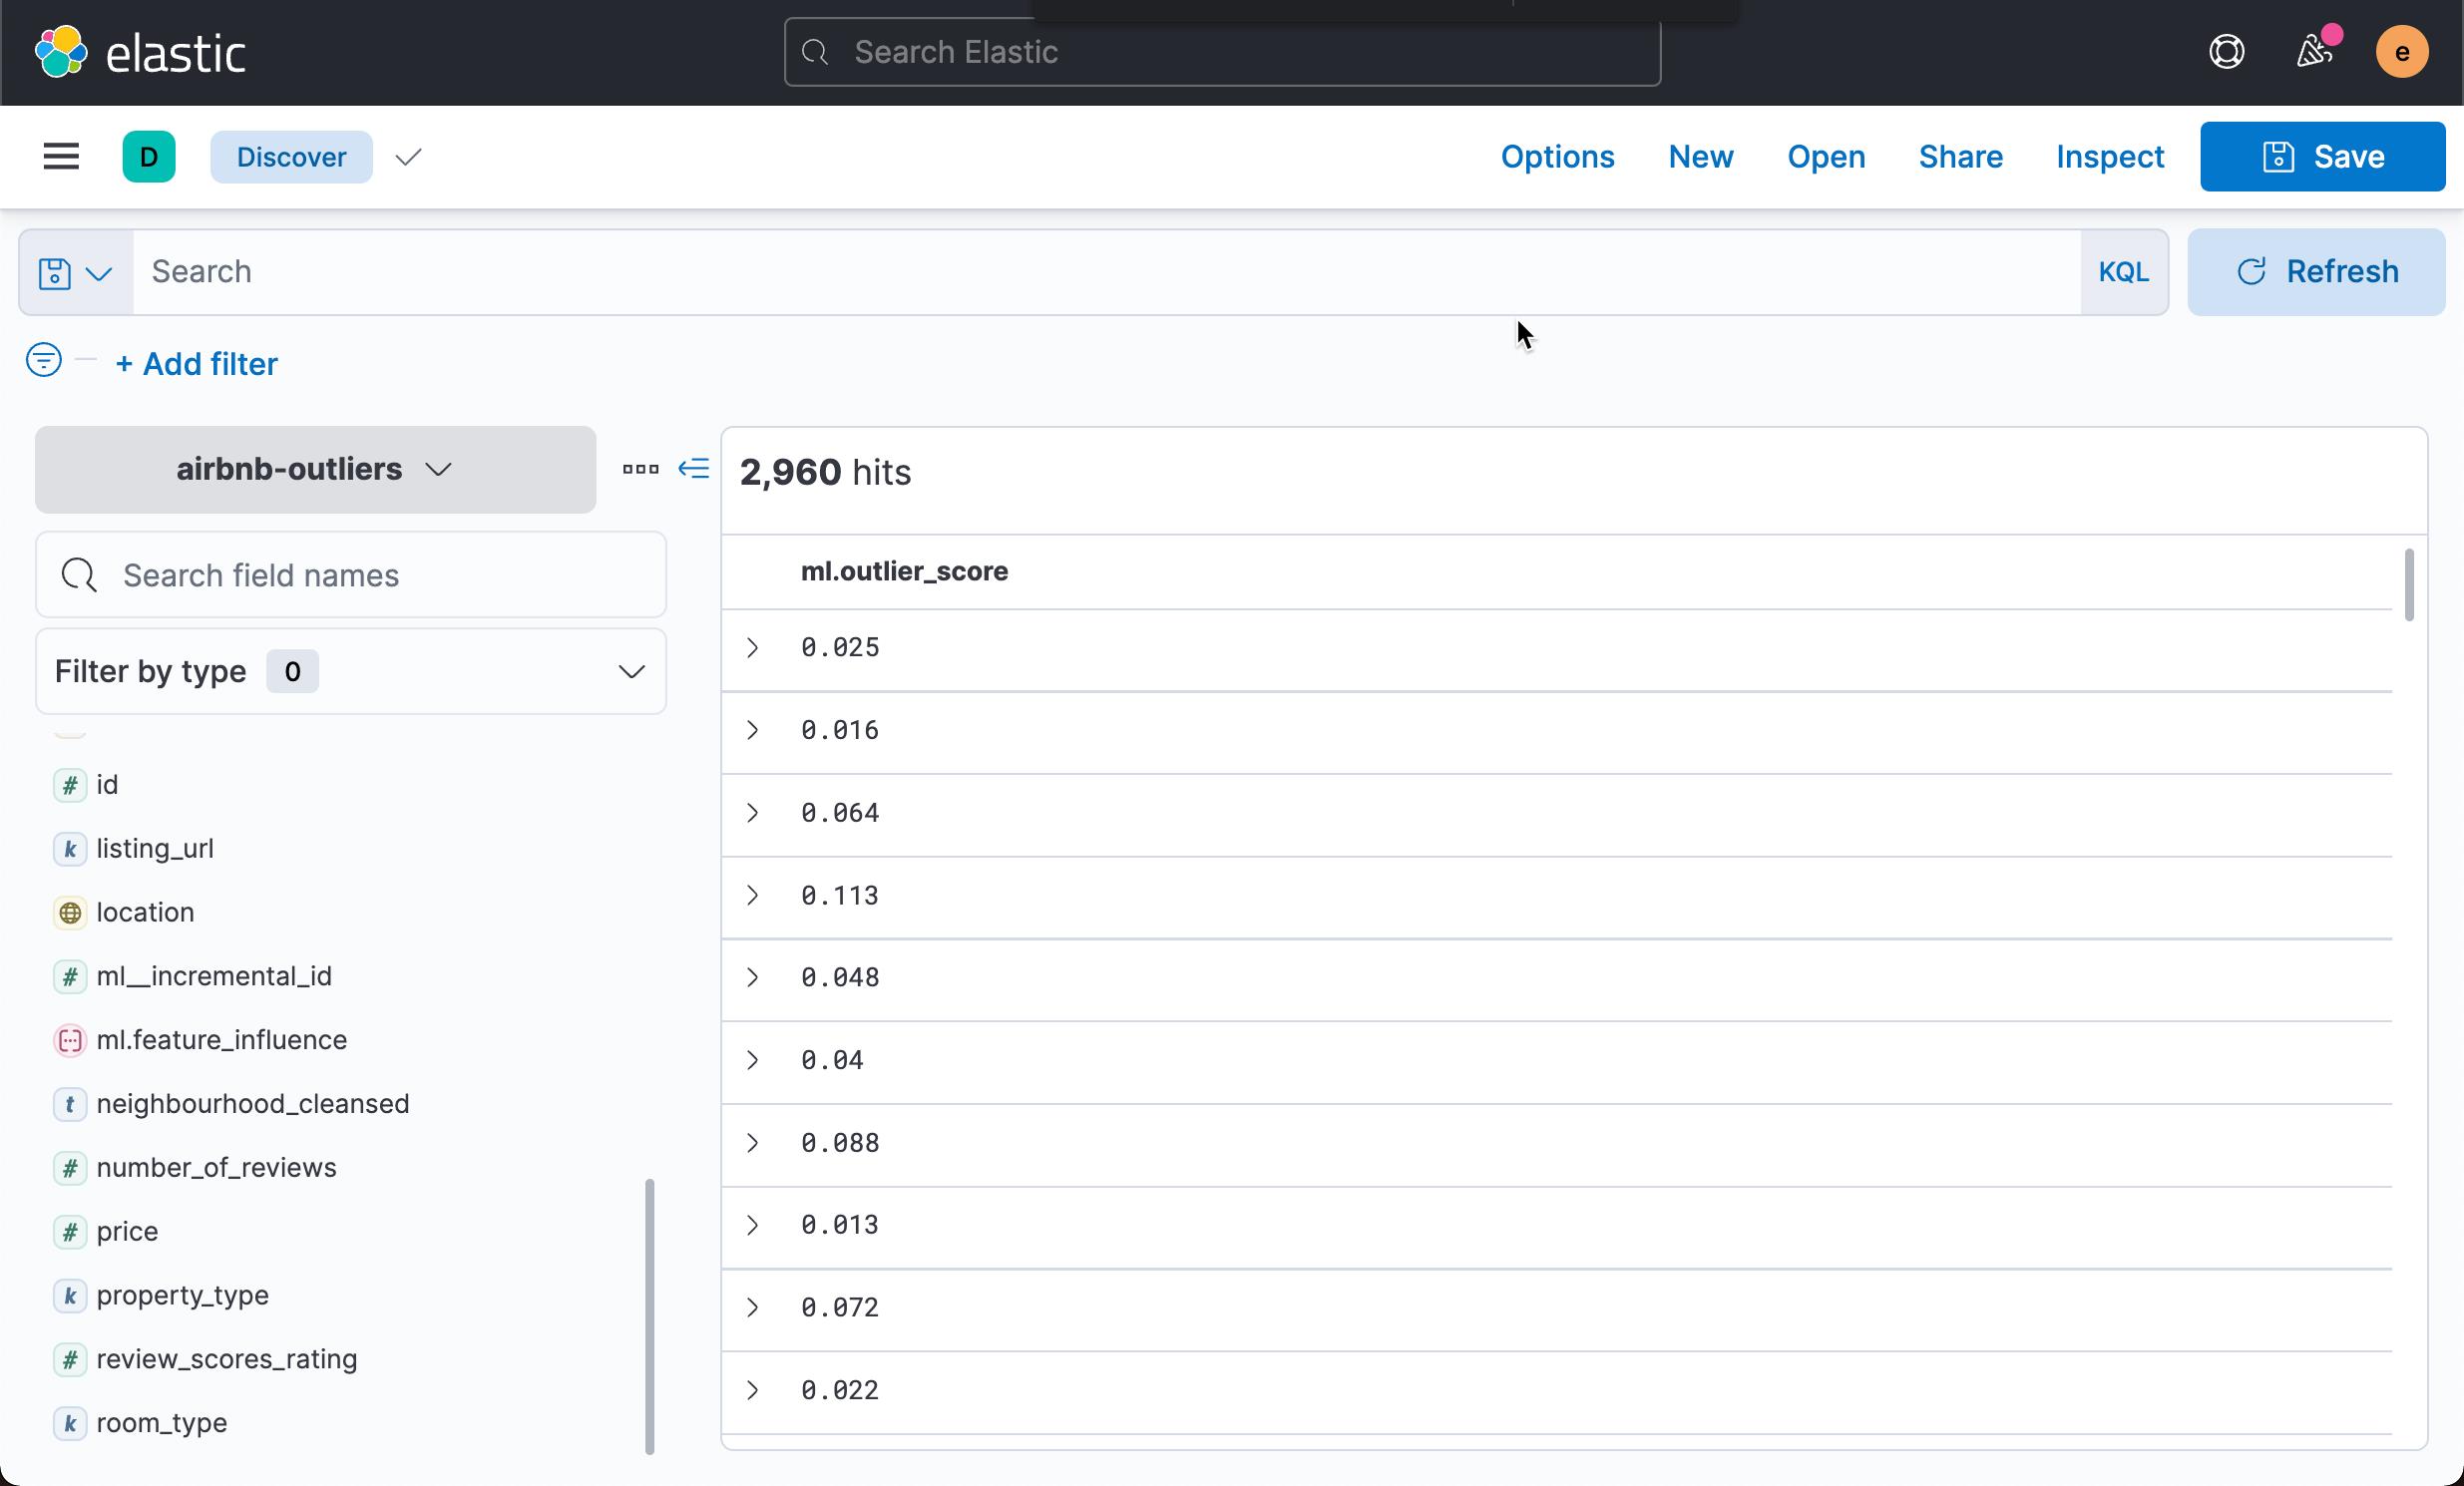
按照同样的方法,我们添加如下的其它字段:
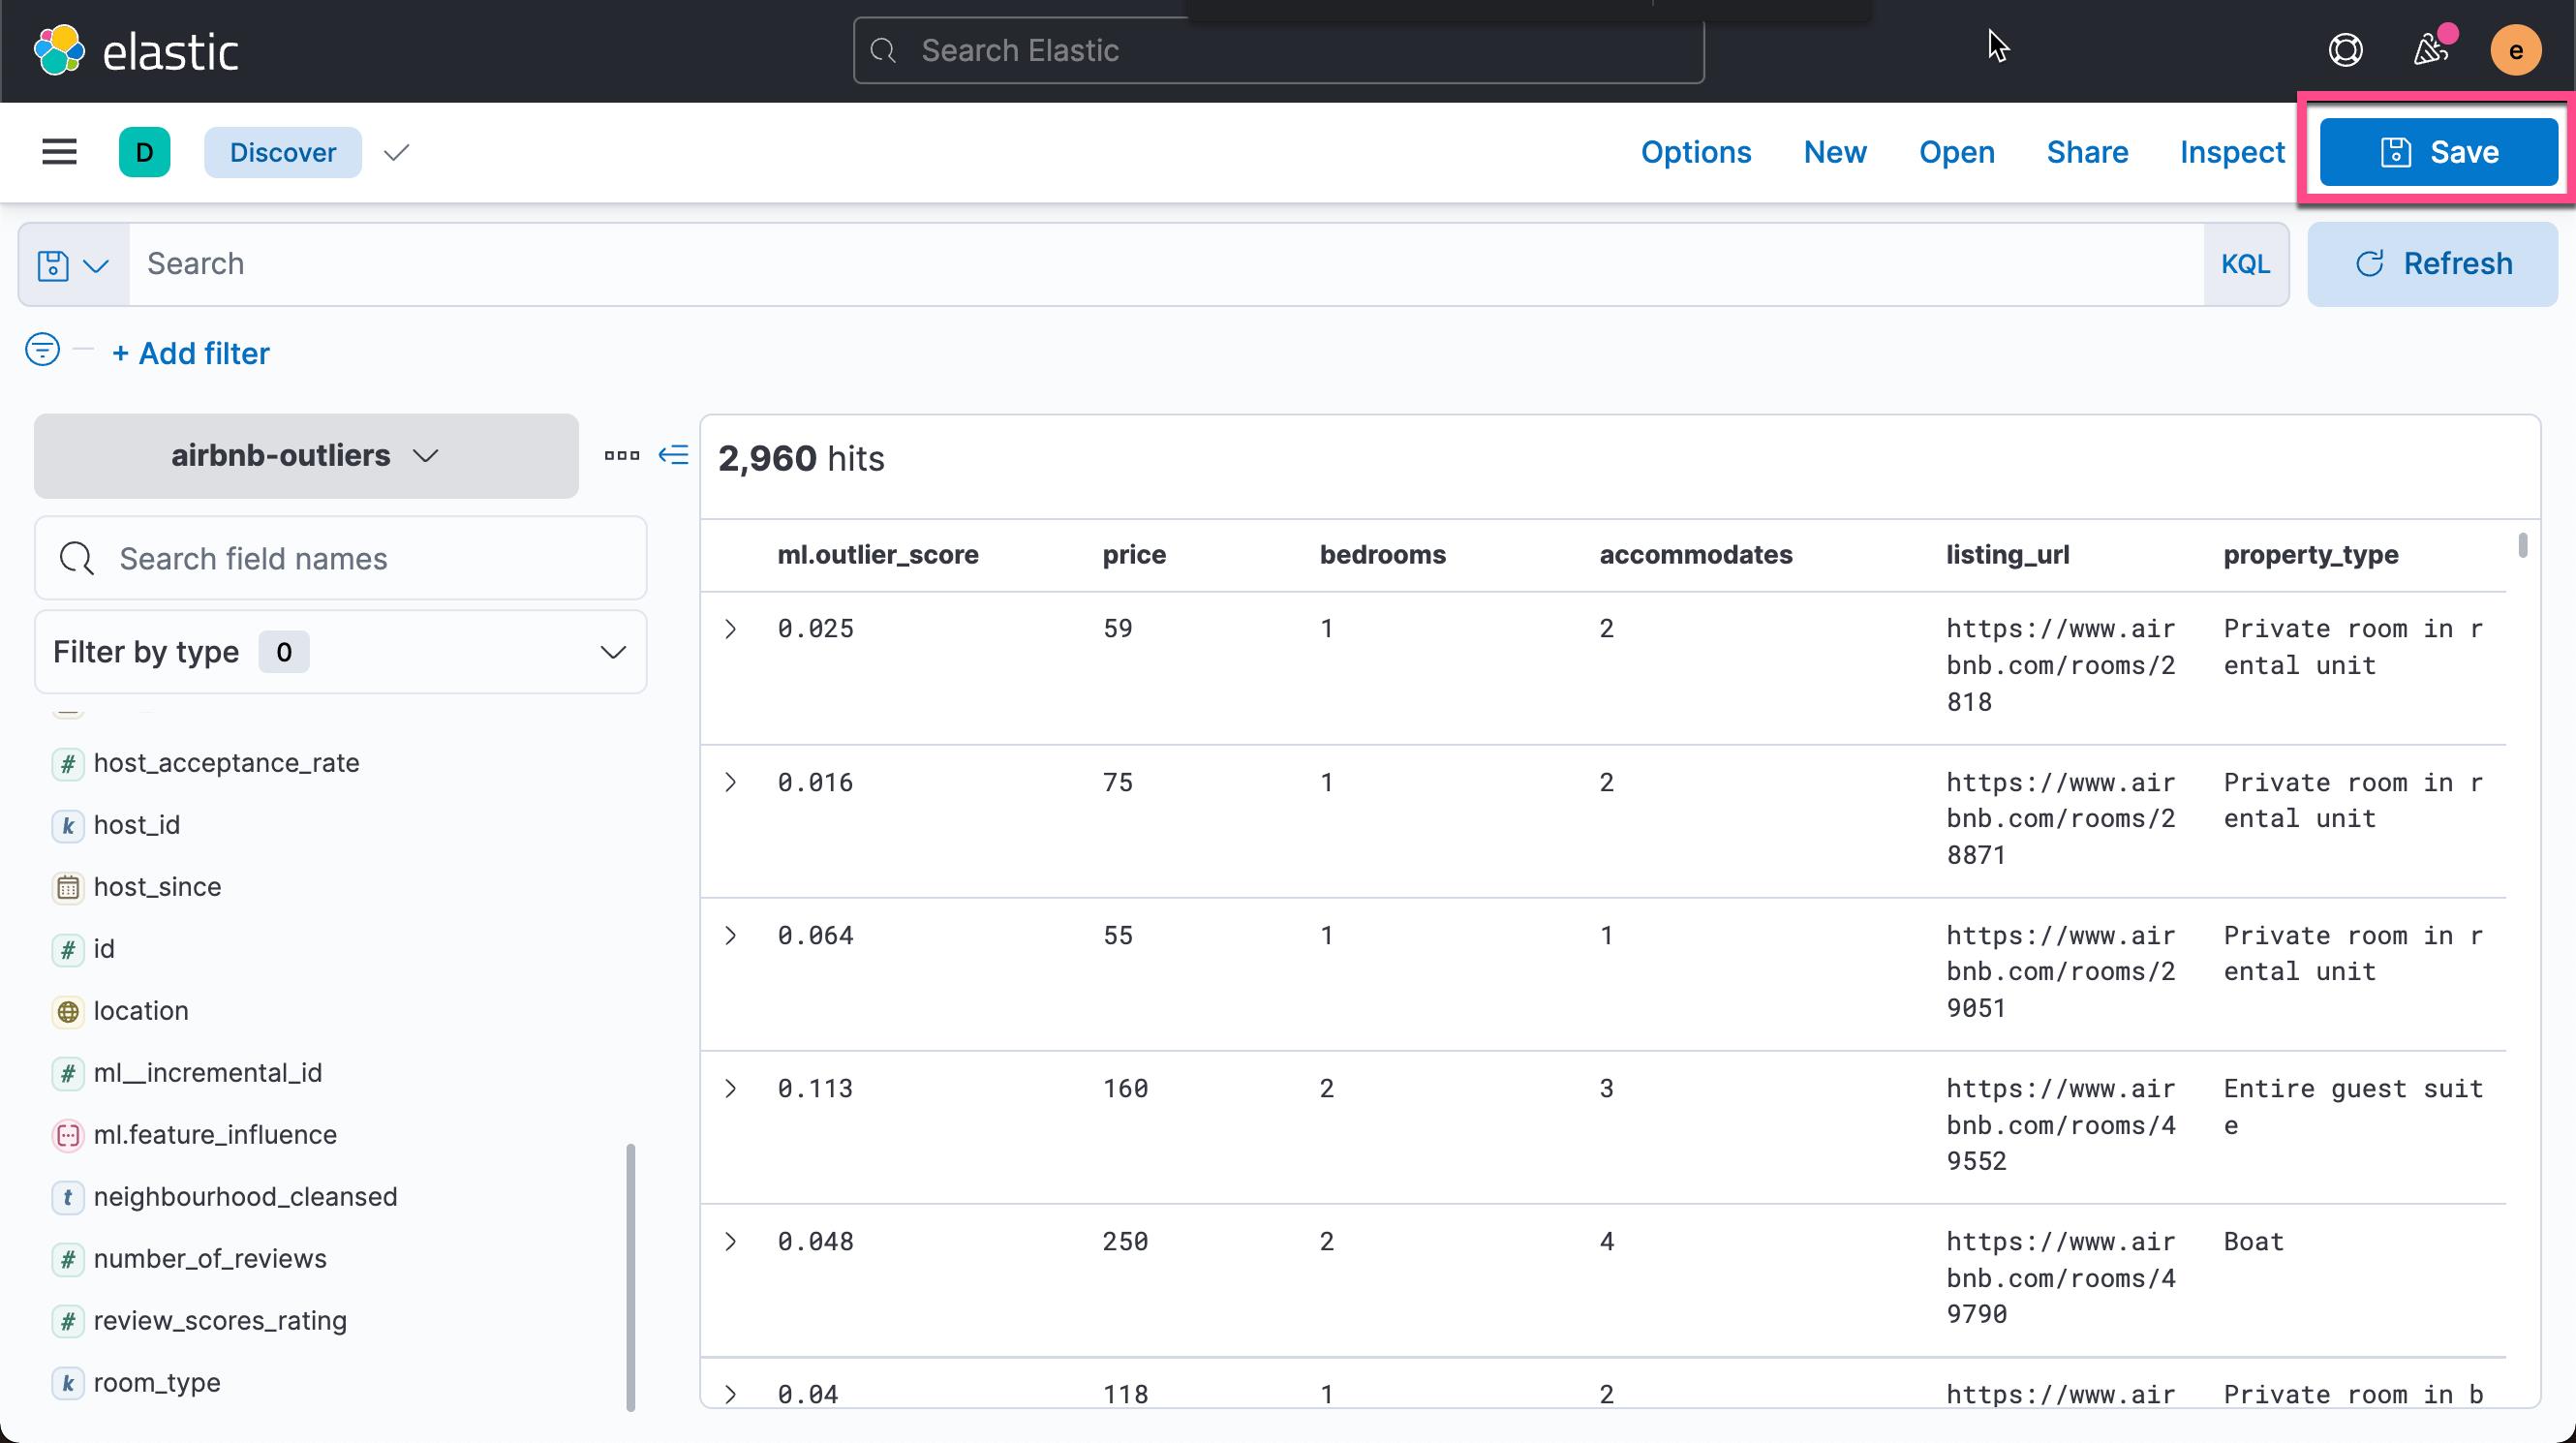
点击上面的 Save 按钮:
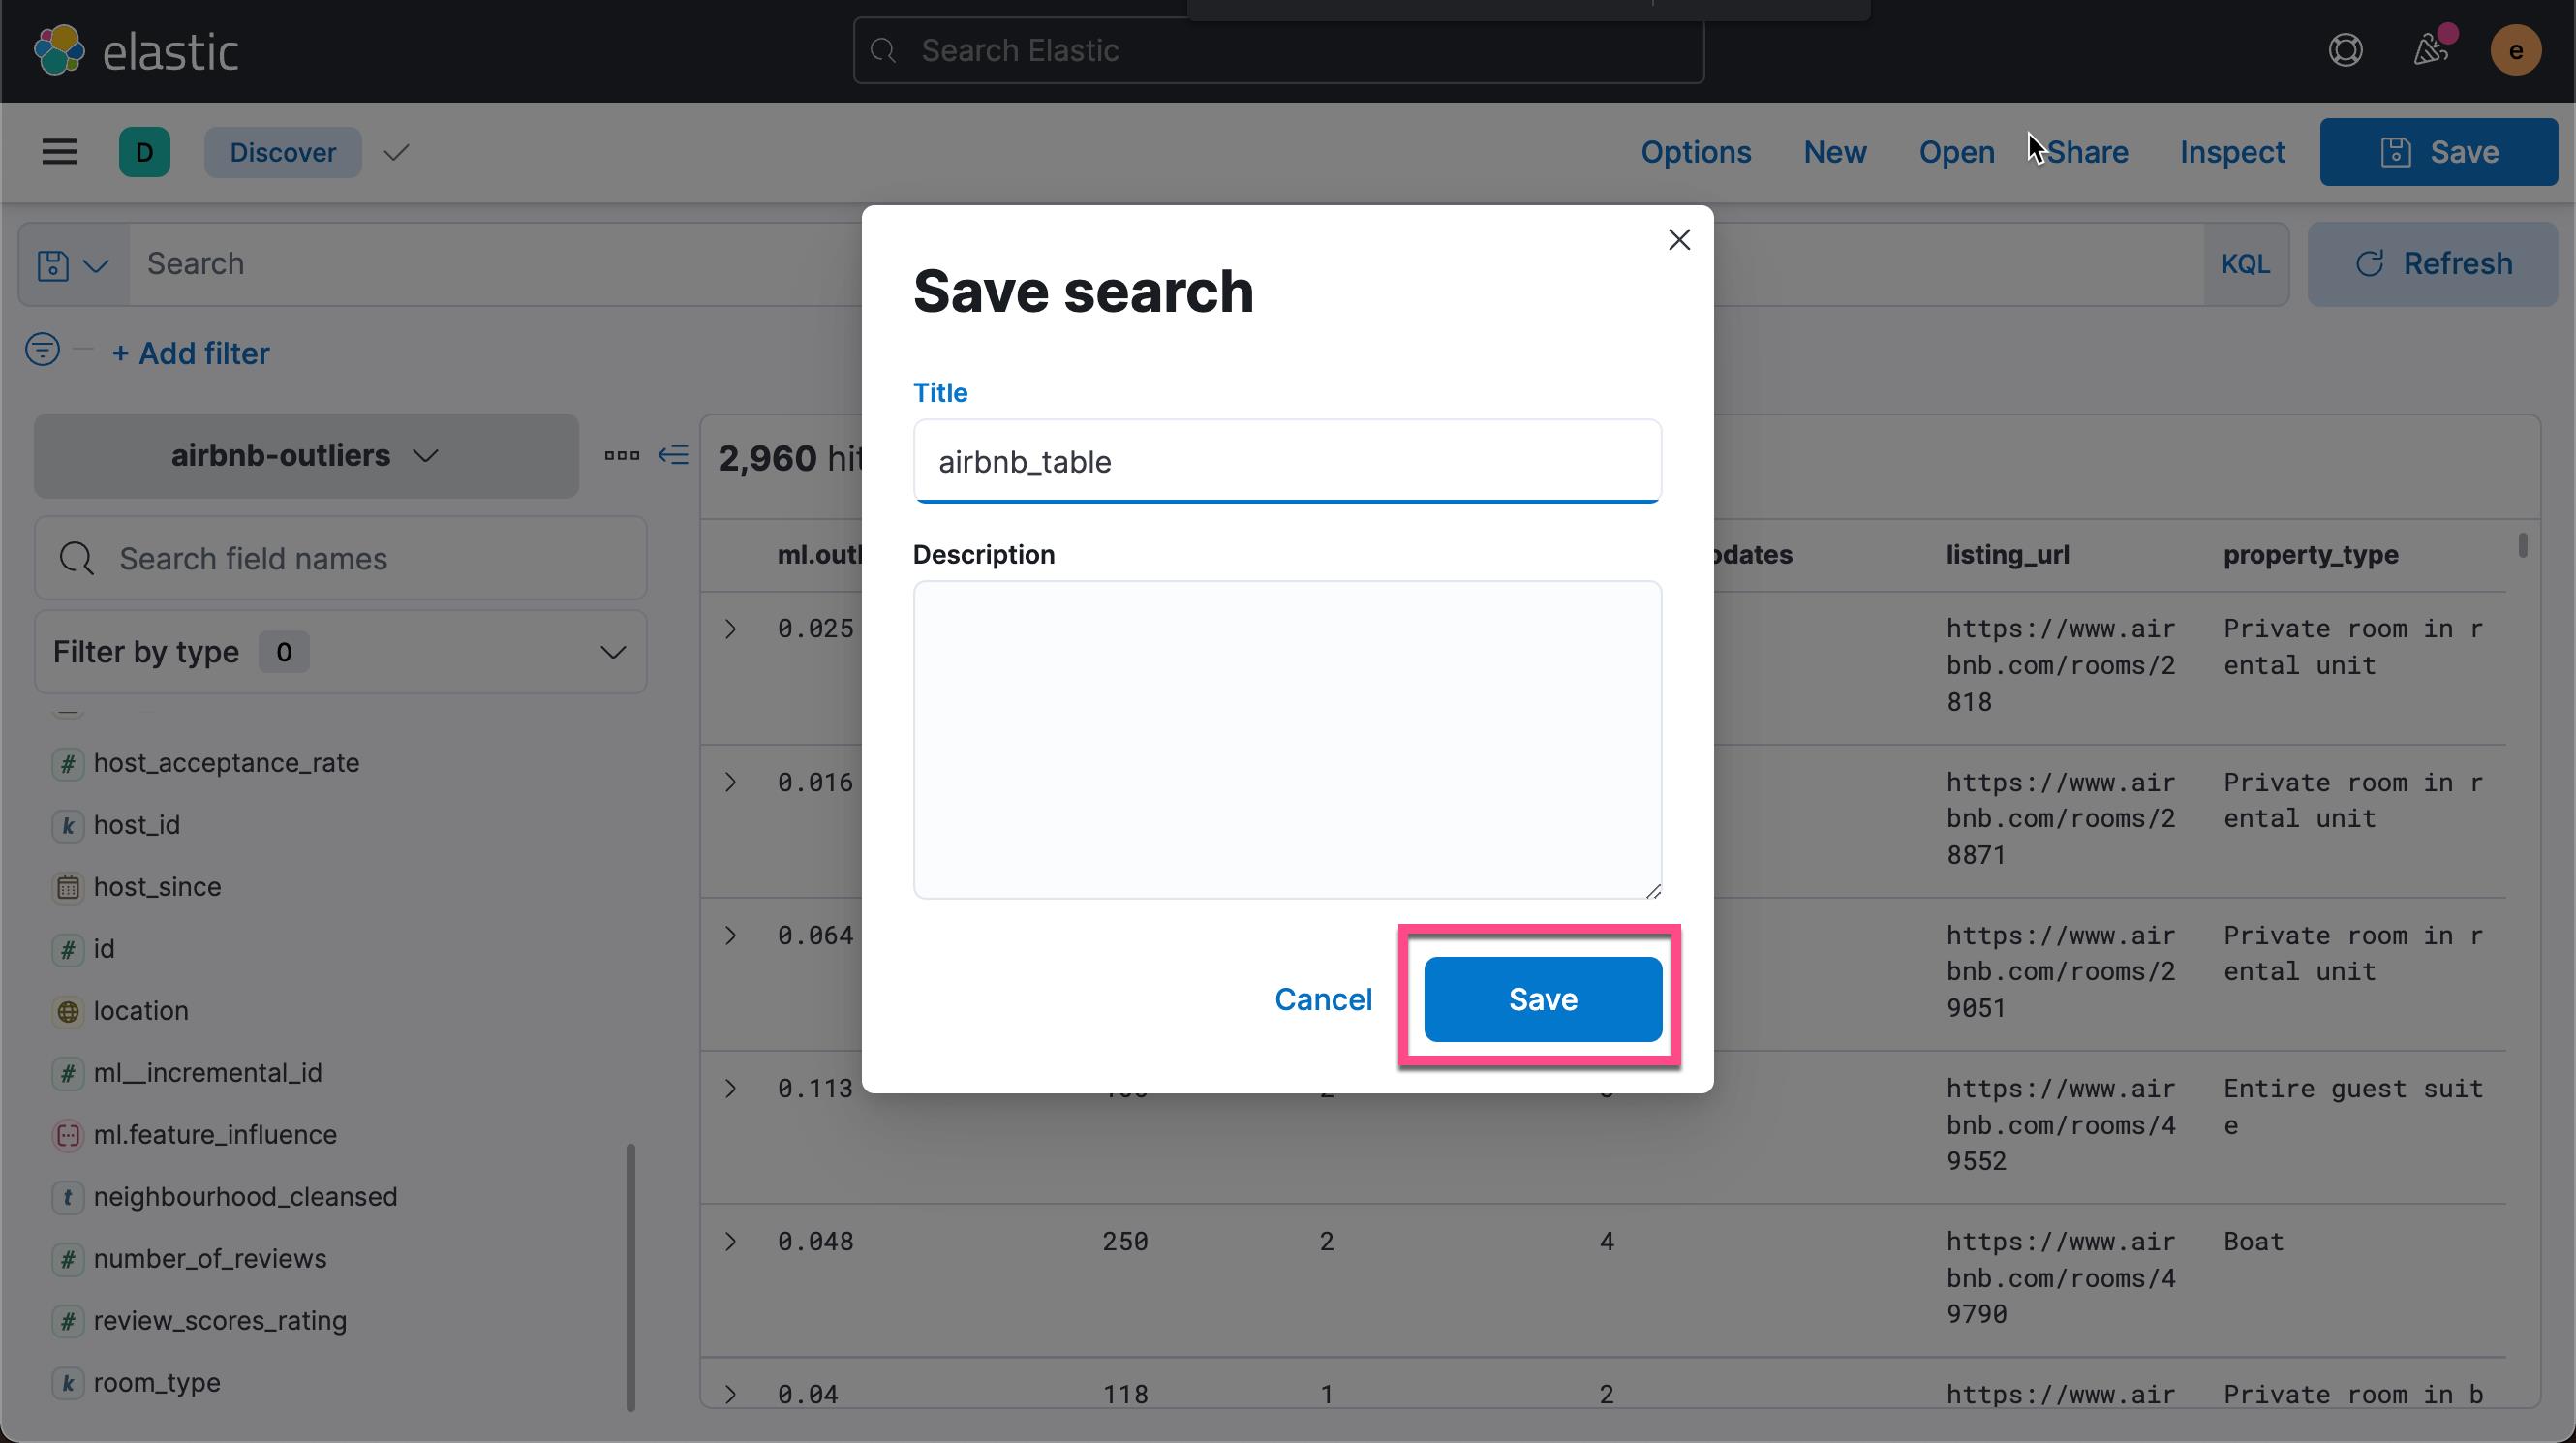
这样我们就保存了一个叫做 airbnb_table 的可视化。我们再次回到 Dashboard:
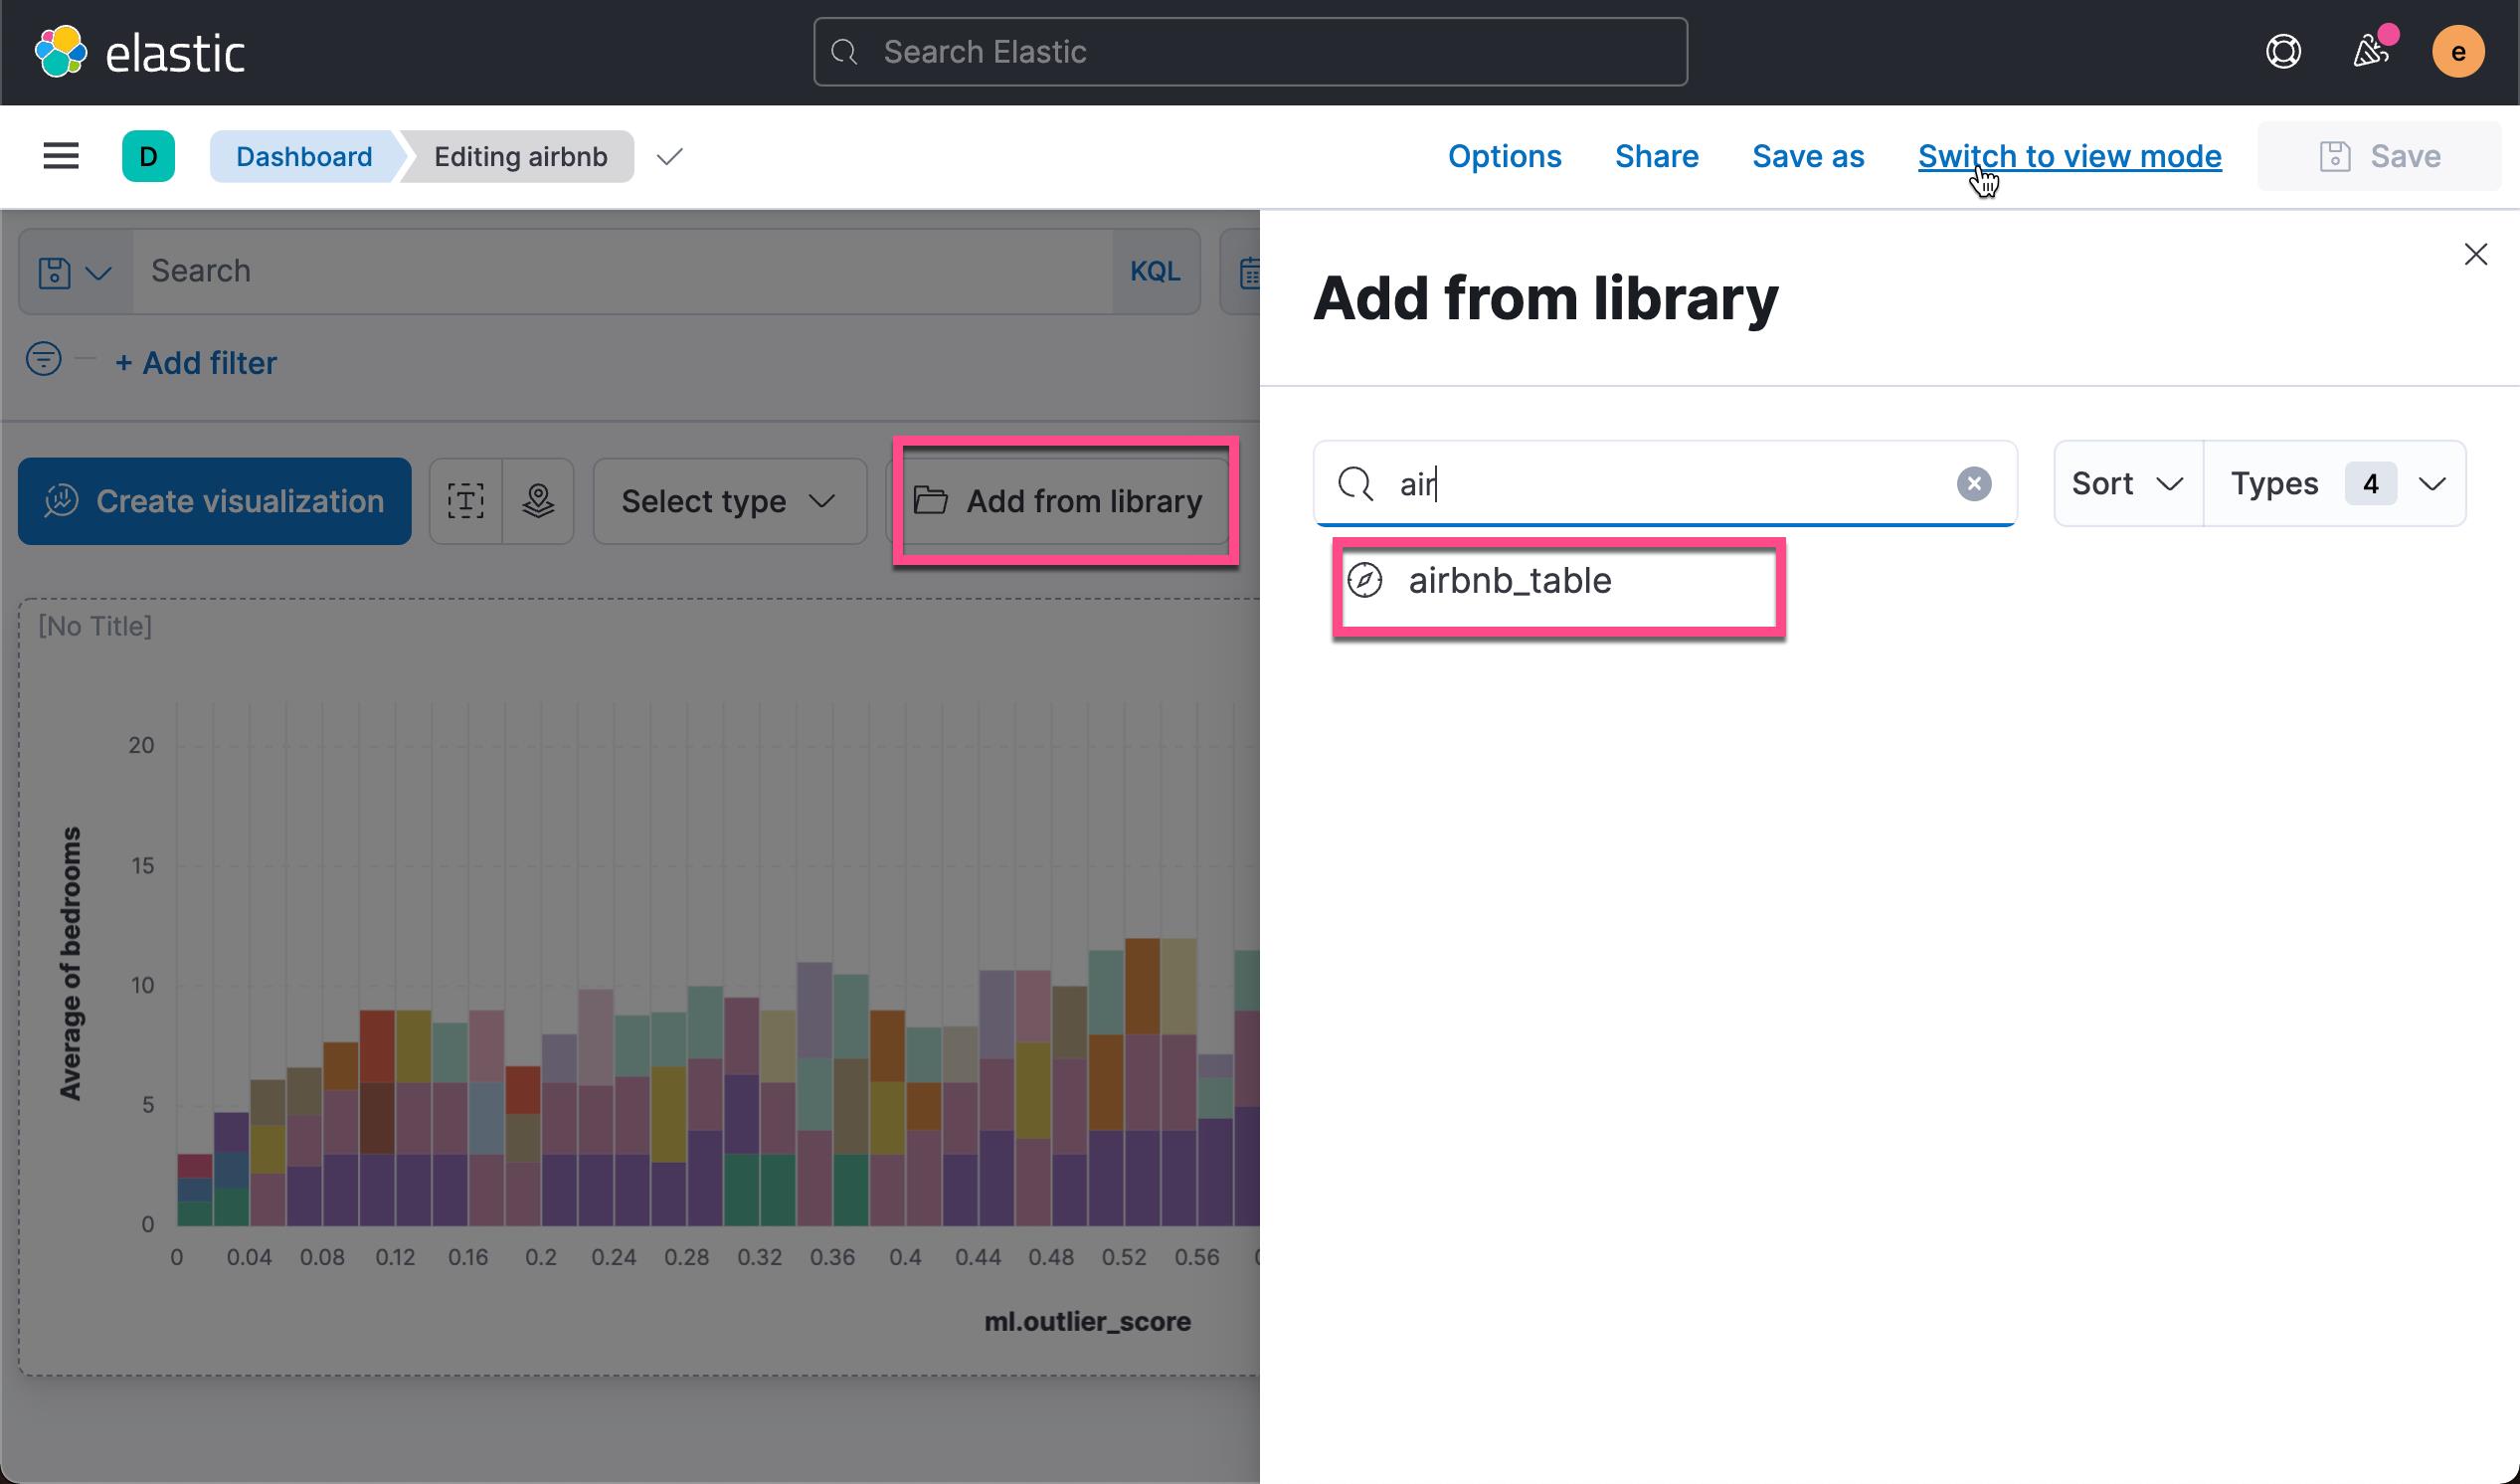
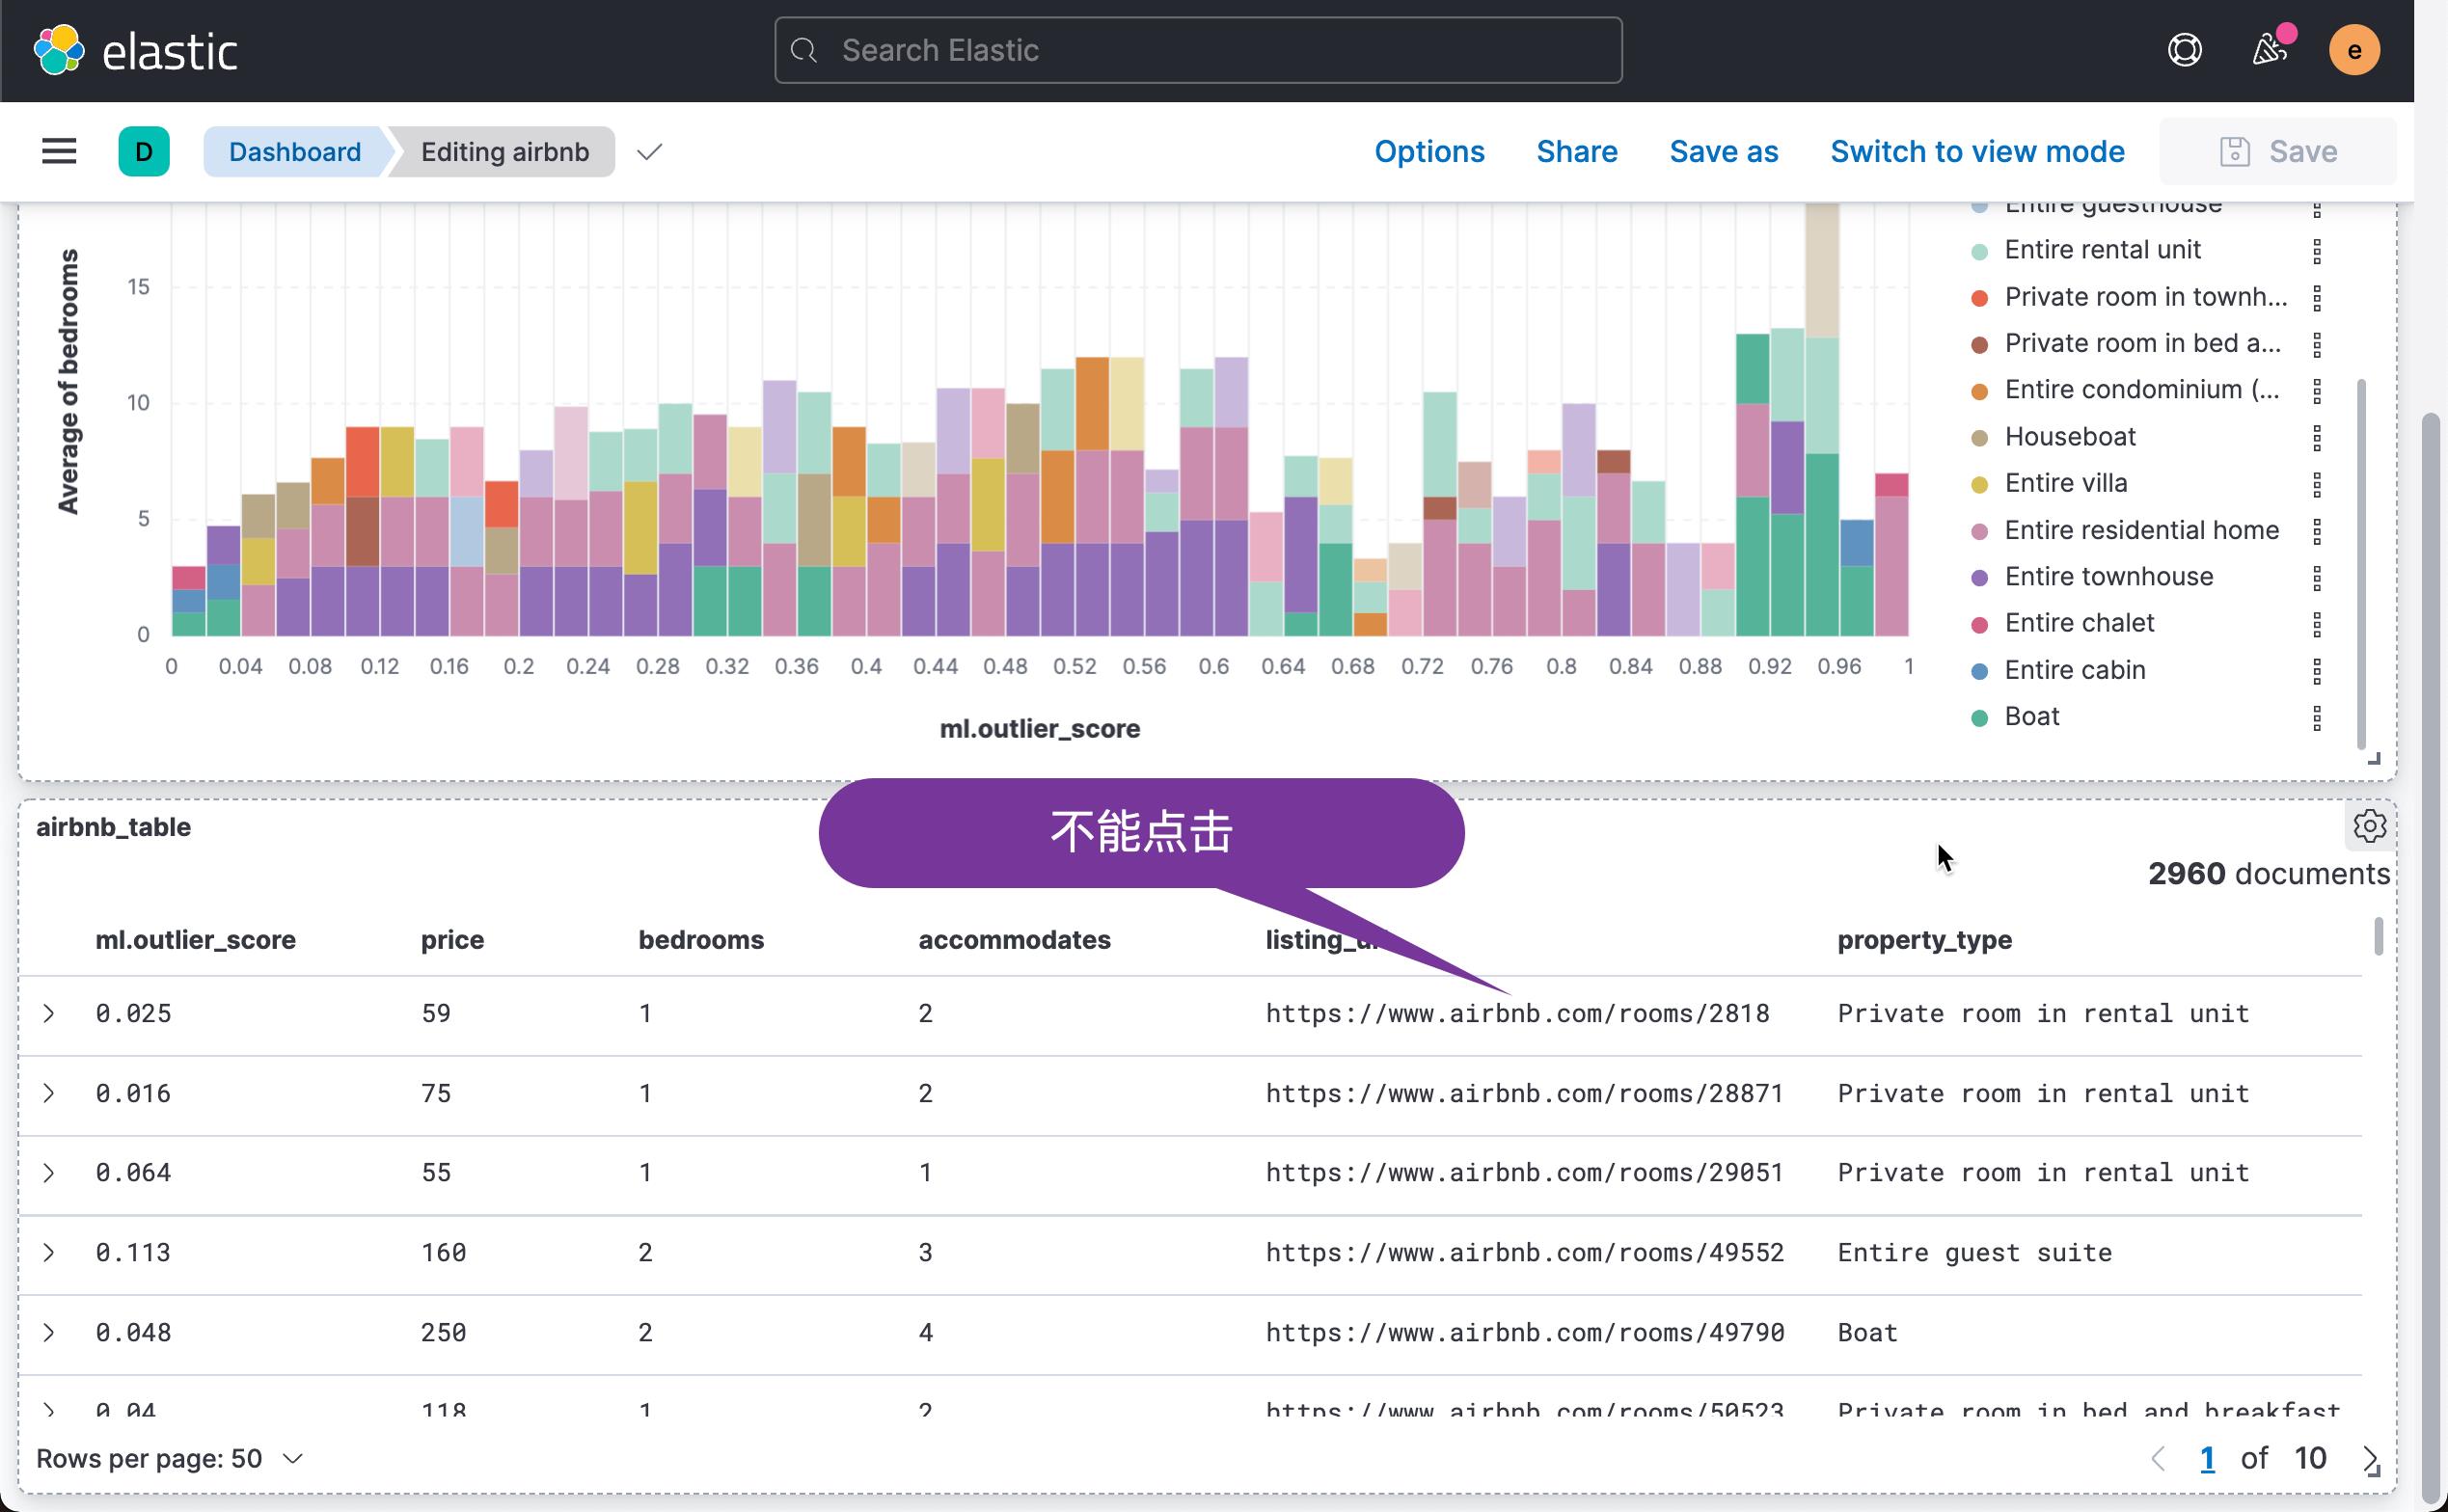
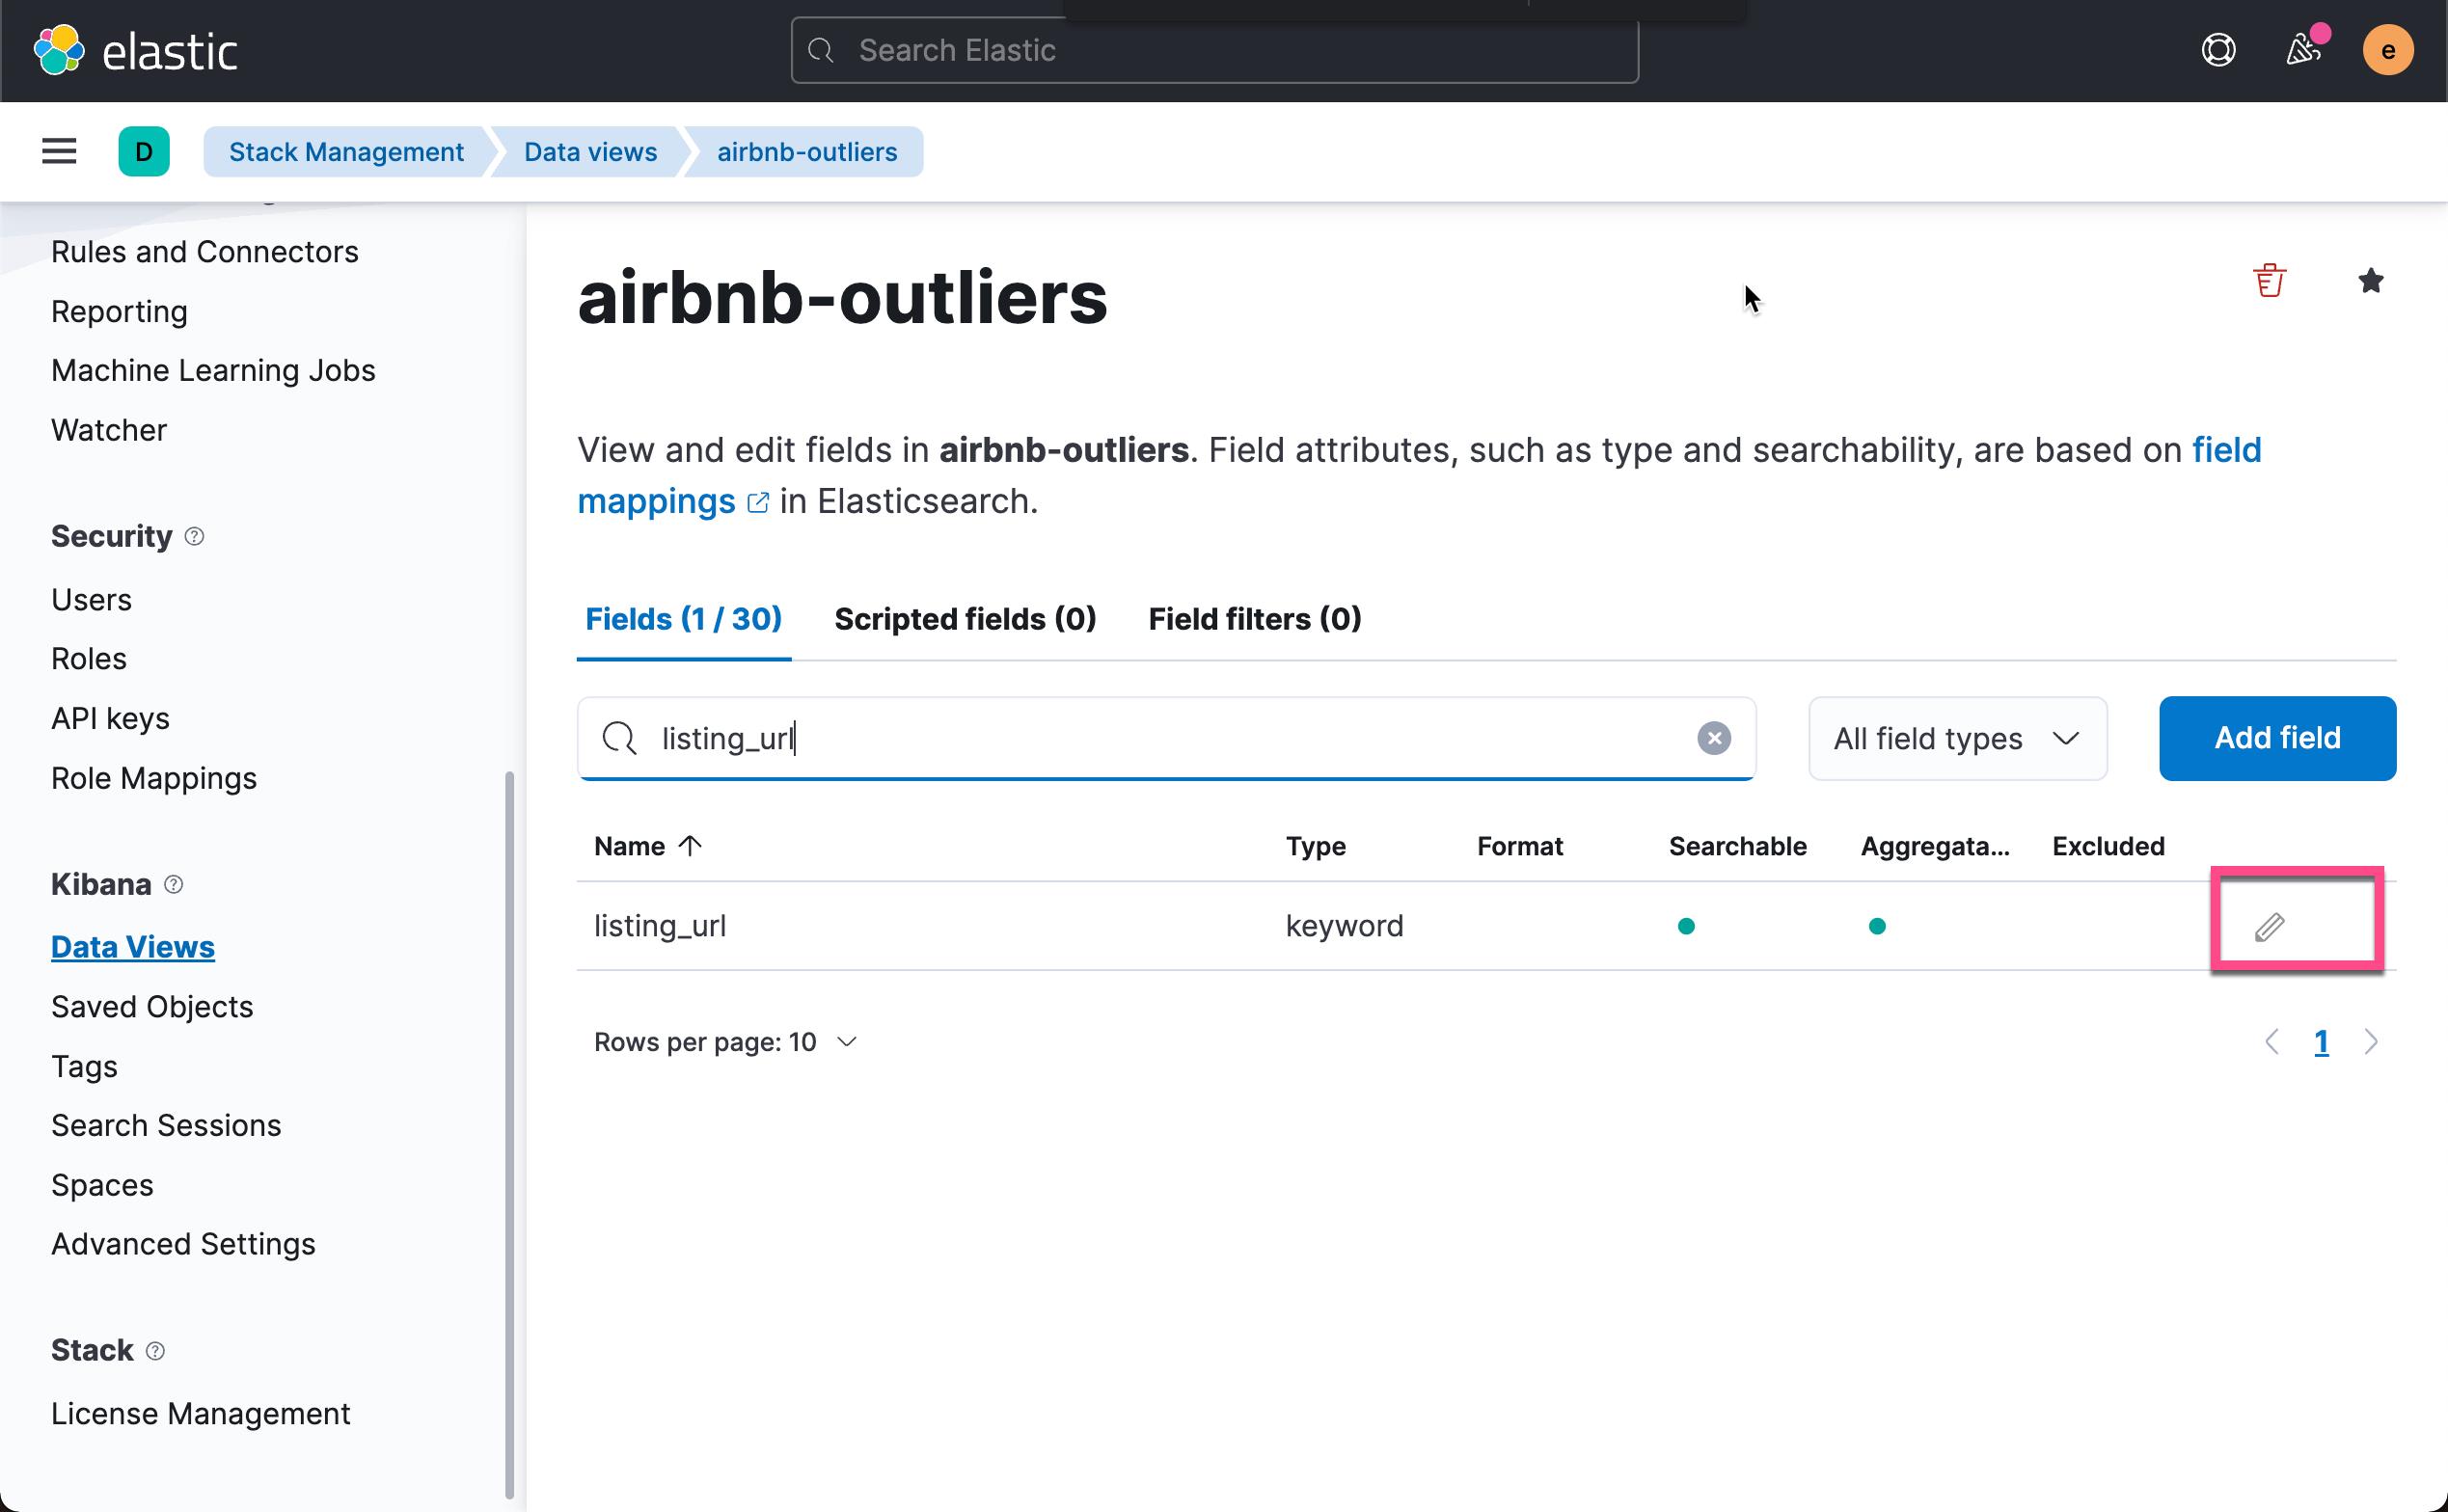
这样就得到了我们想要的第二个可视化图。细心的开发者可能已经发现,我们的 listing_url 是不可以点击的,尽管它是一个链接的地址。为了能够使得它能够被点击,我们需要做如下的配置:


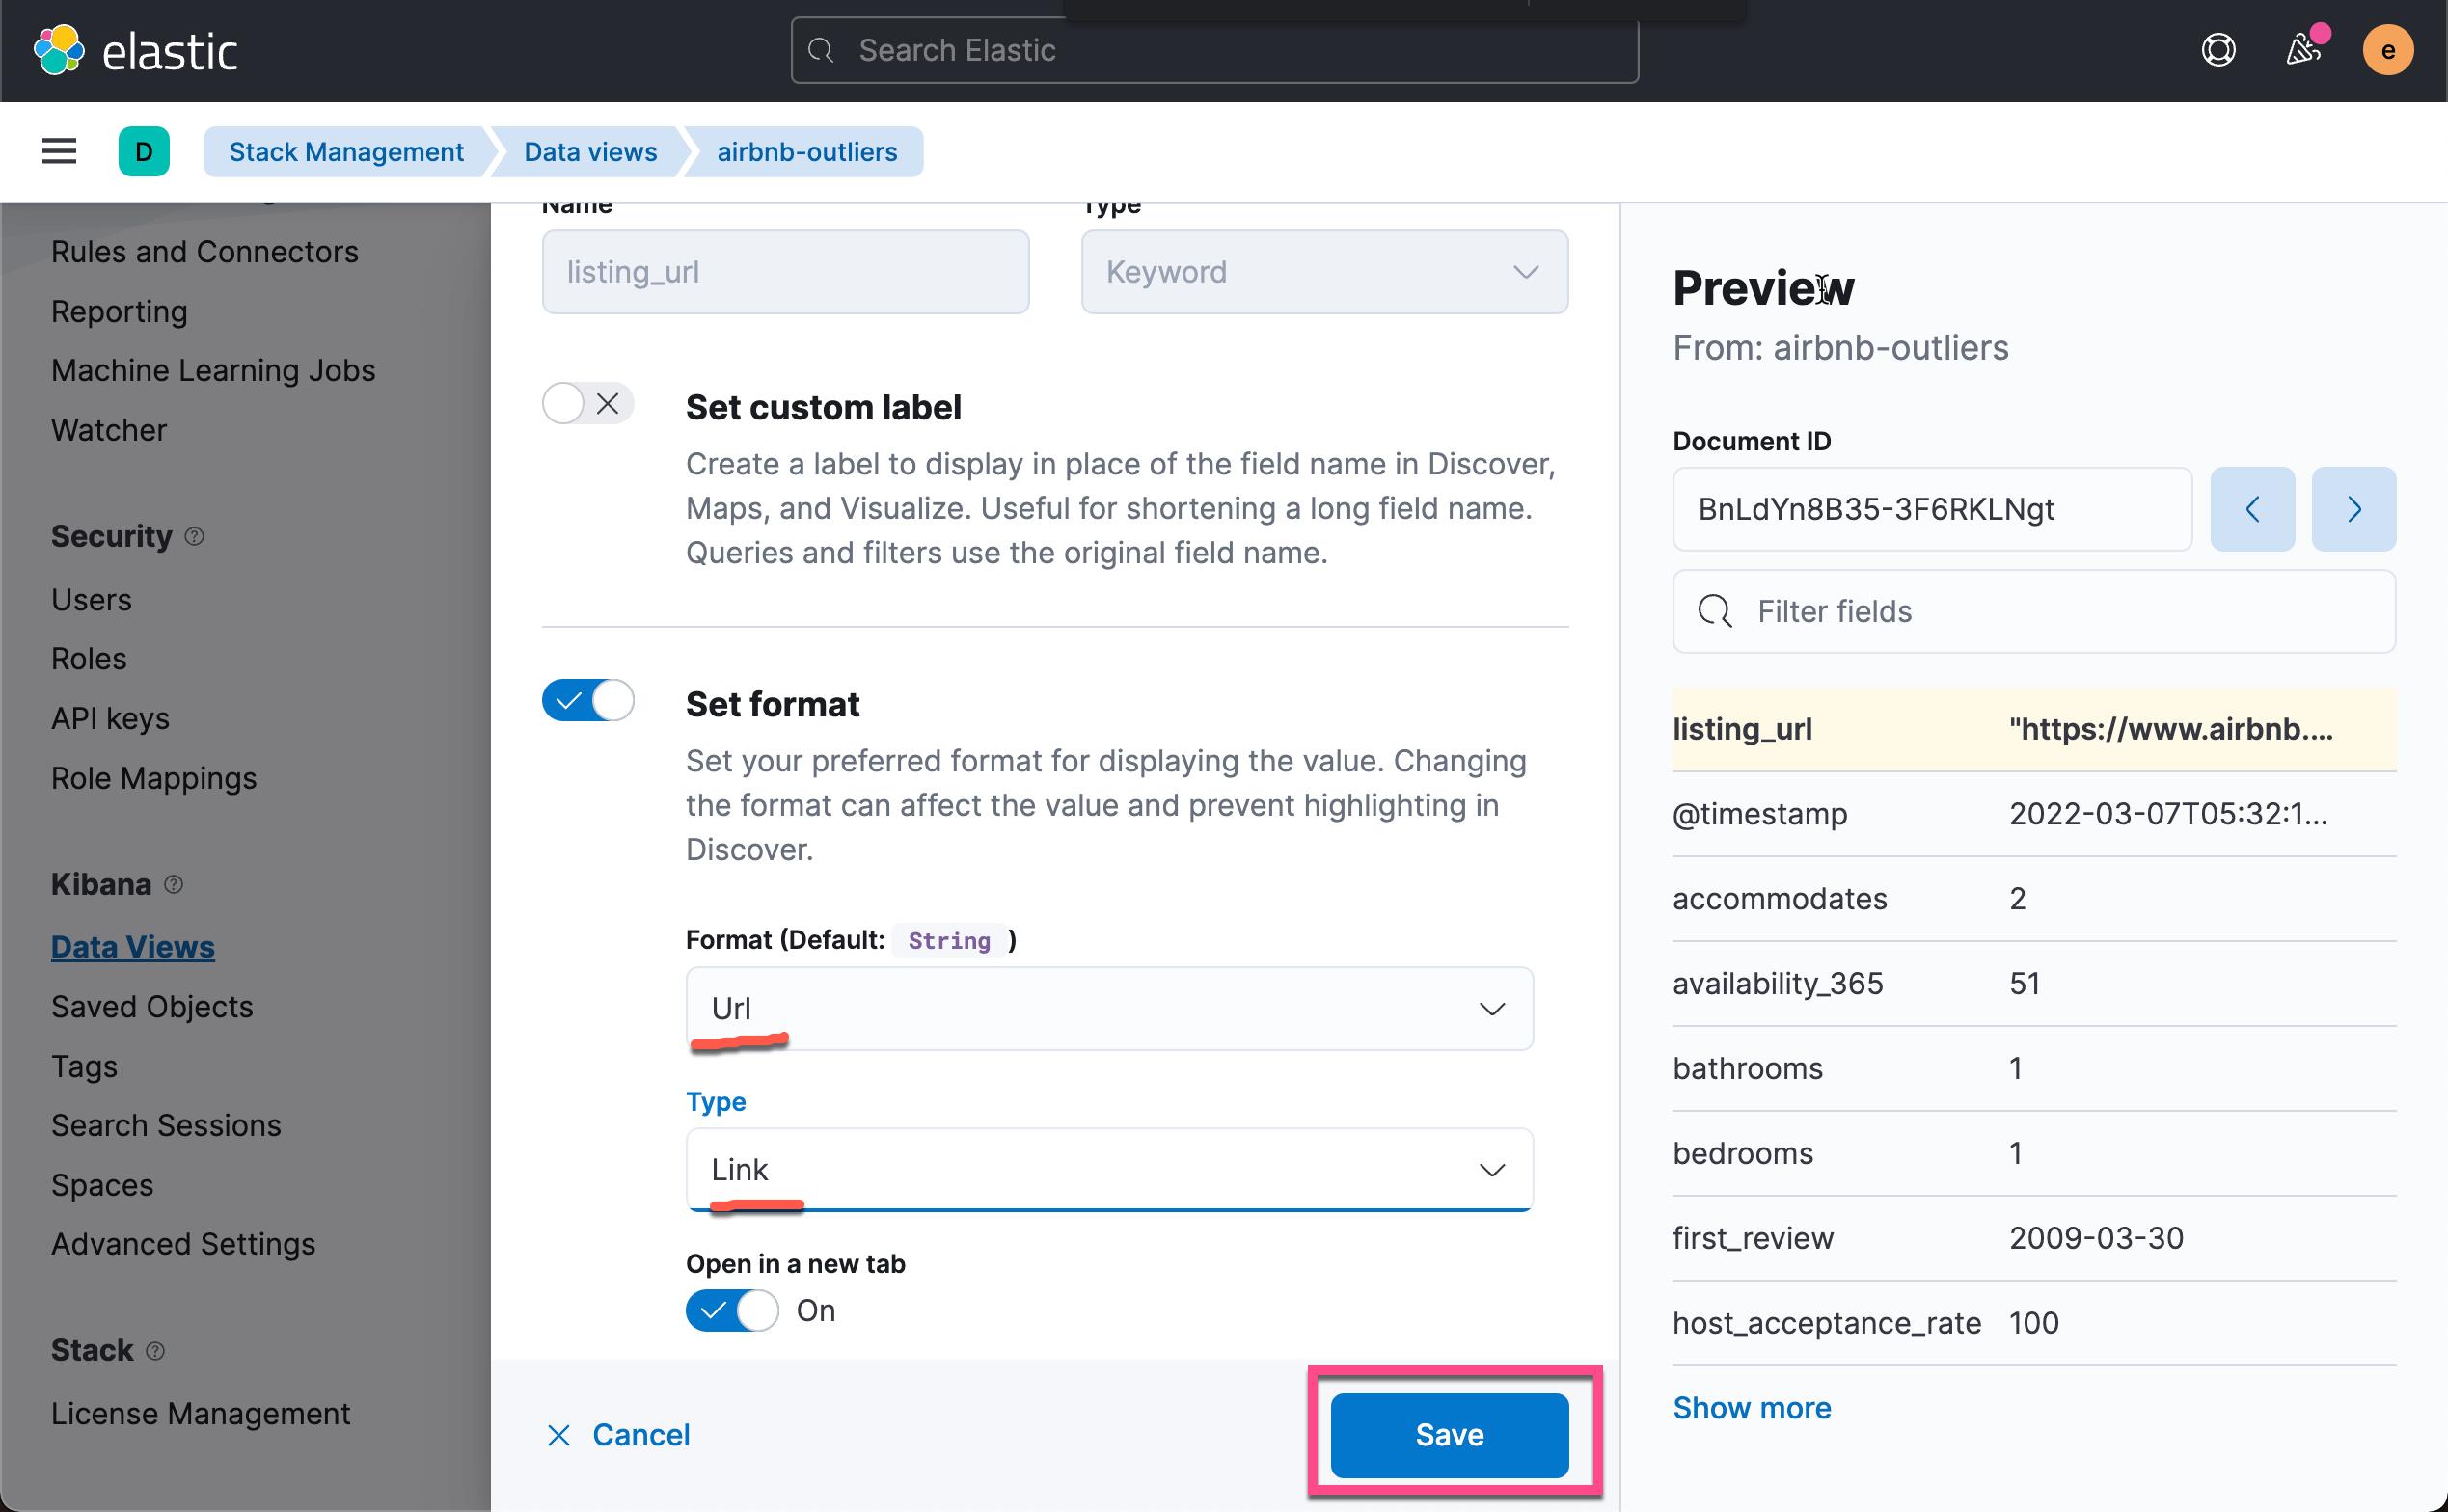
点击上面的 Save 按钮。我们再次回到 Dashboard 的表格里进行查看:
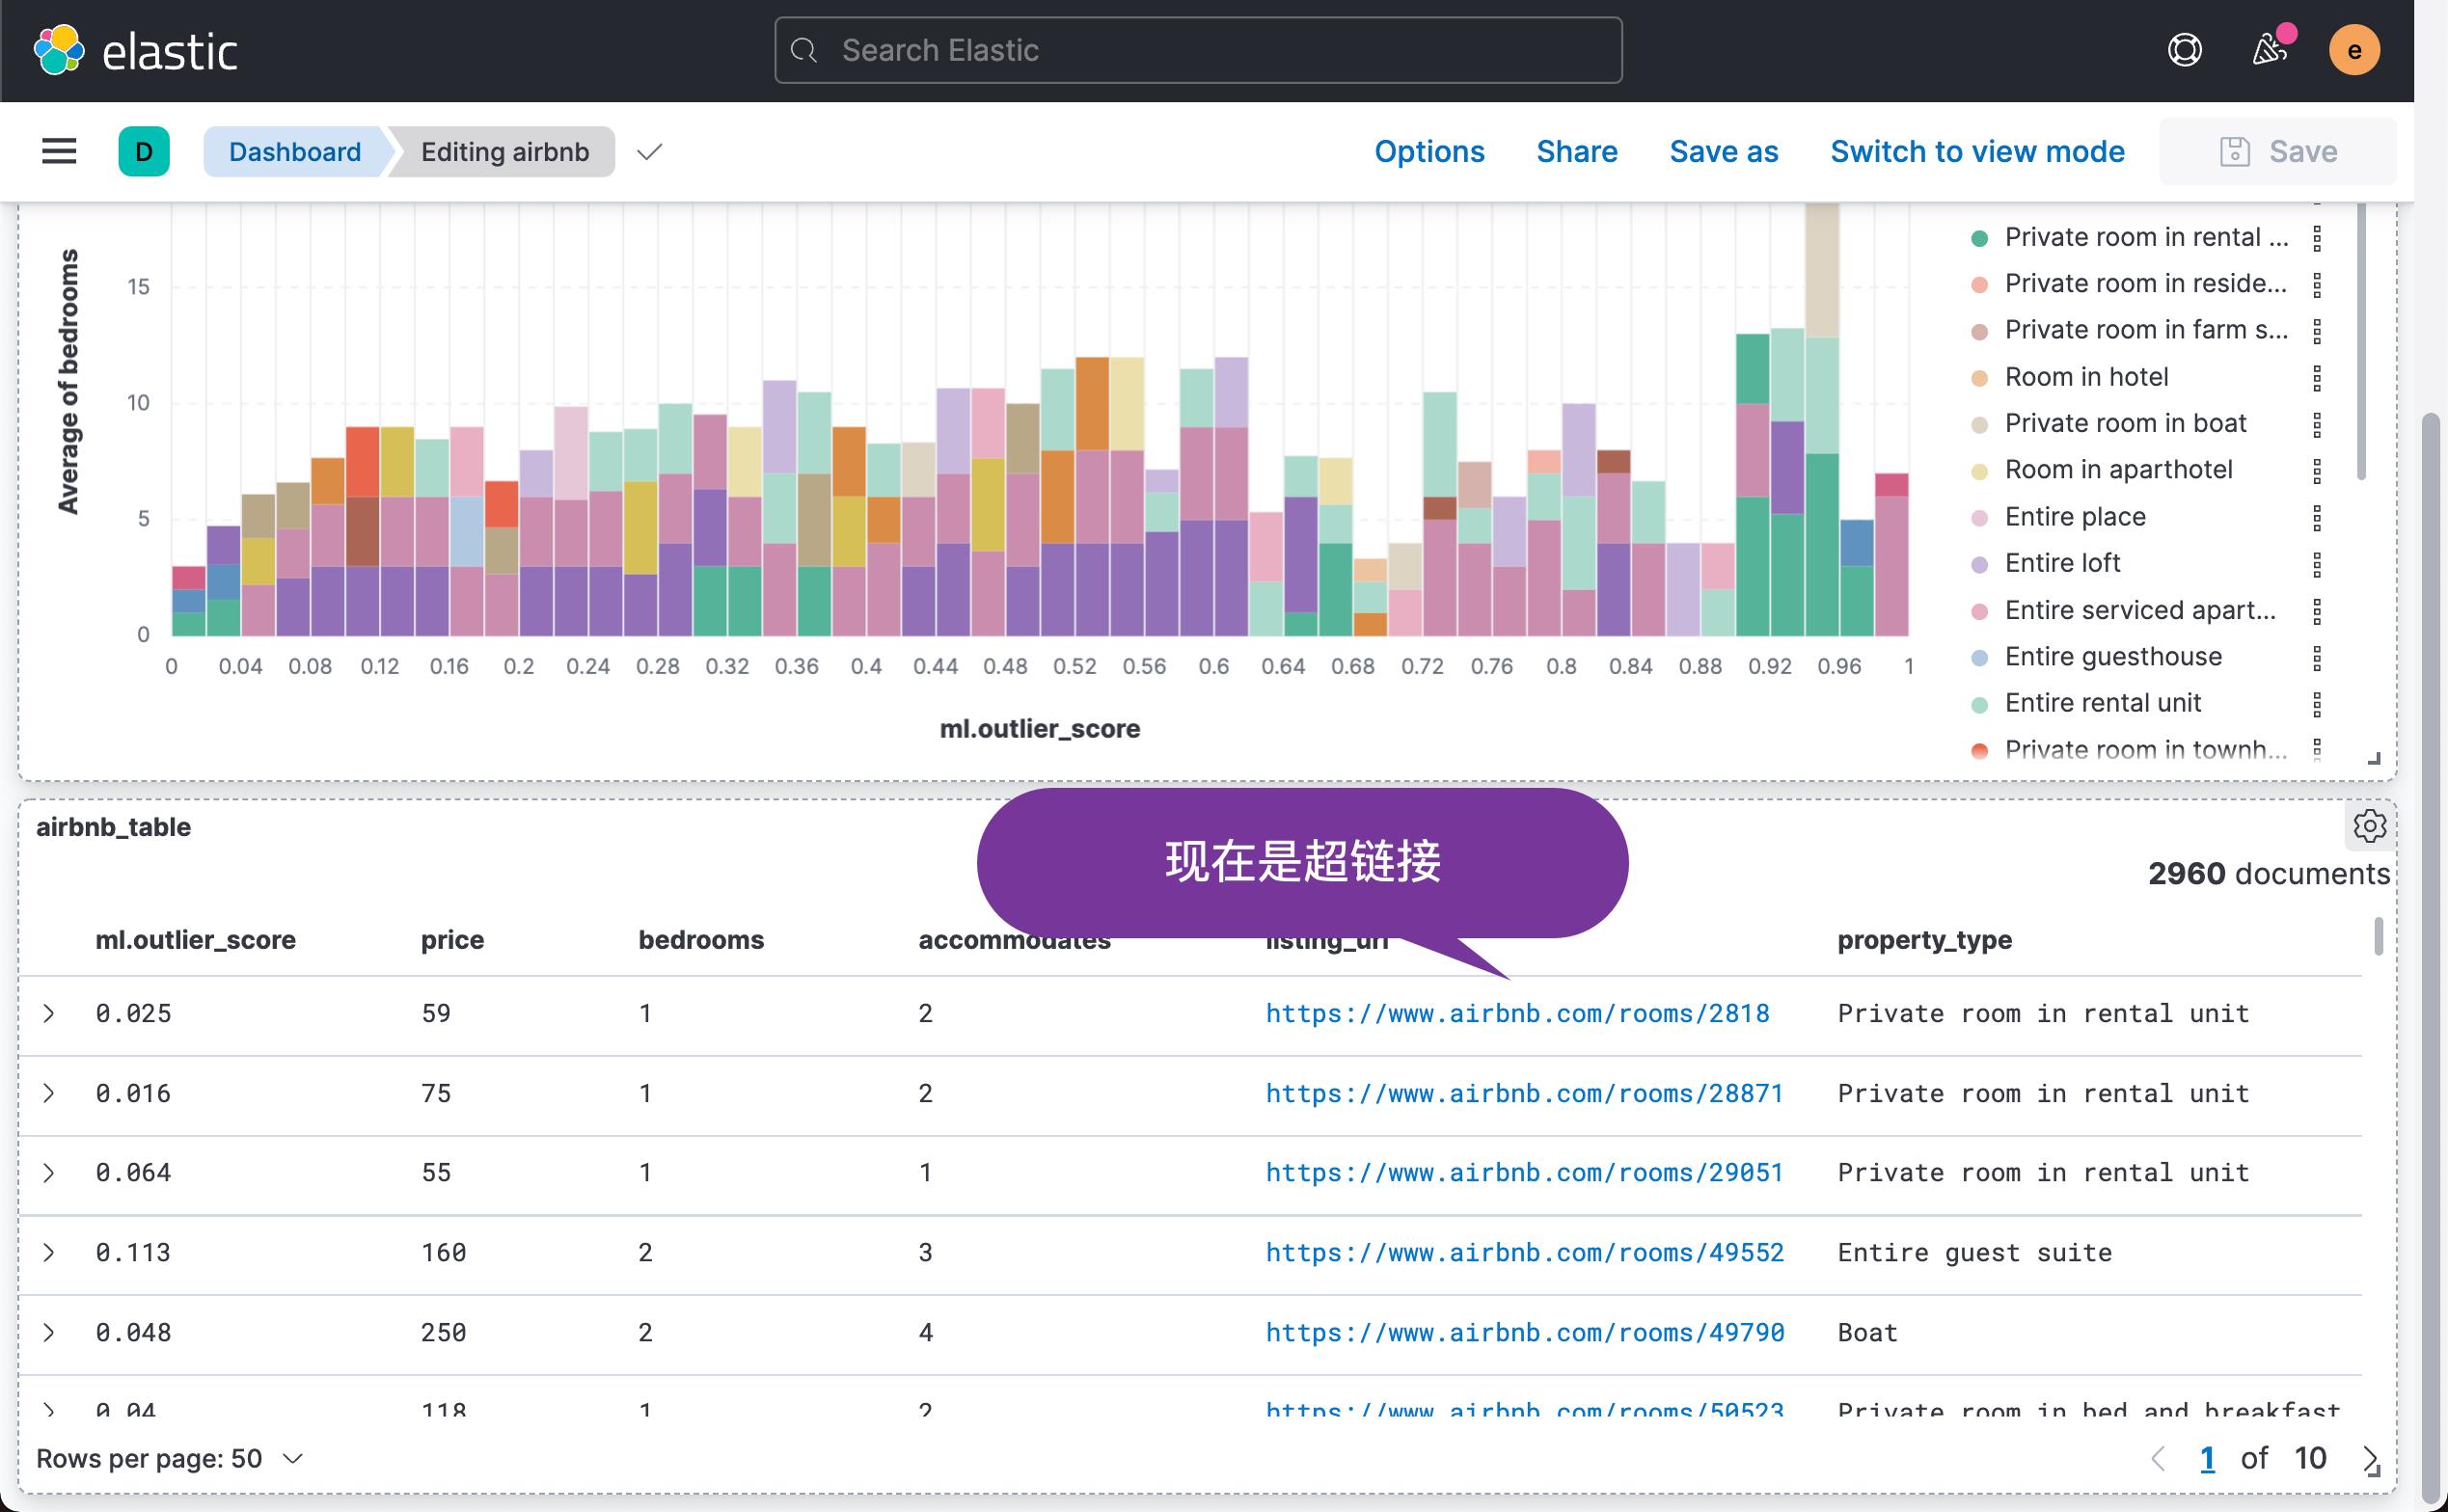
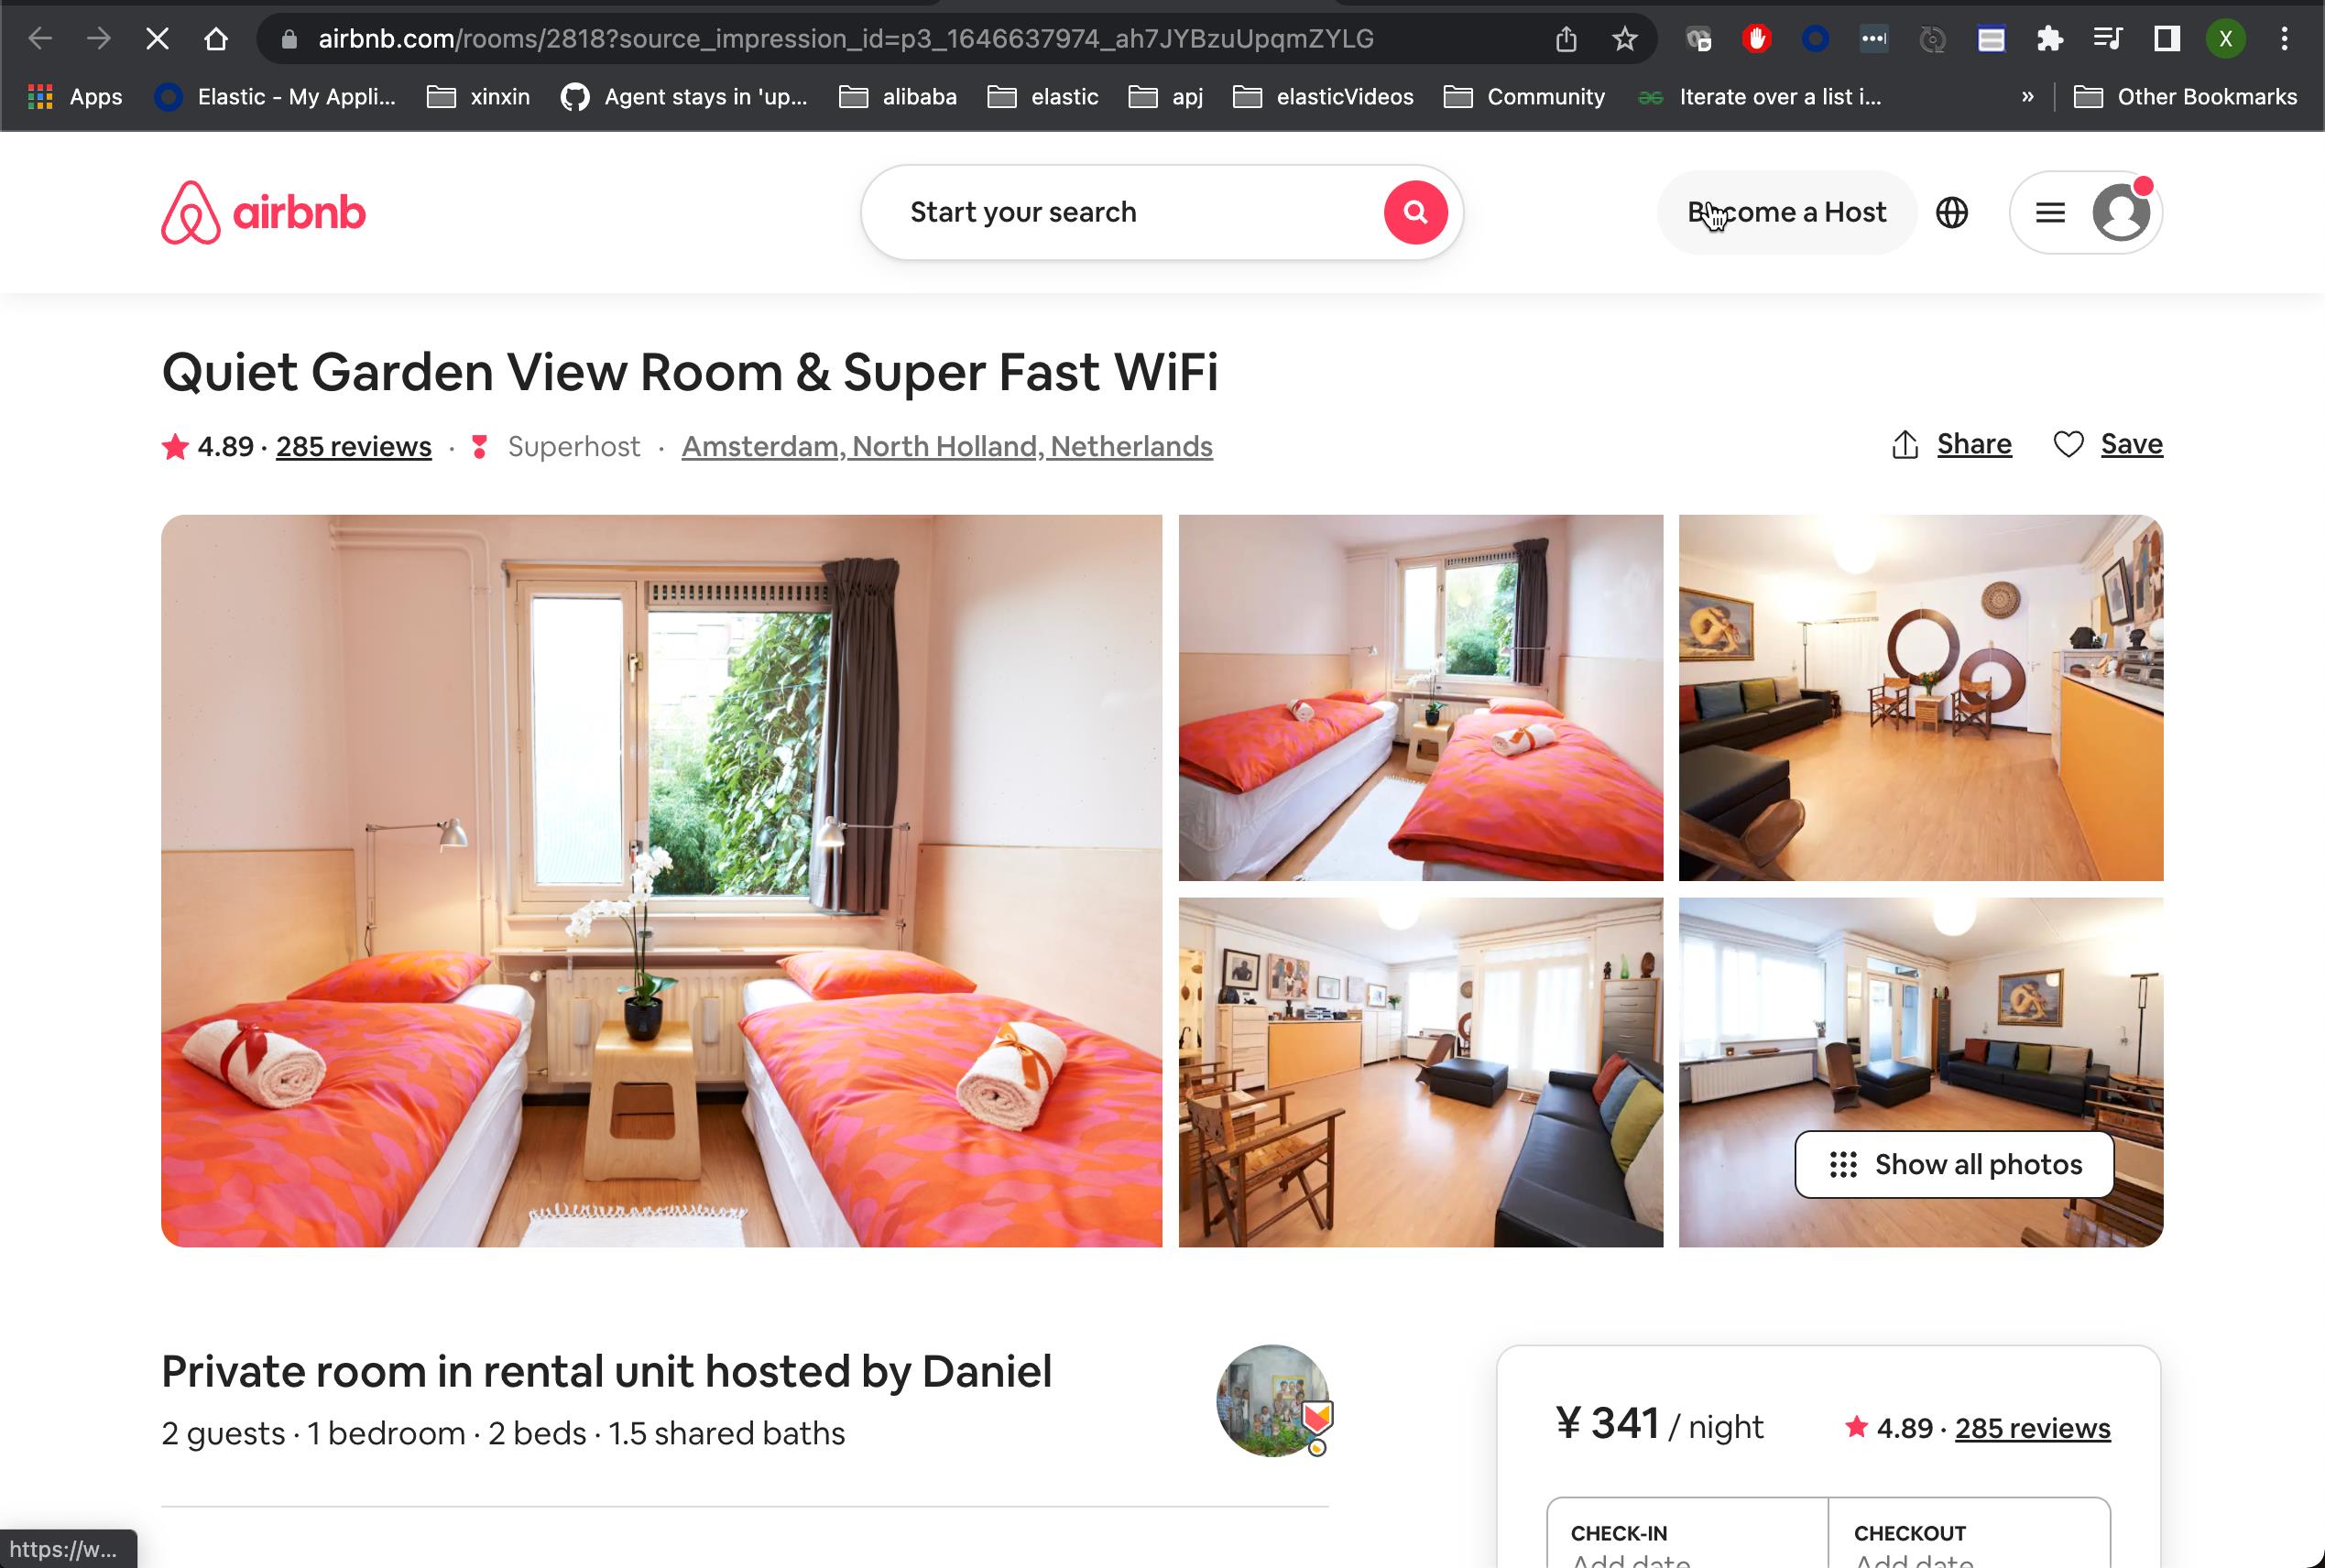
我们发现,现在的链接变成超链接。可以直接进行点击。比如其中的一个链接显示:
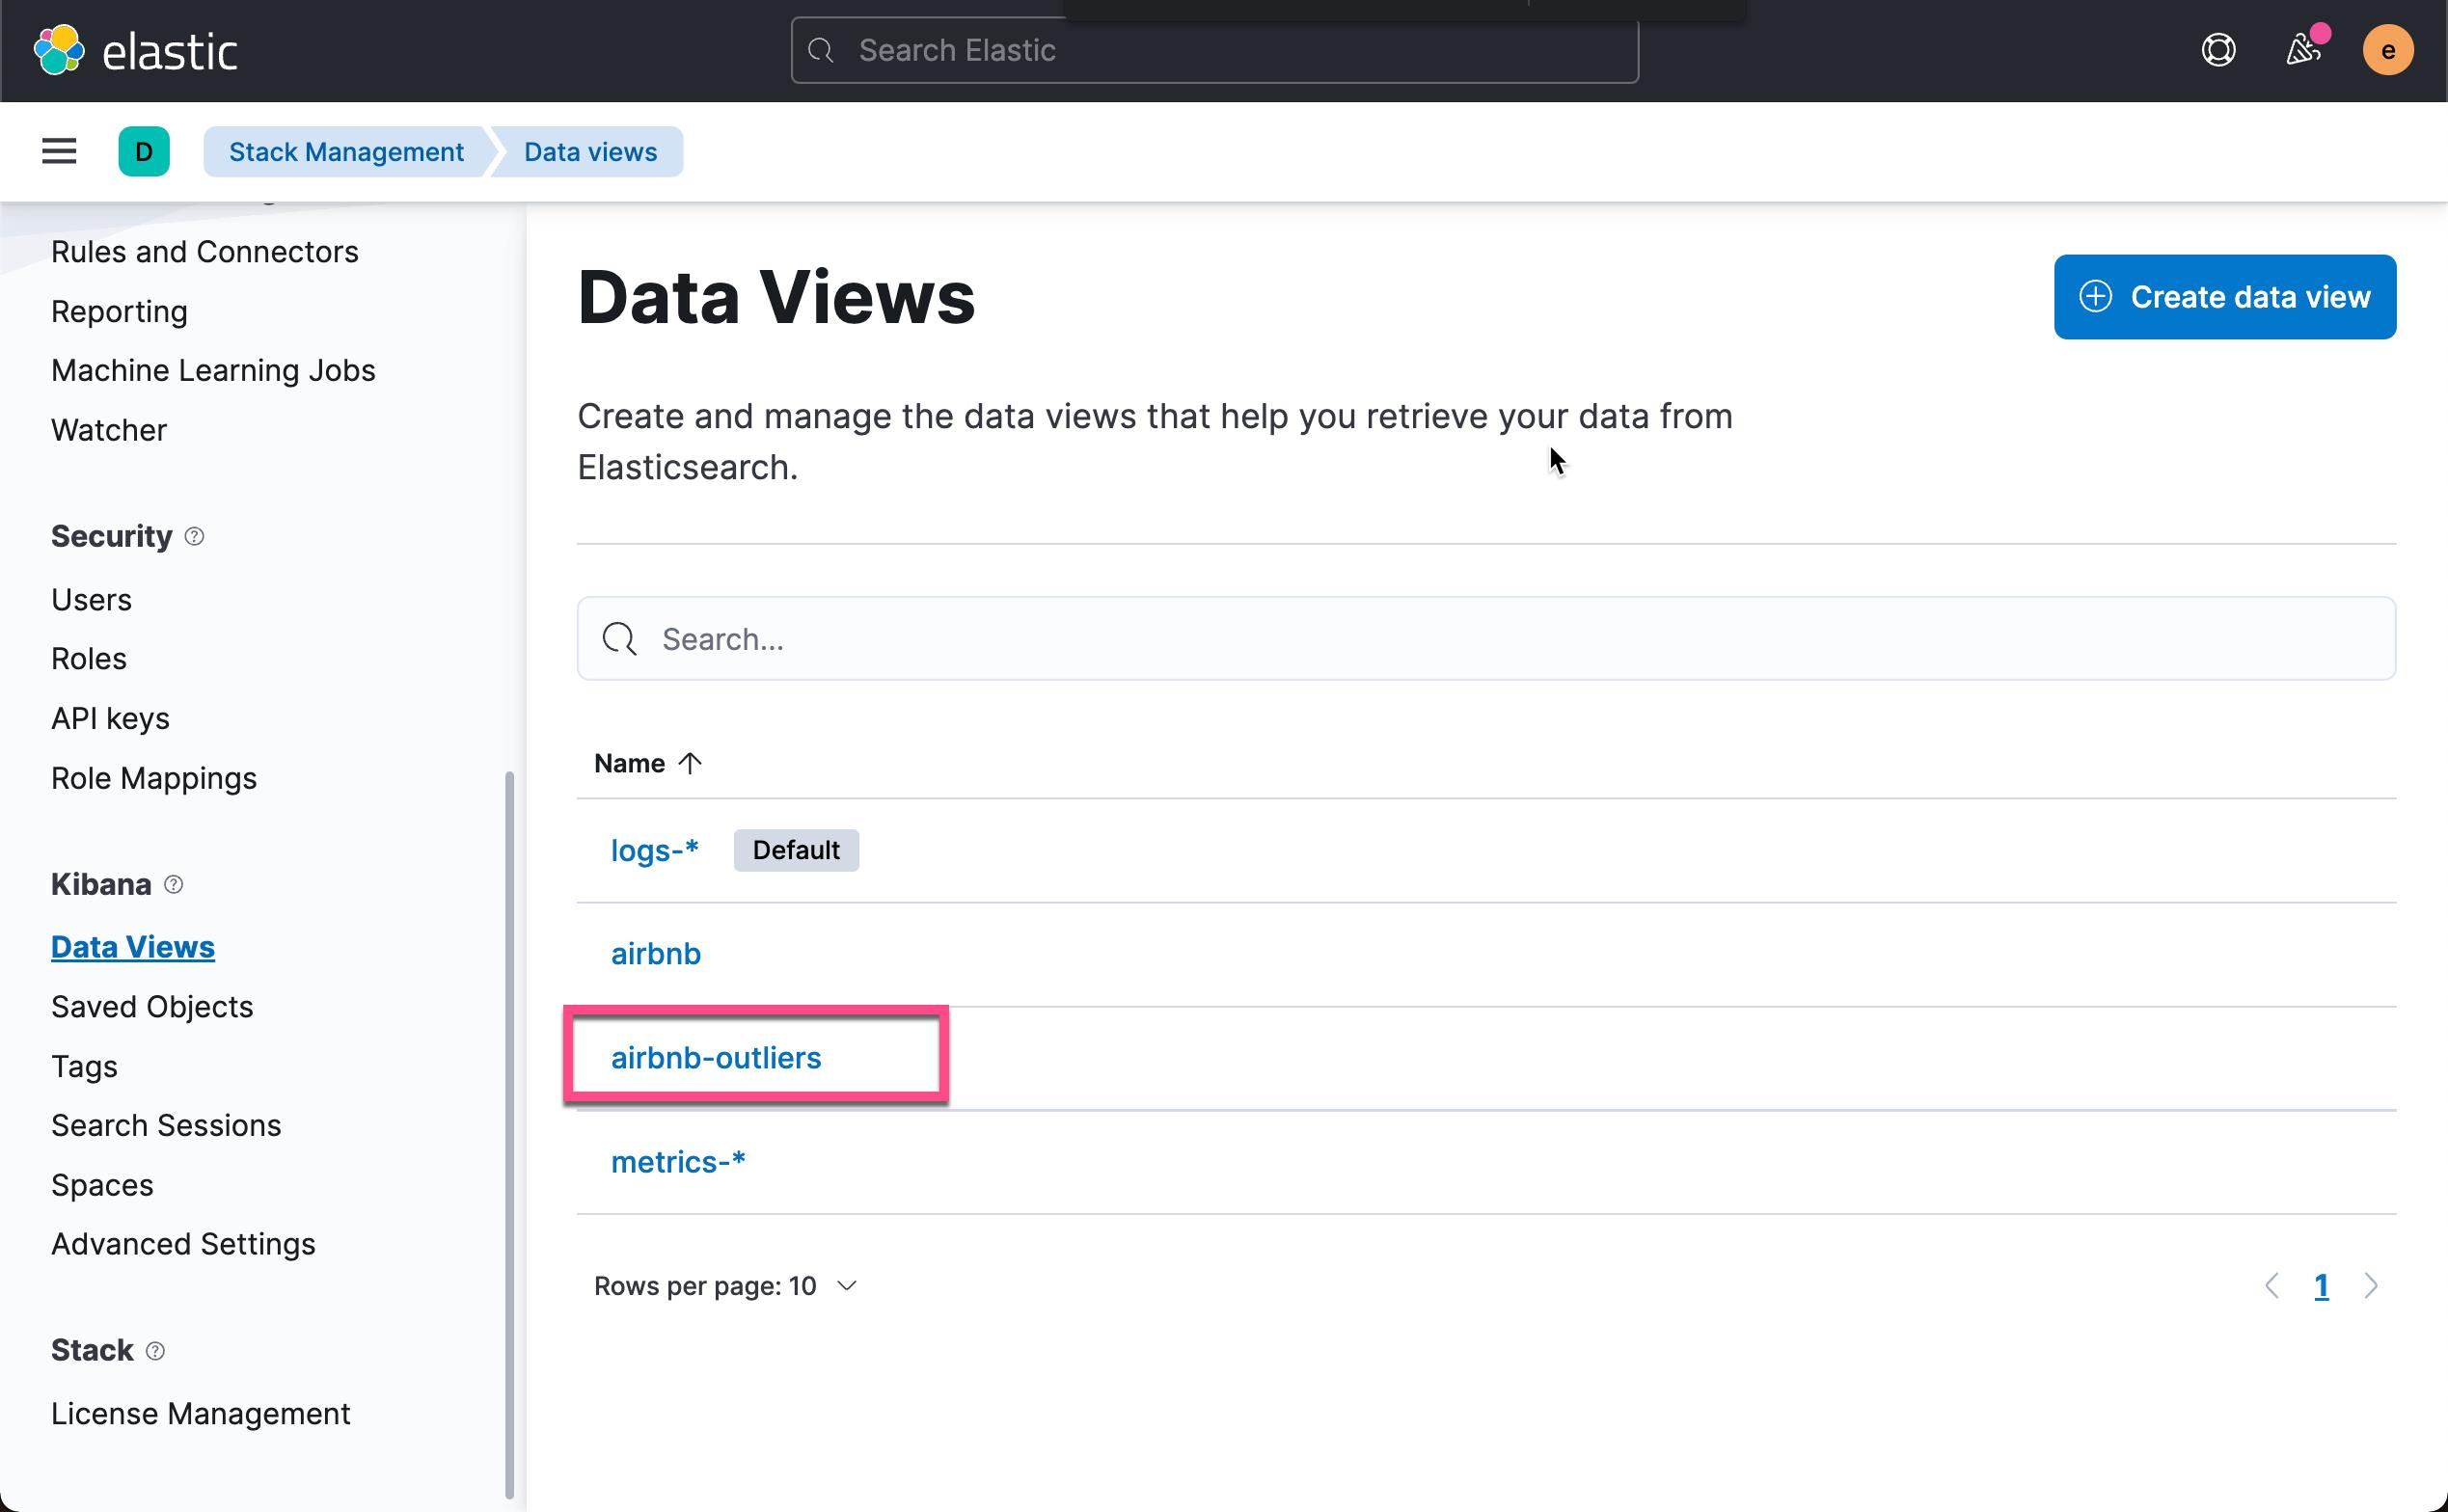
另外,在我们上面的表格中,我们发现异常值是在一定的范围的。它的值是在 0.0 - 1.0 之间。我们想使用不同的颜色来代表异常的范围。我们再次回到 data view 的界面中:


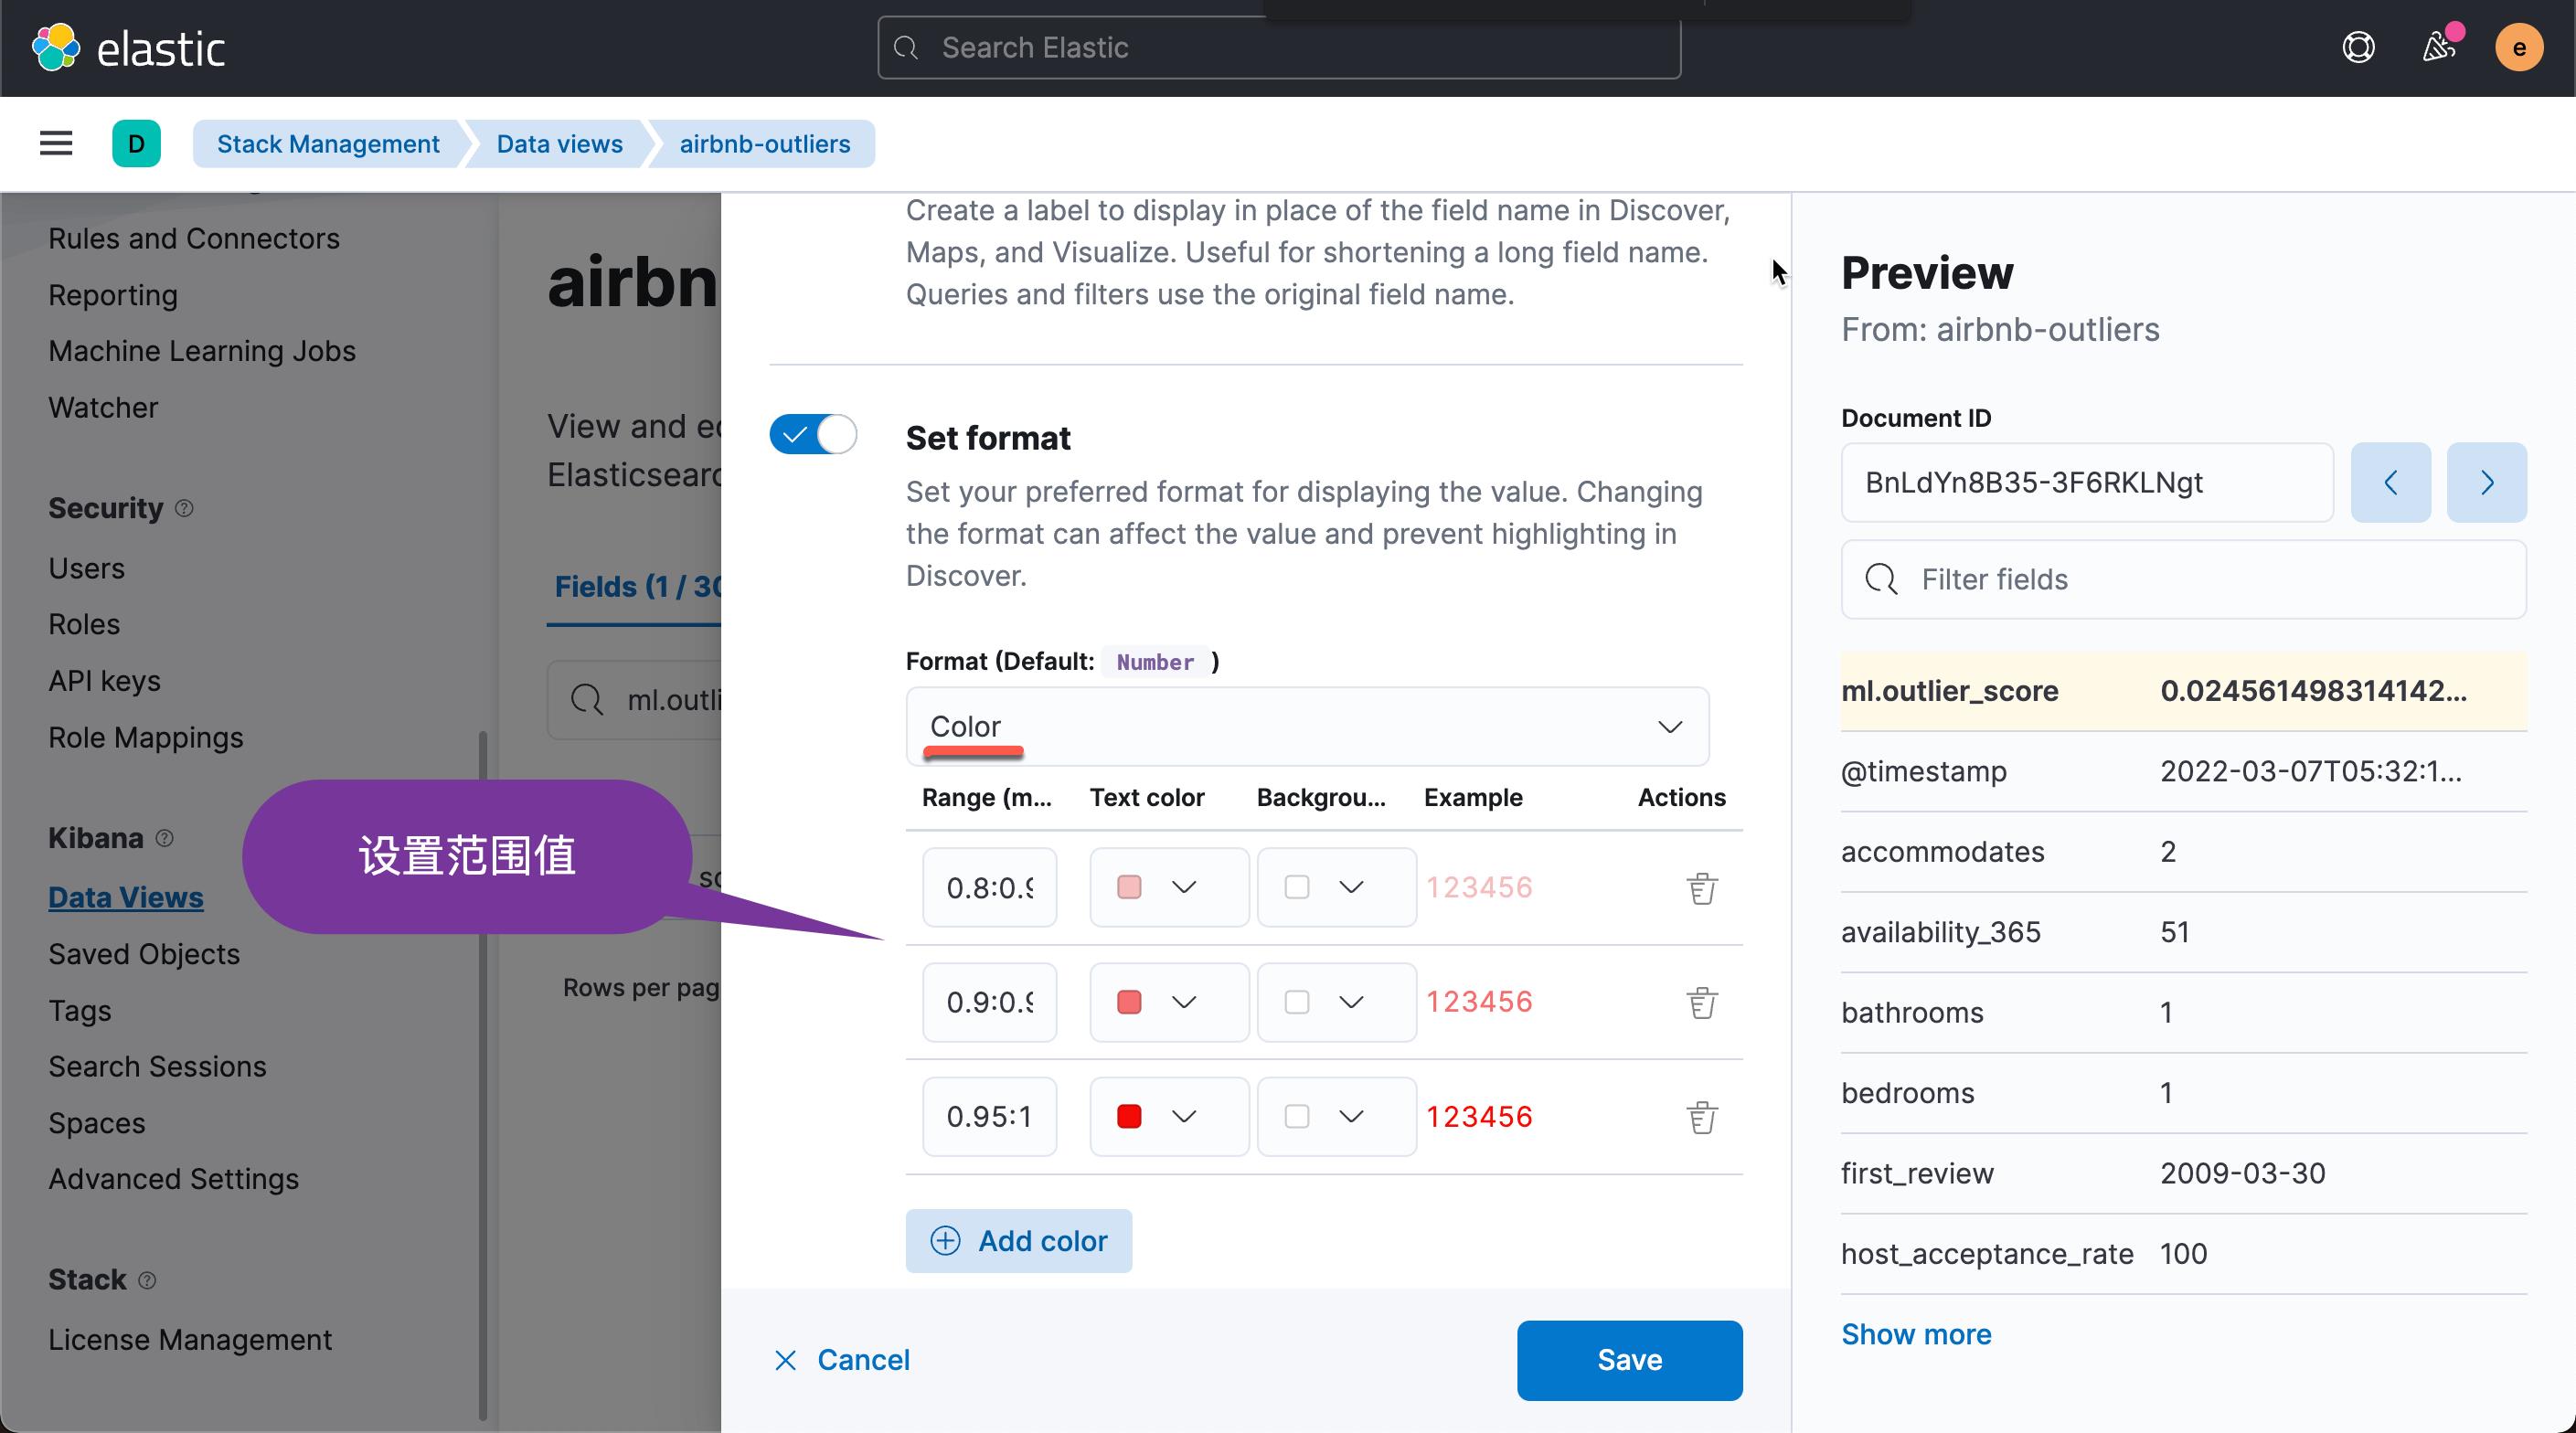
点击上面的 Save 按钮。我们再次回到之前的 Dasboard:
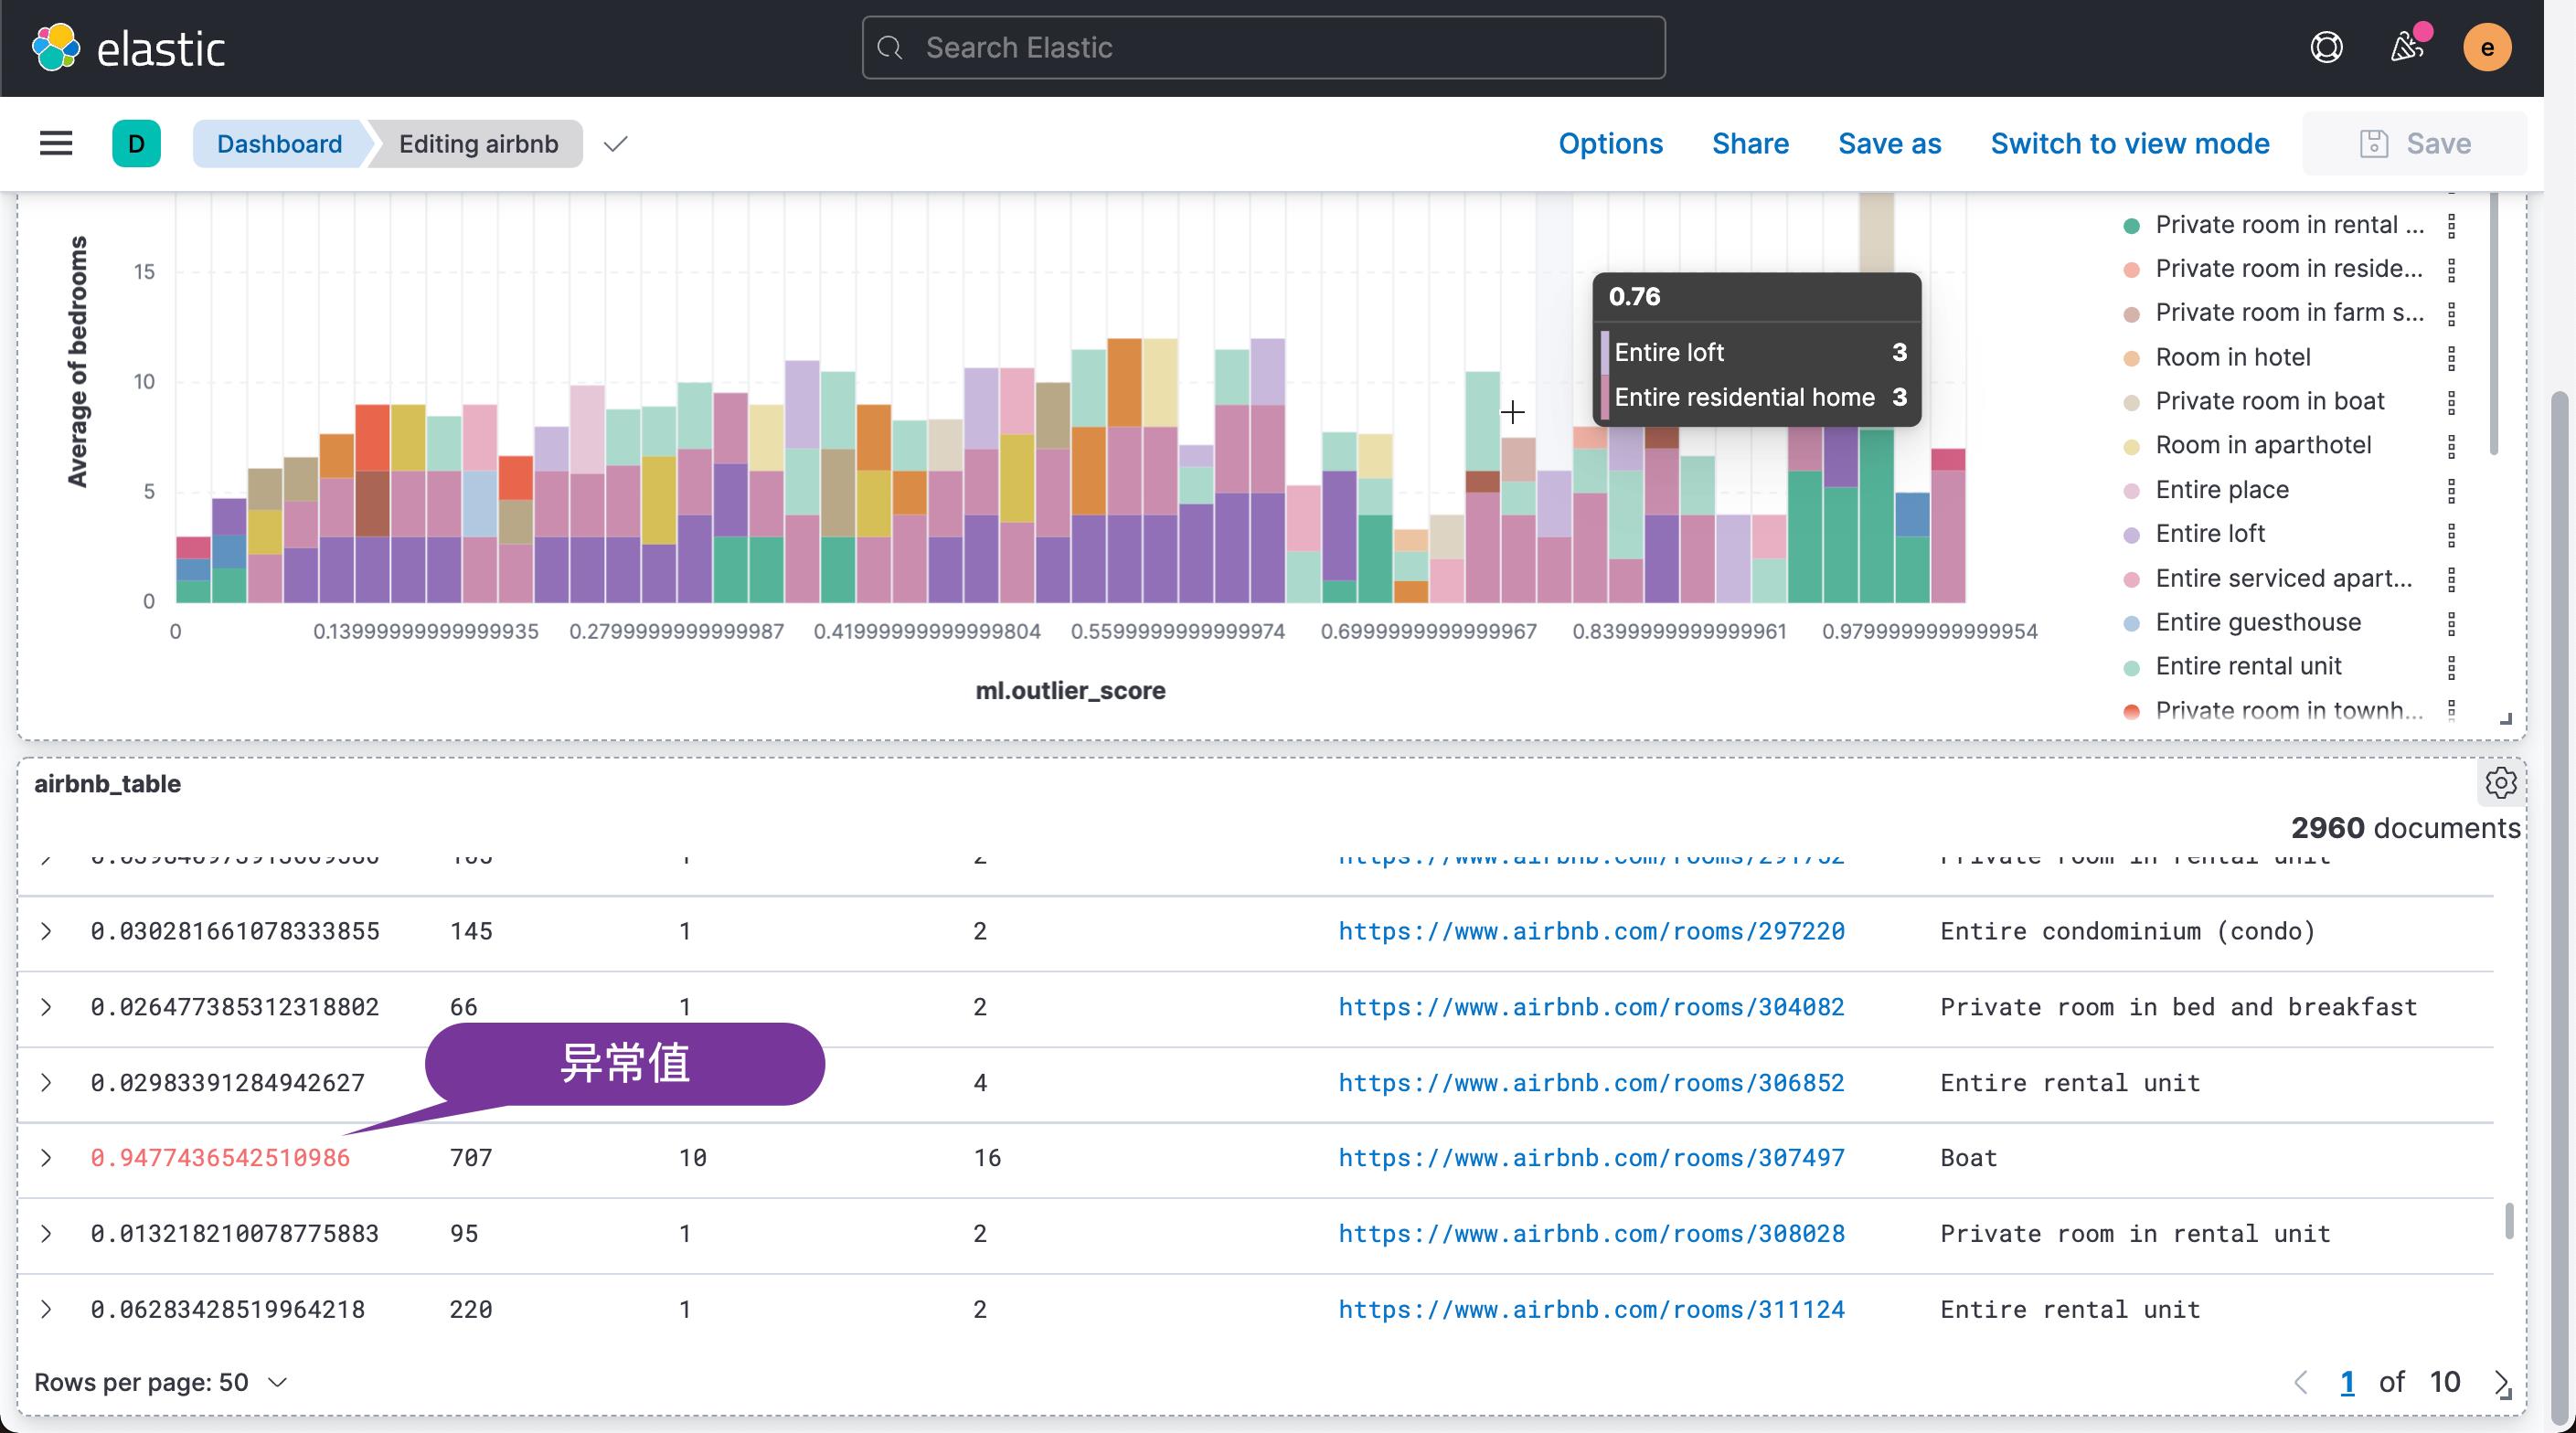
我们滚动一下之前的 table,那么我们可能会发现其中的一个或一些值是落在我们的异常值范围内的。这应该引起你的警觉。
可能大家对地图很感兴趣。我们想知道异常值出现在哪些地方。这可以给我们一种直观的感觉。
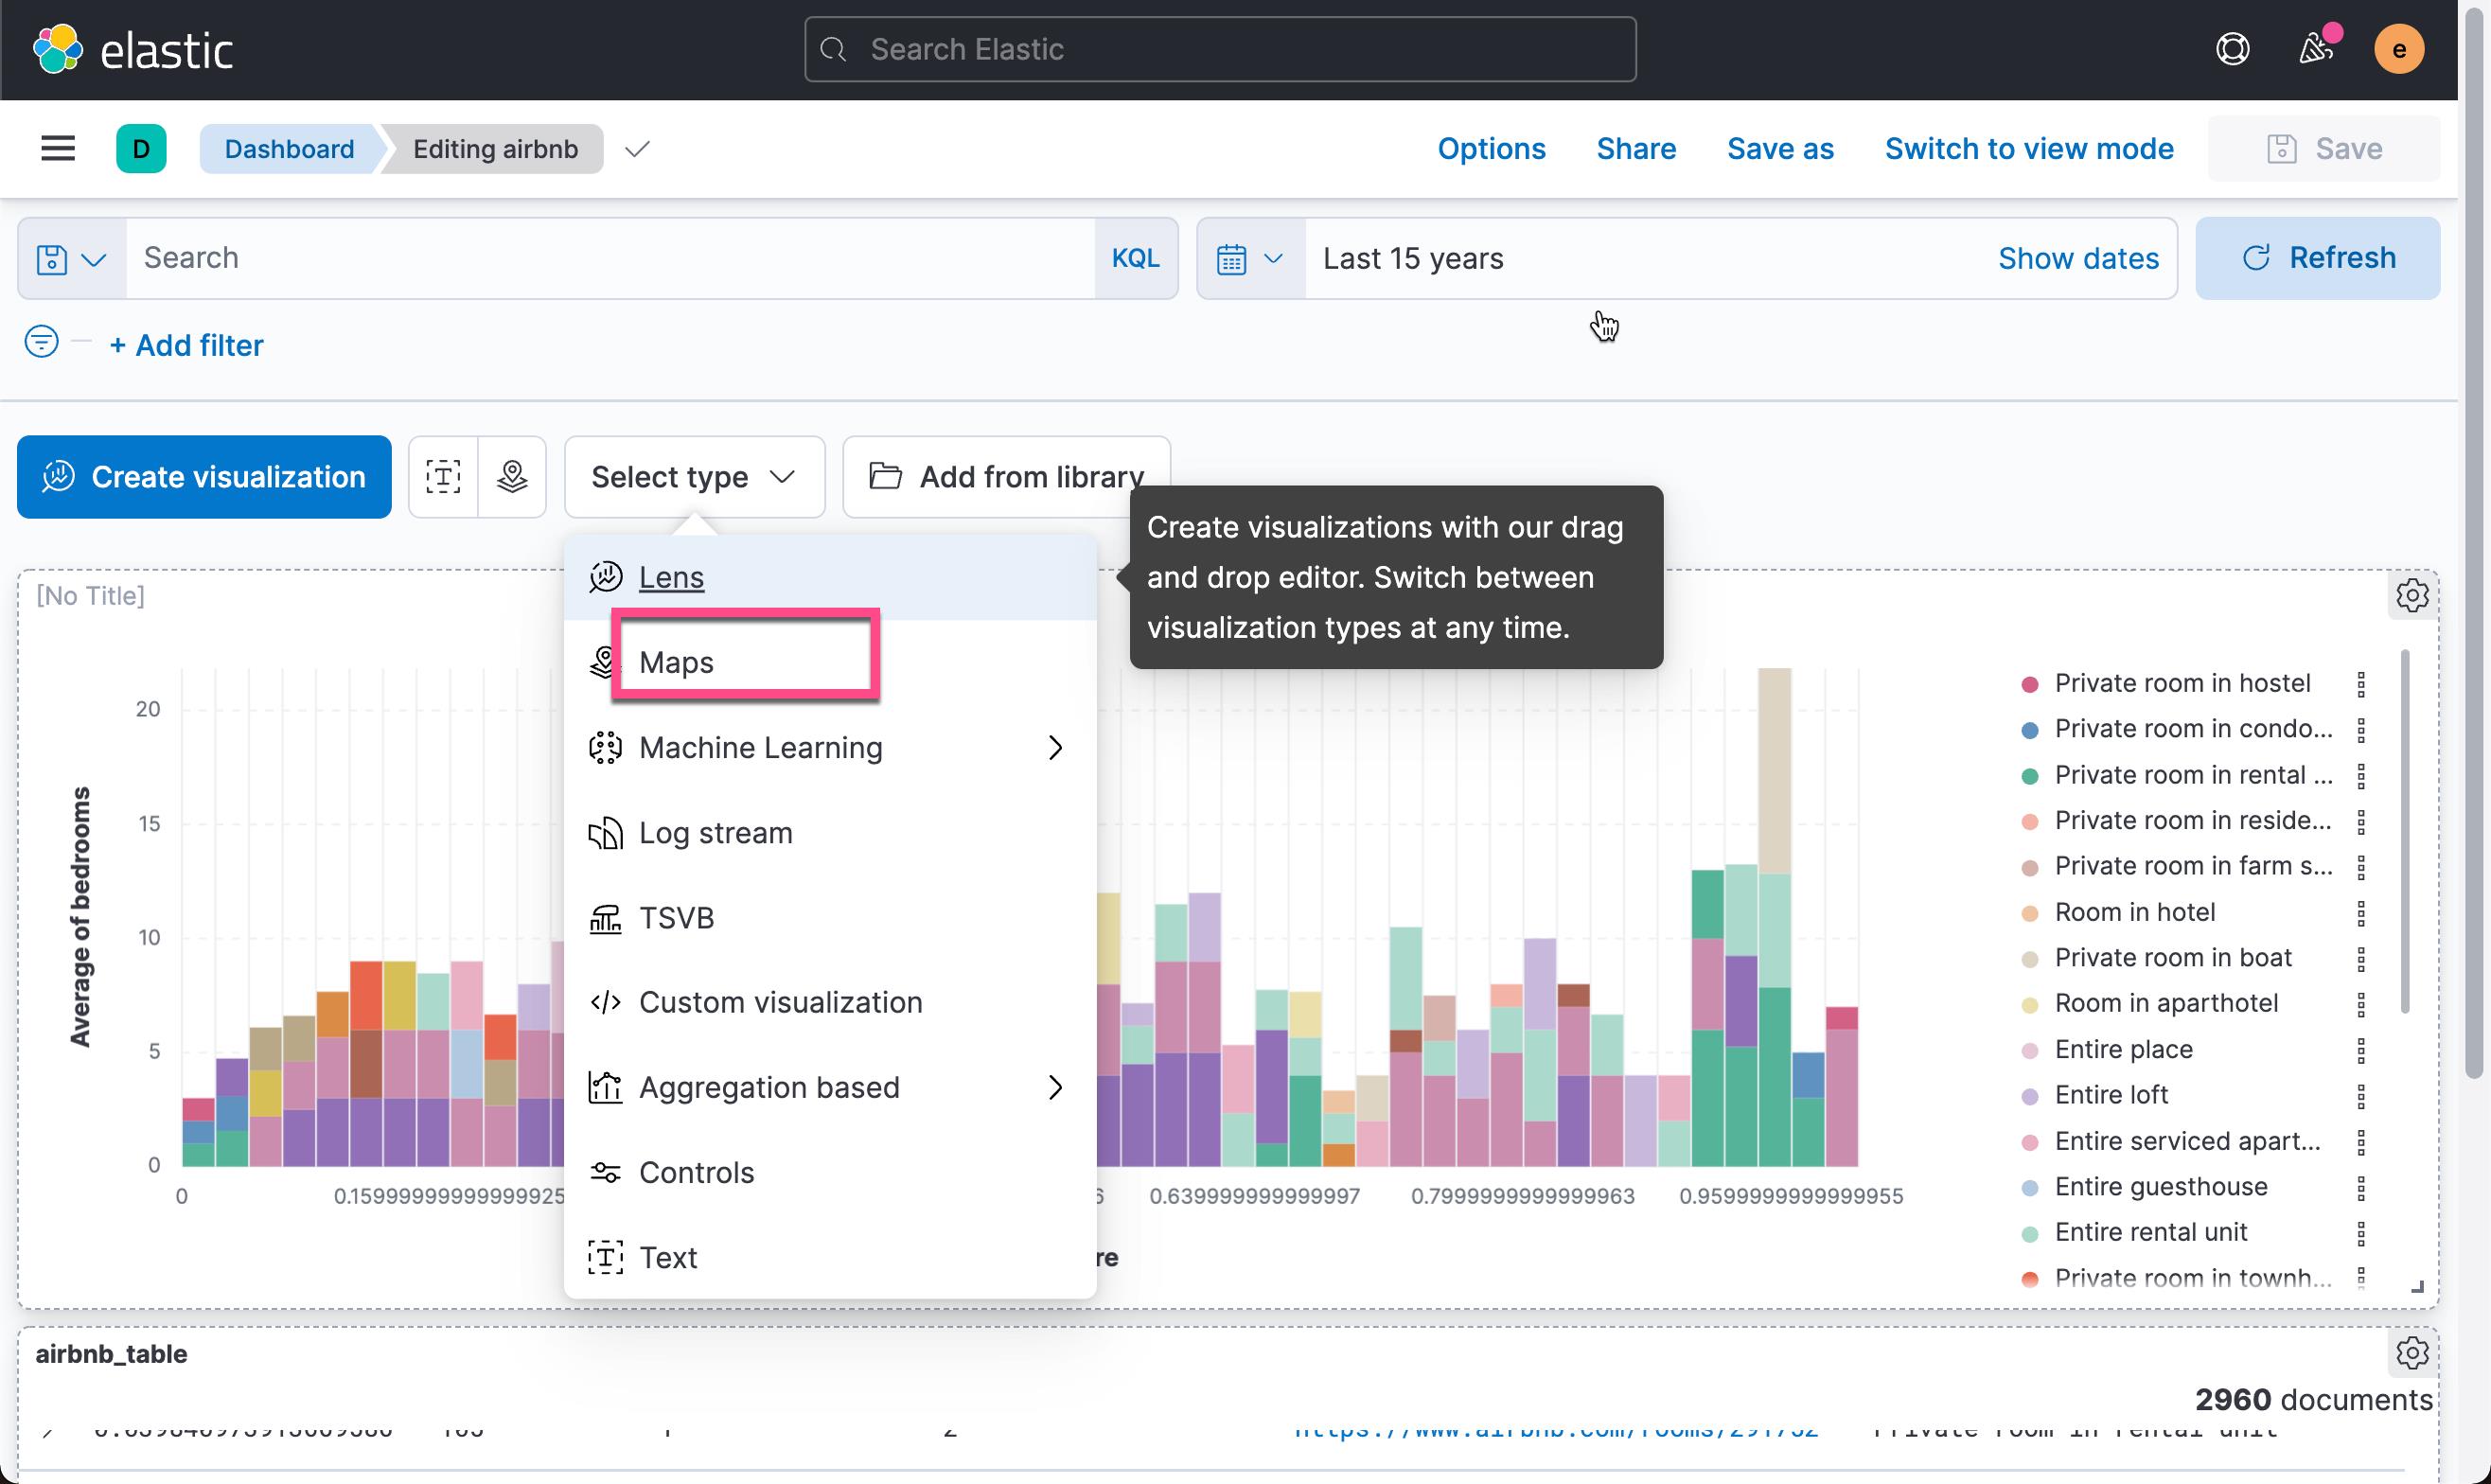
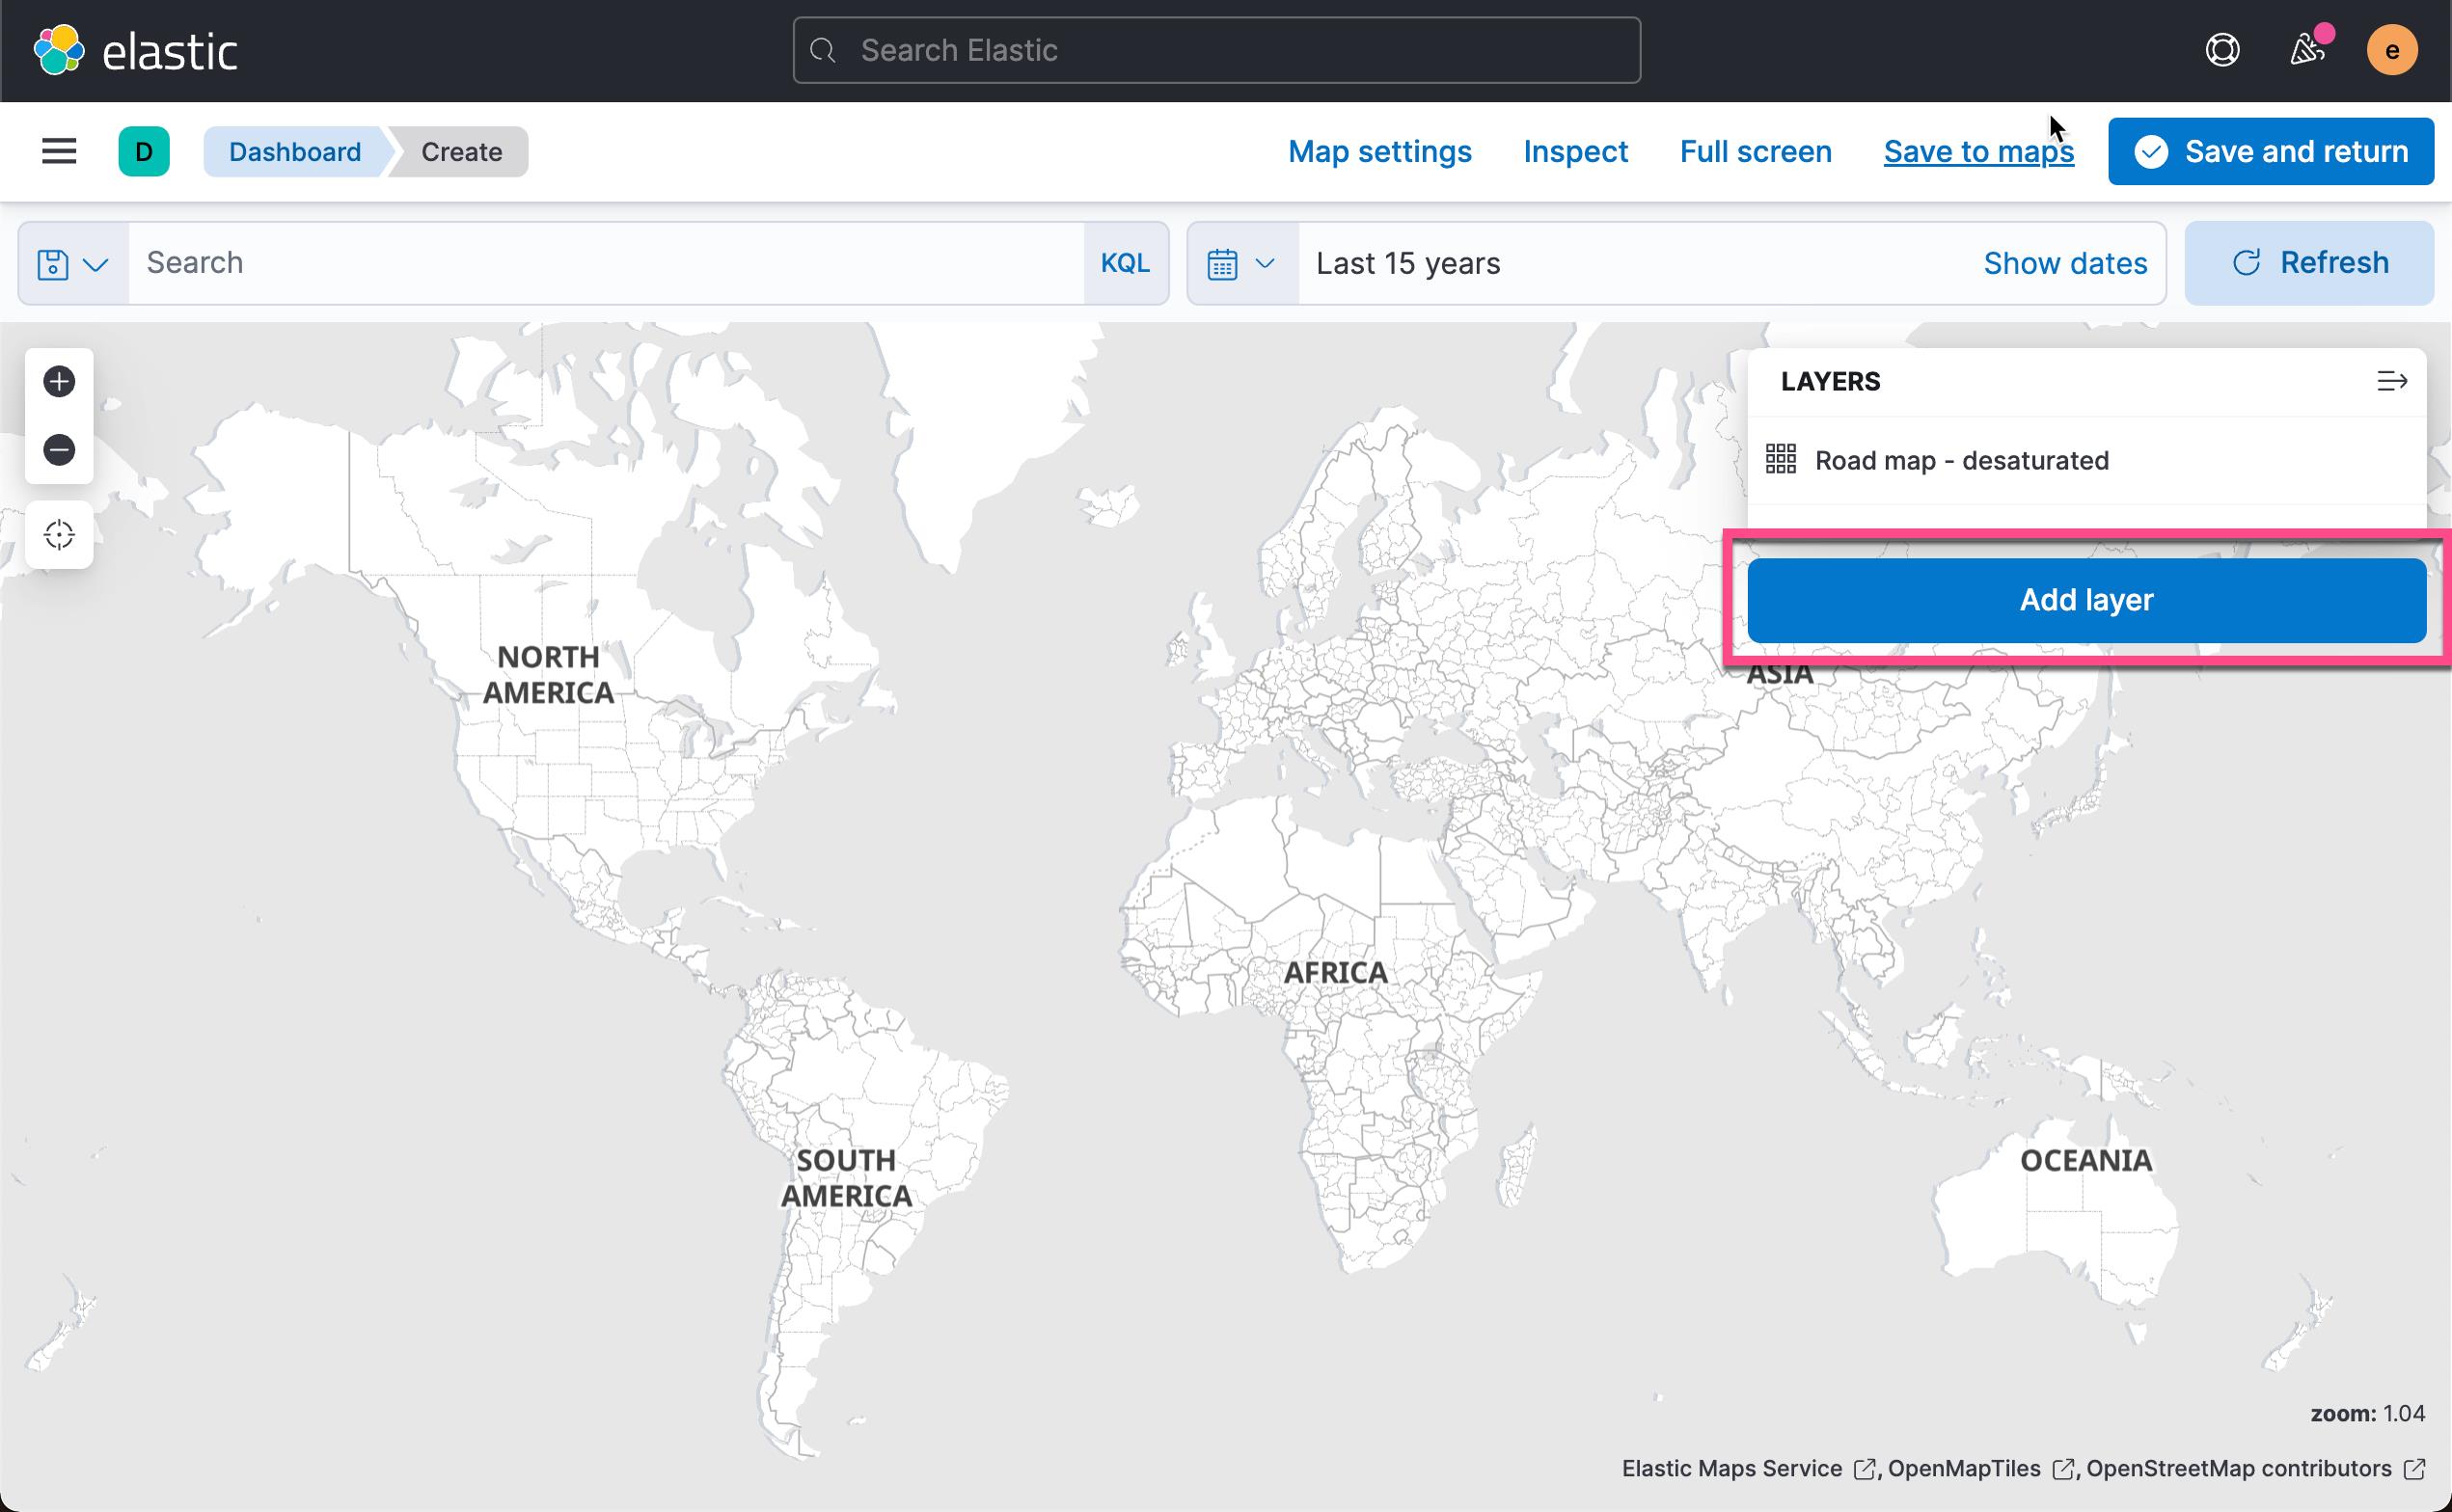
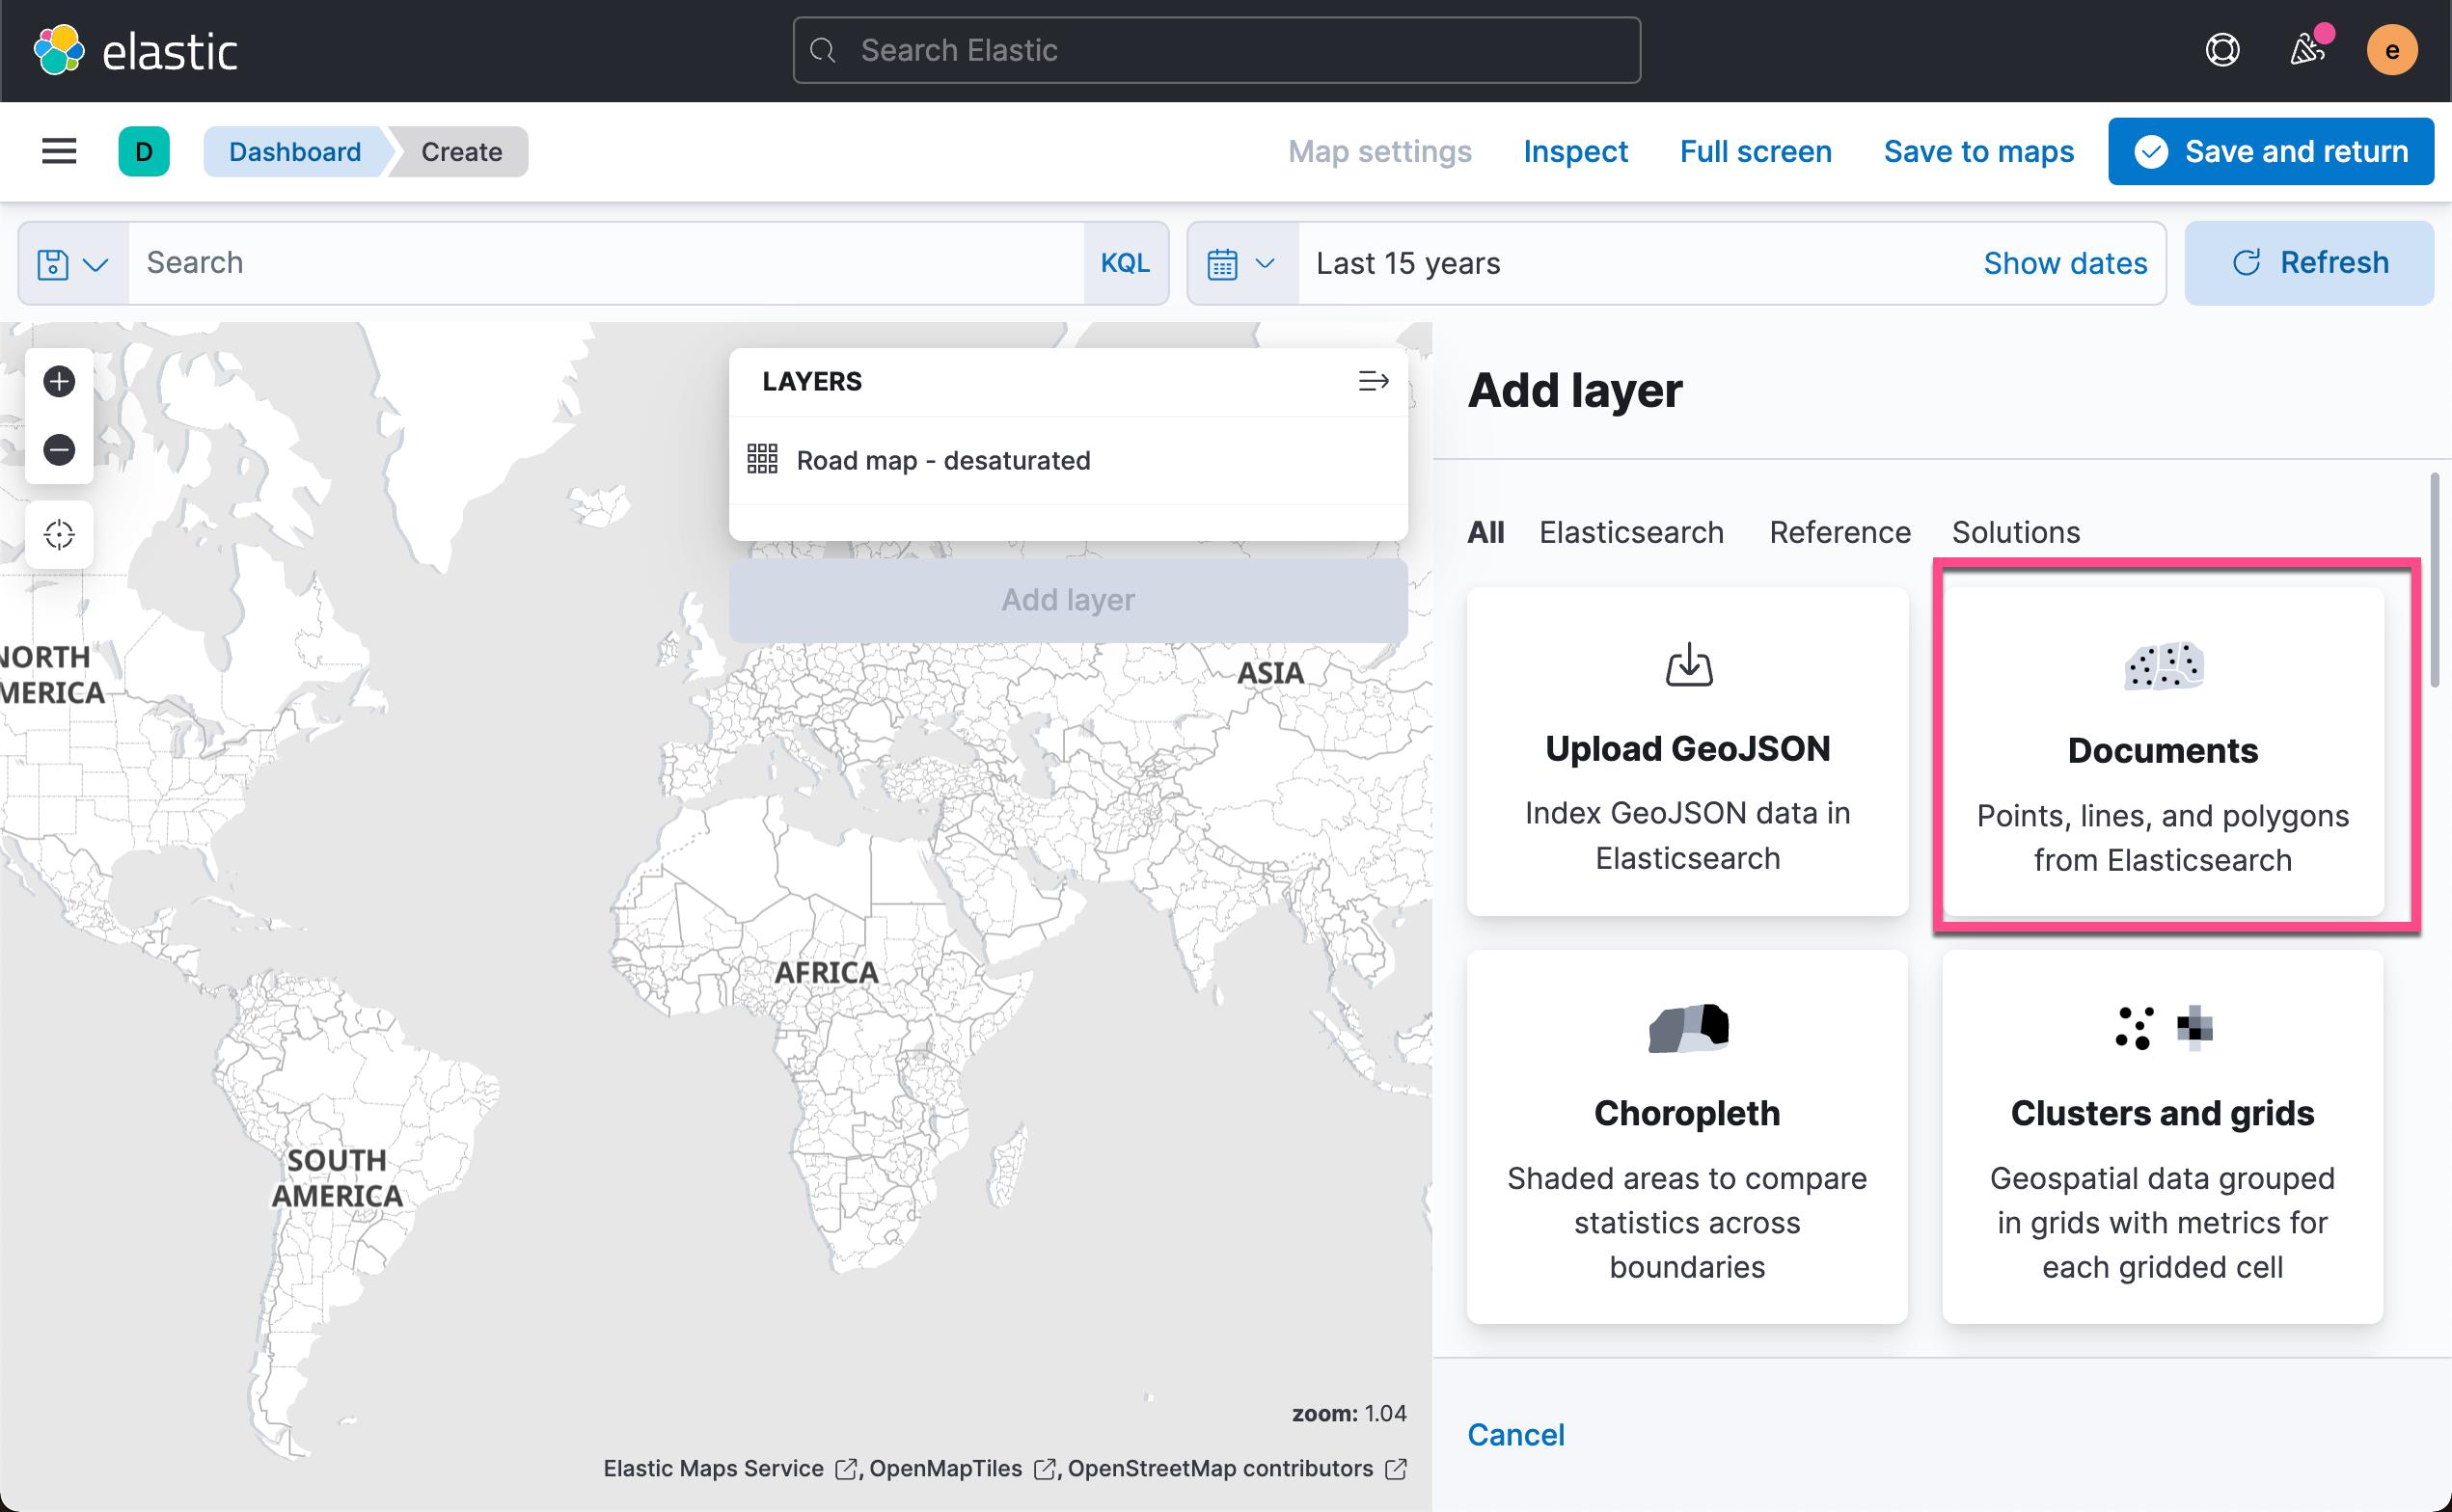
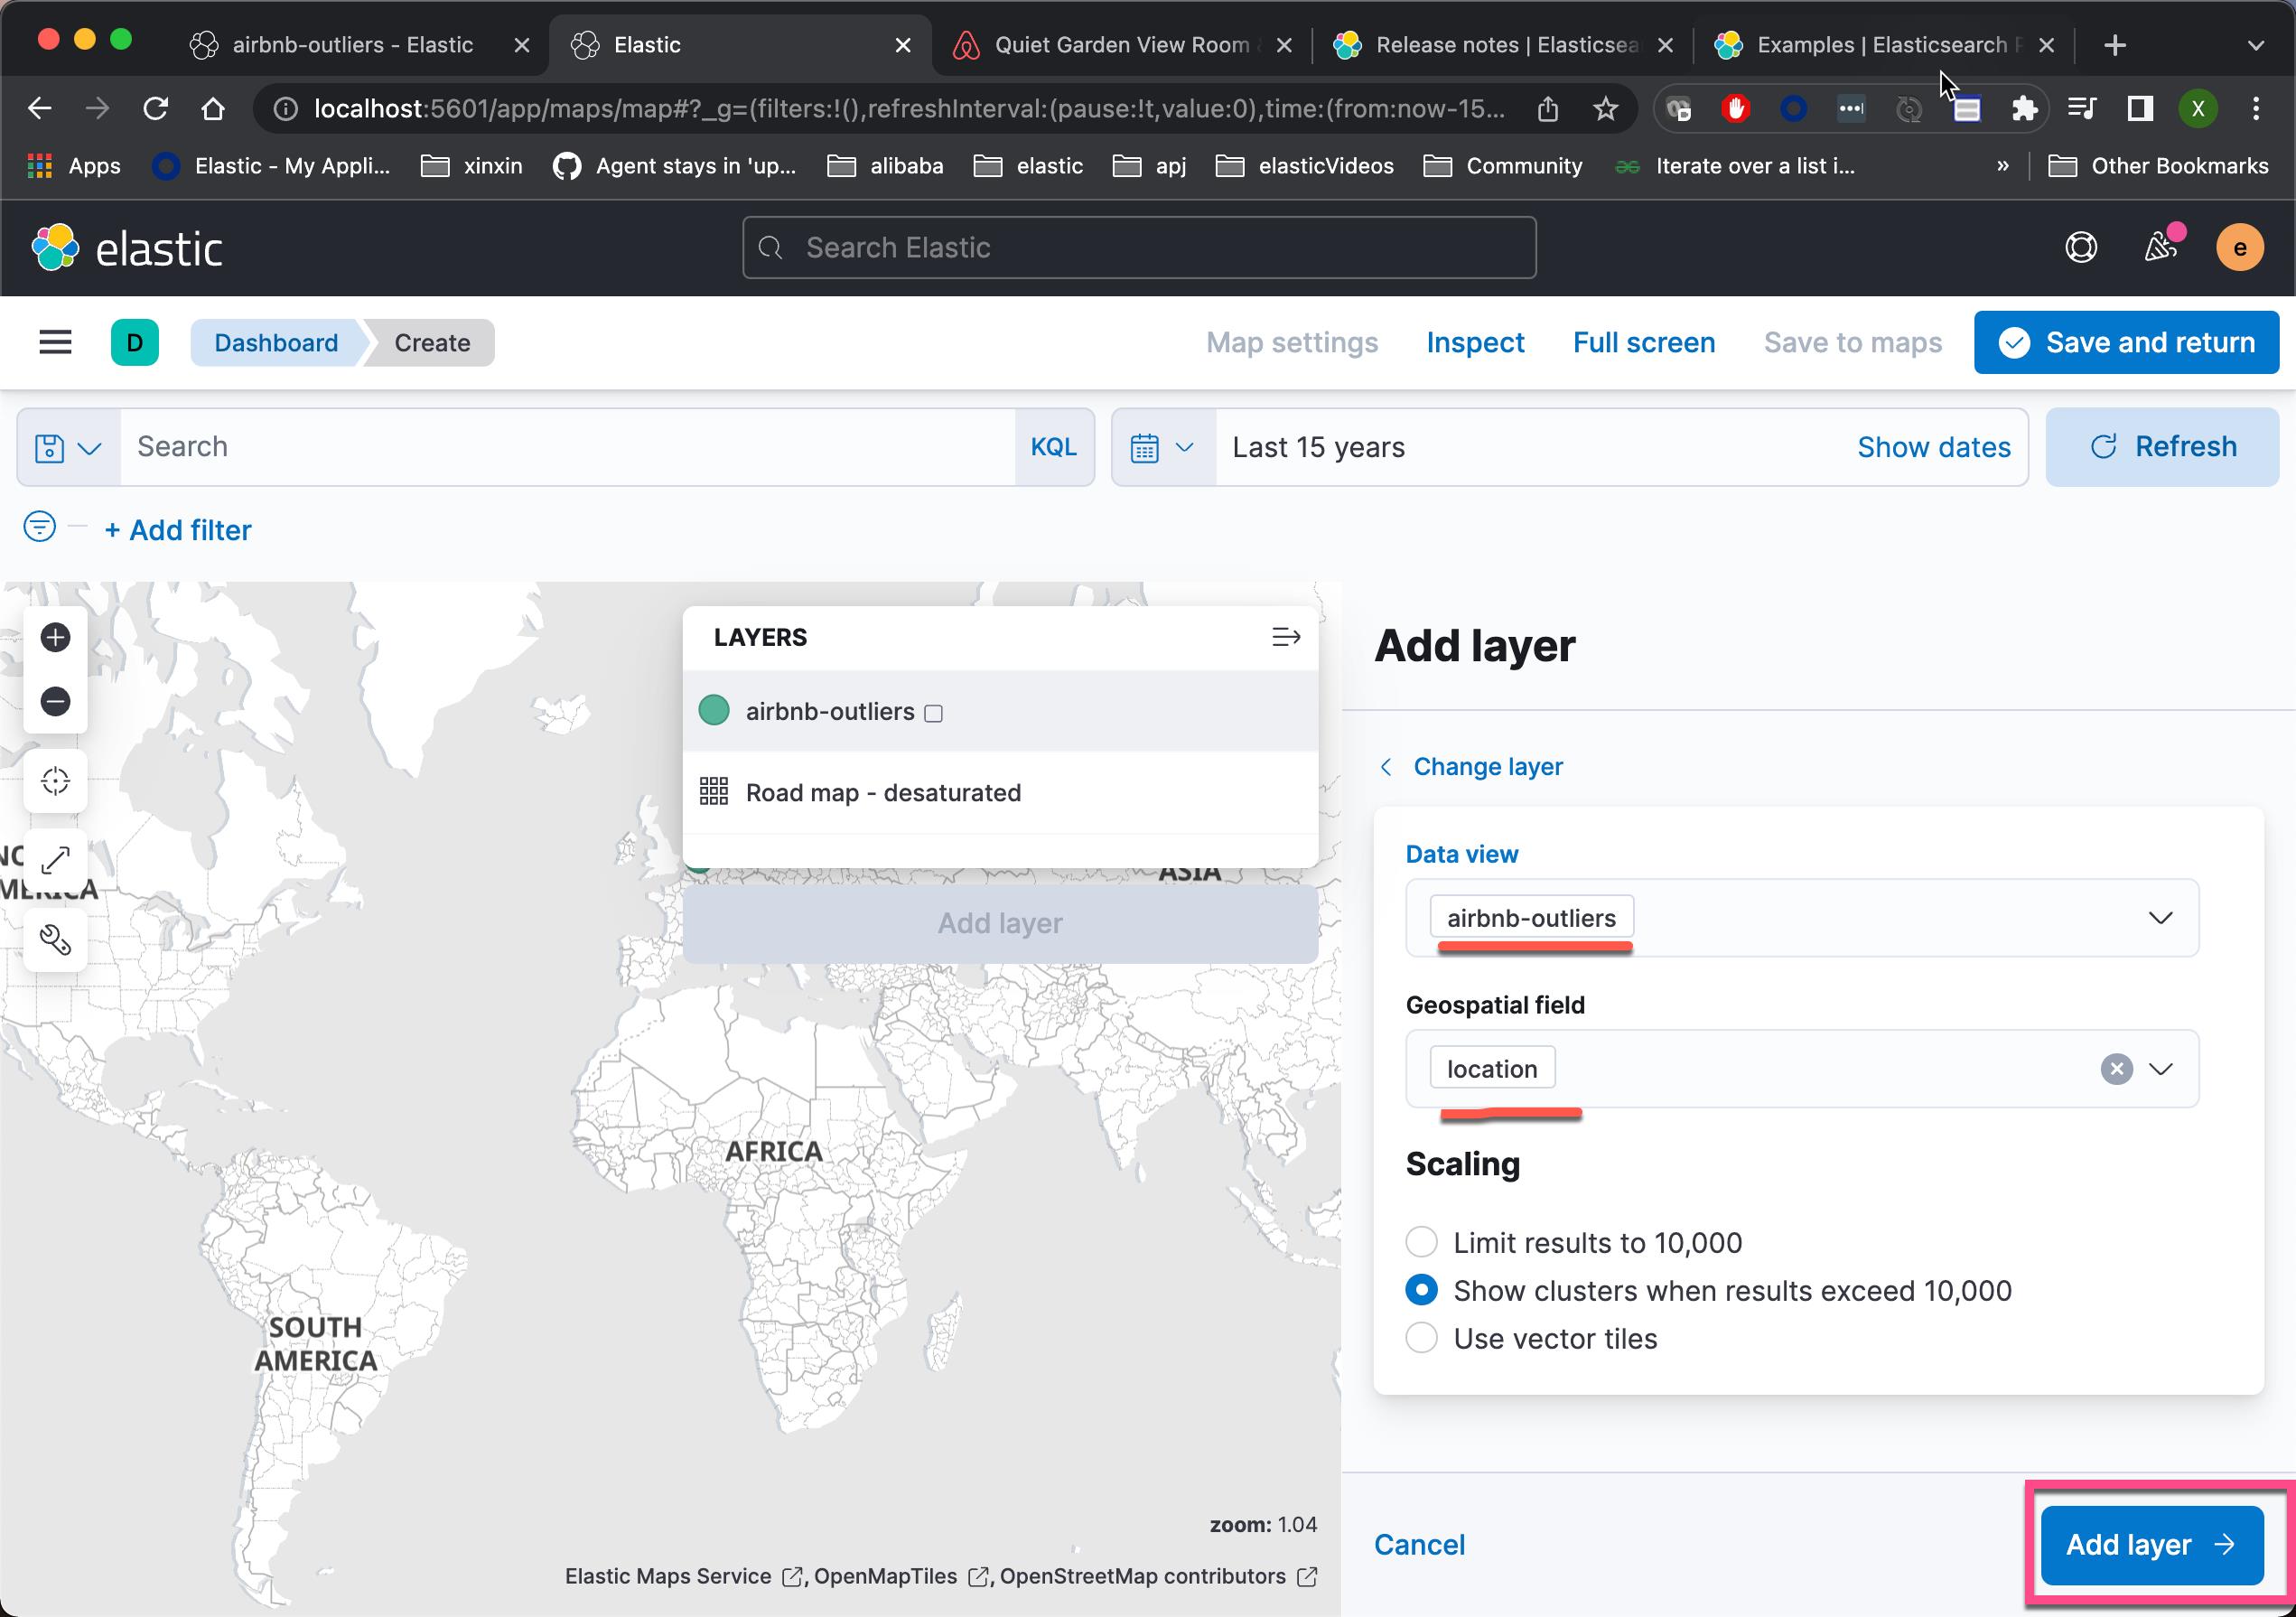
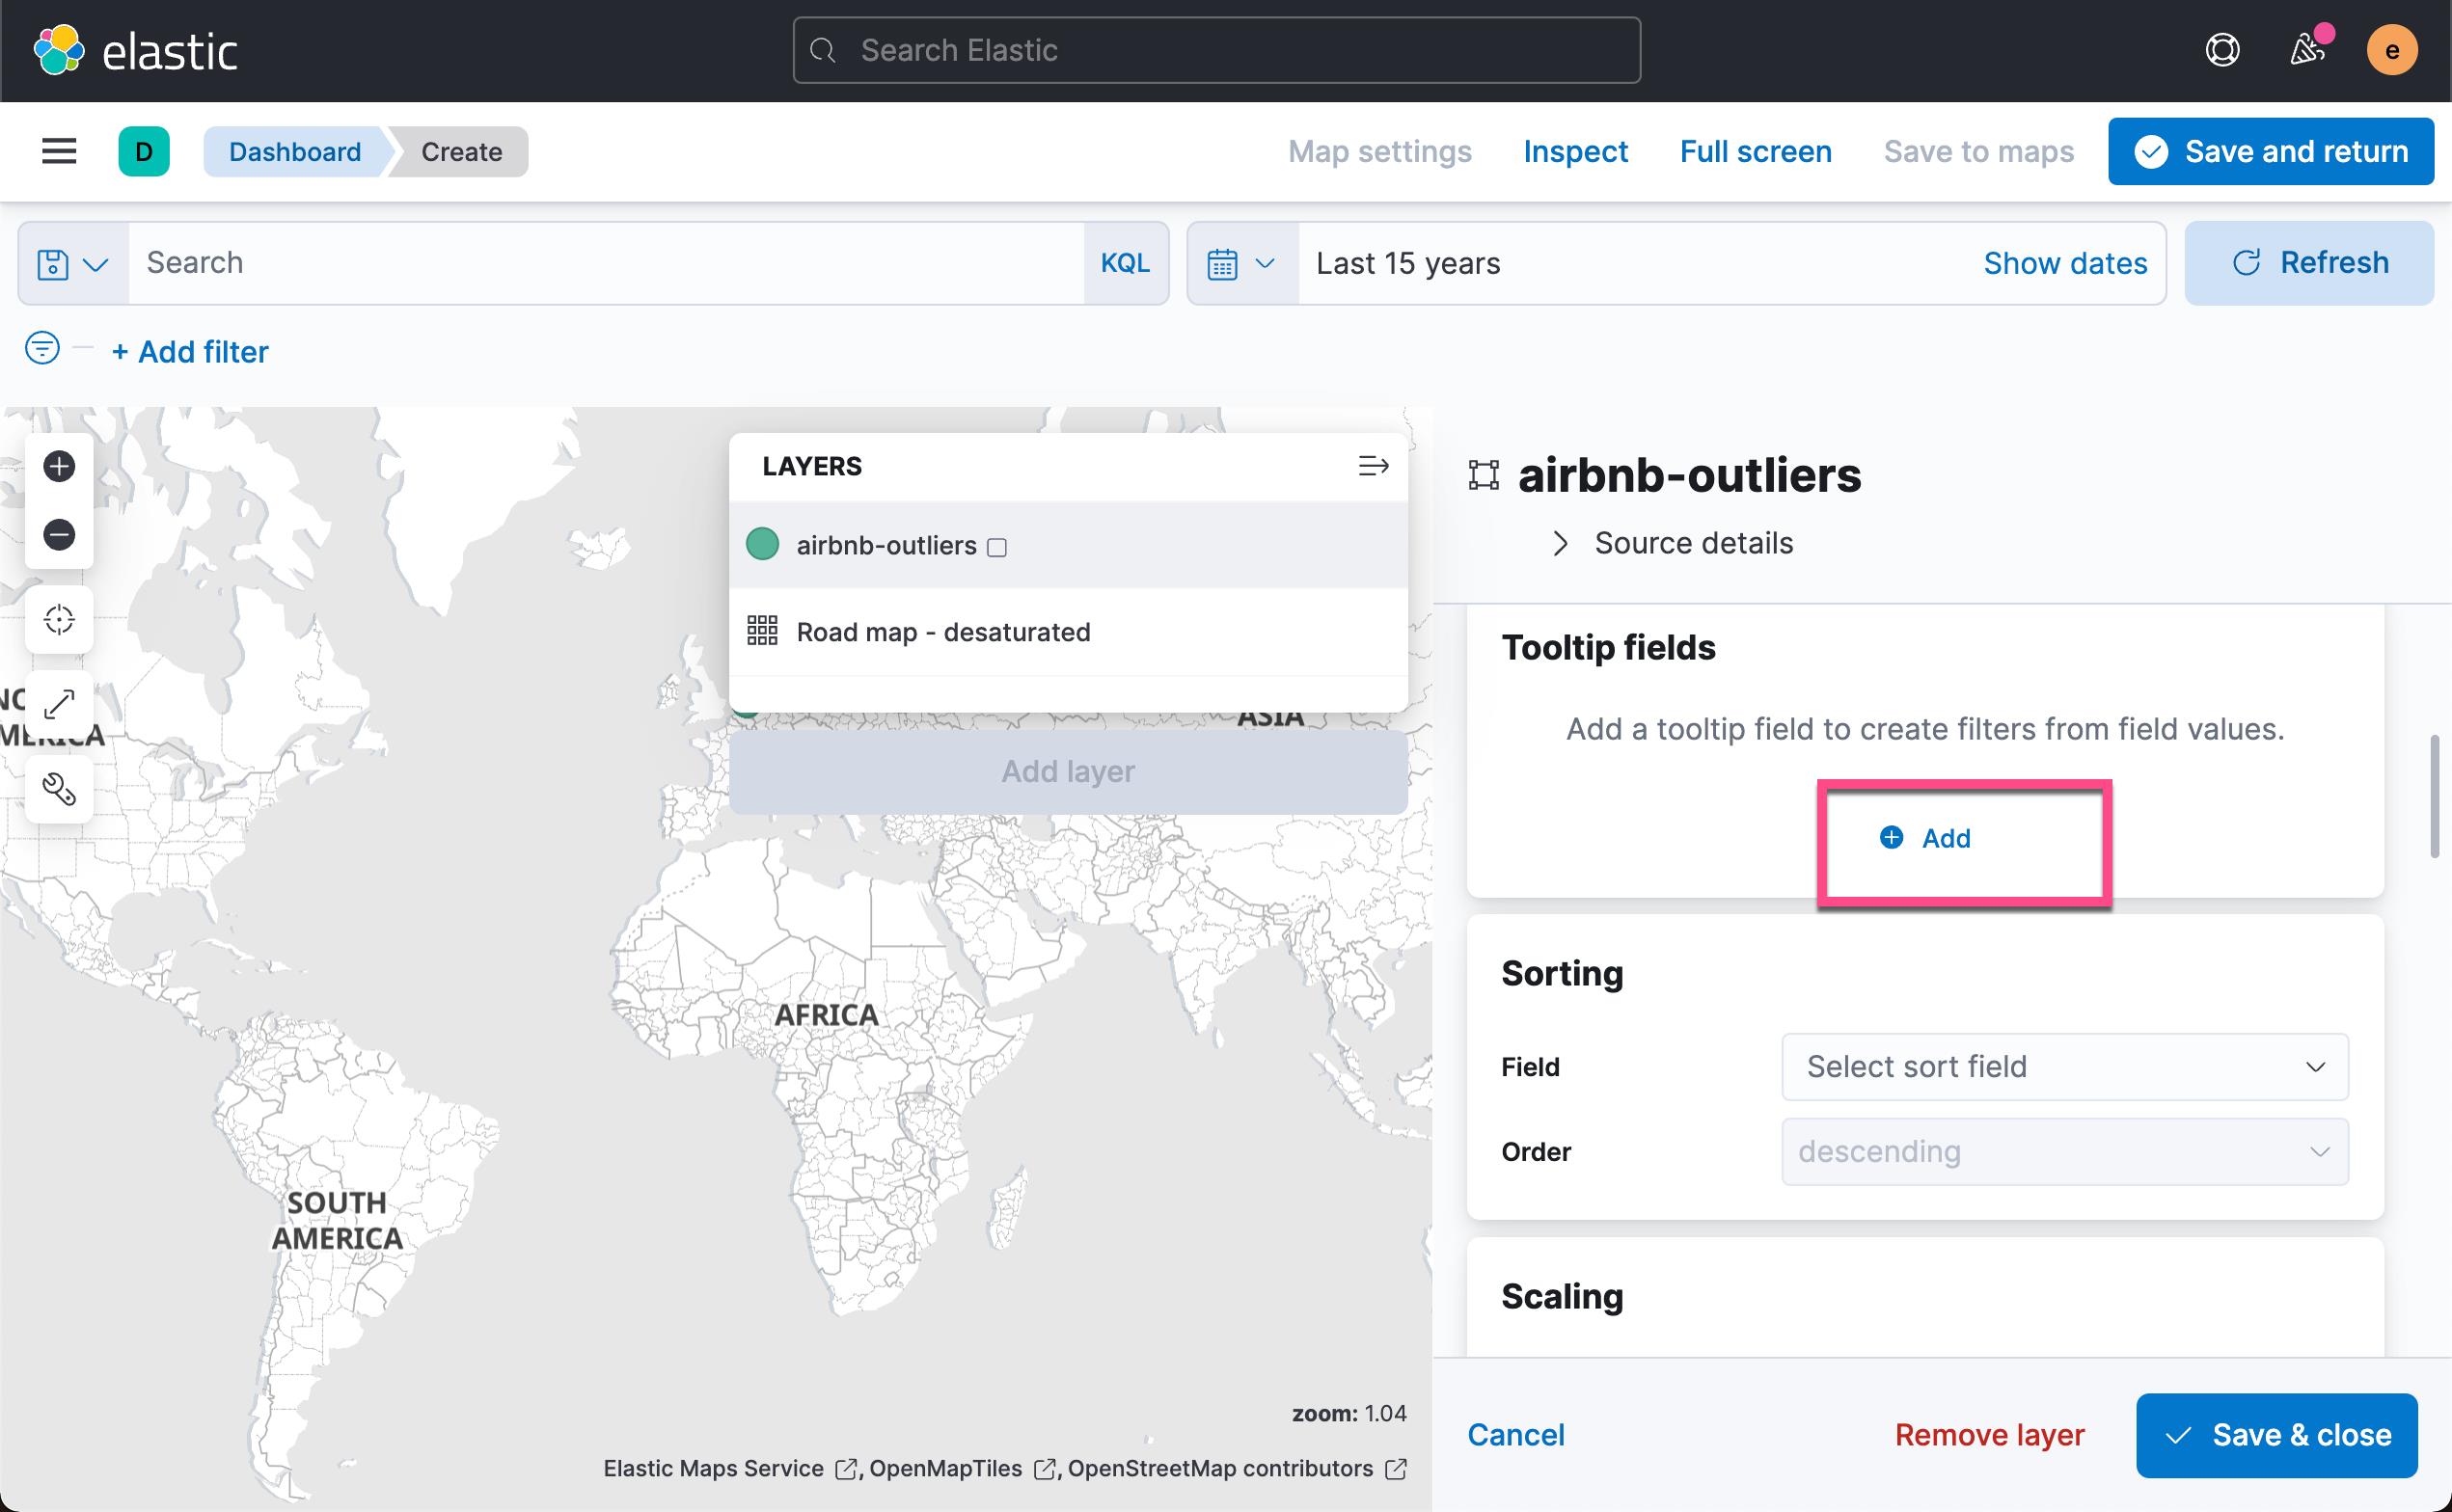
添加我们感兴趣的字段:
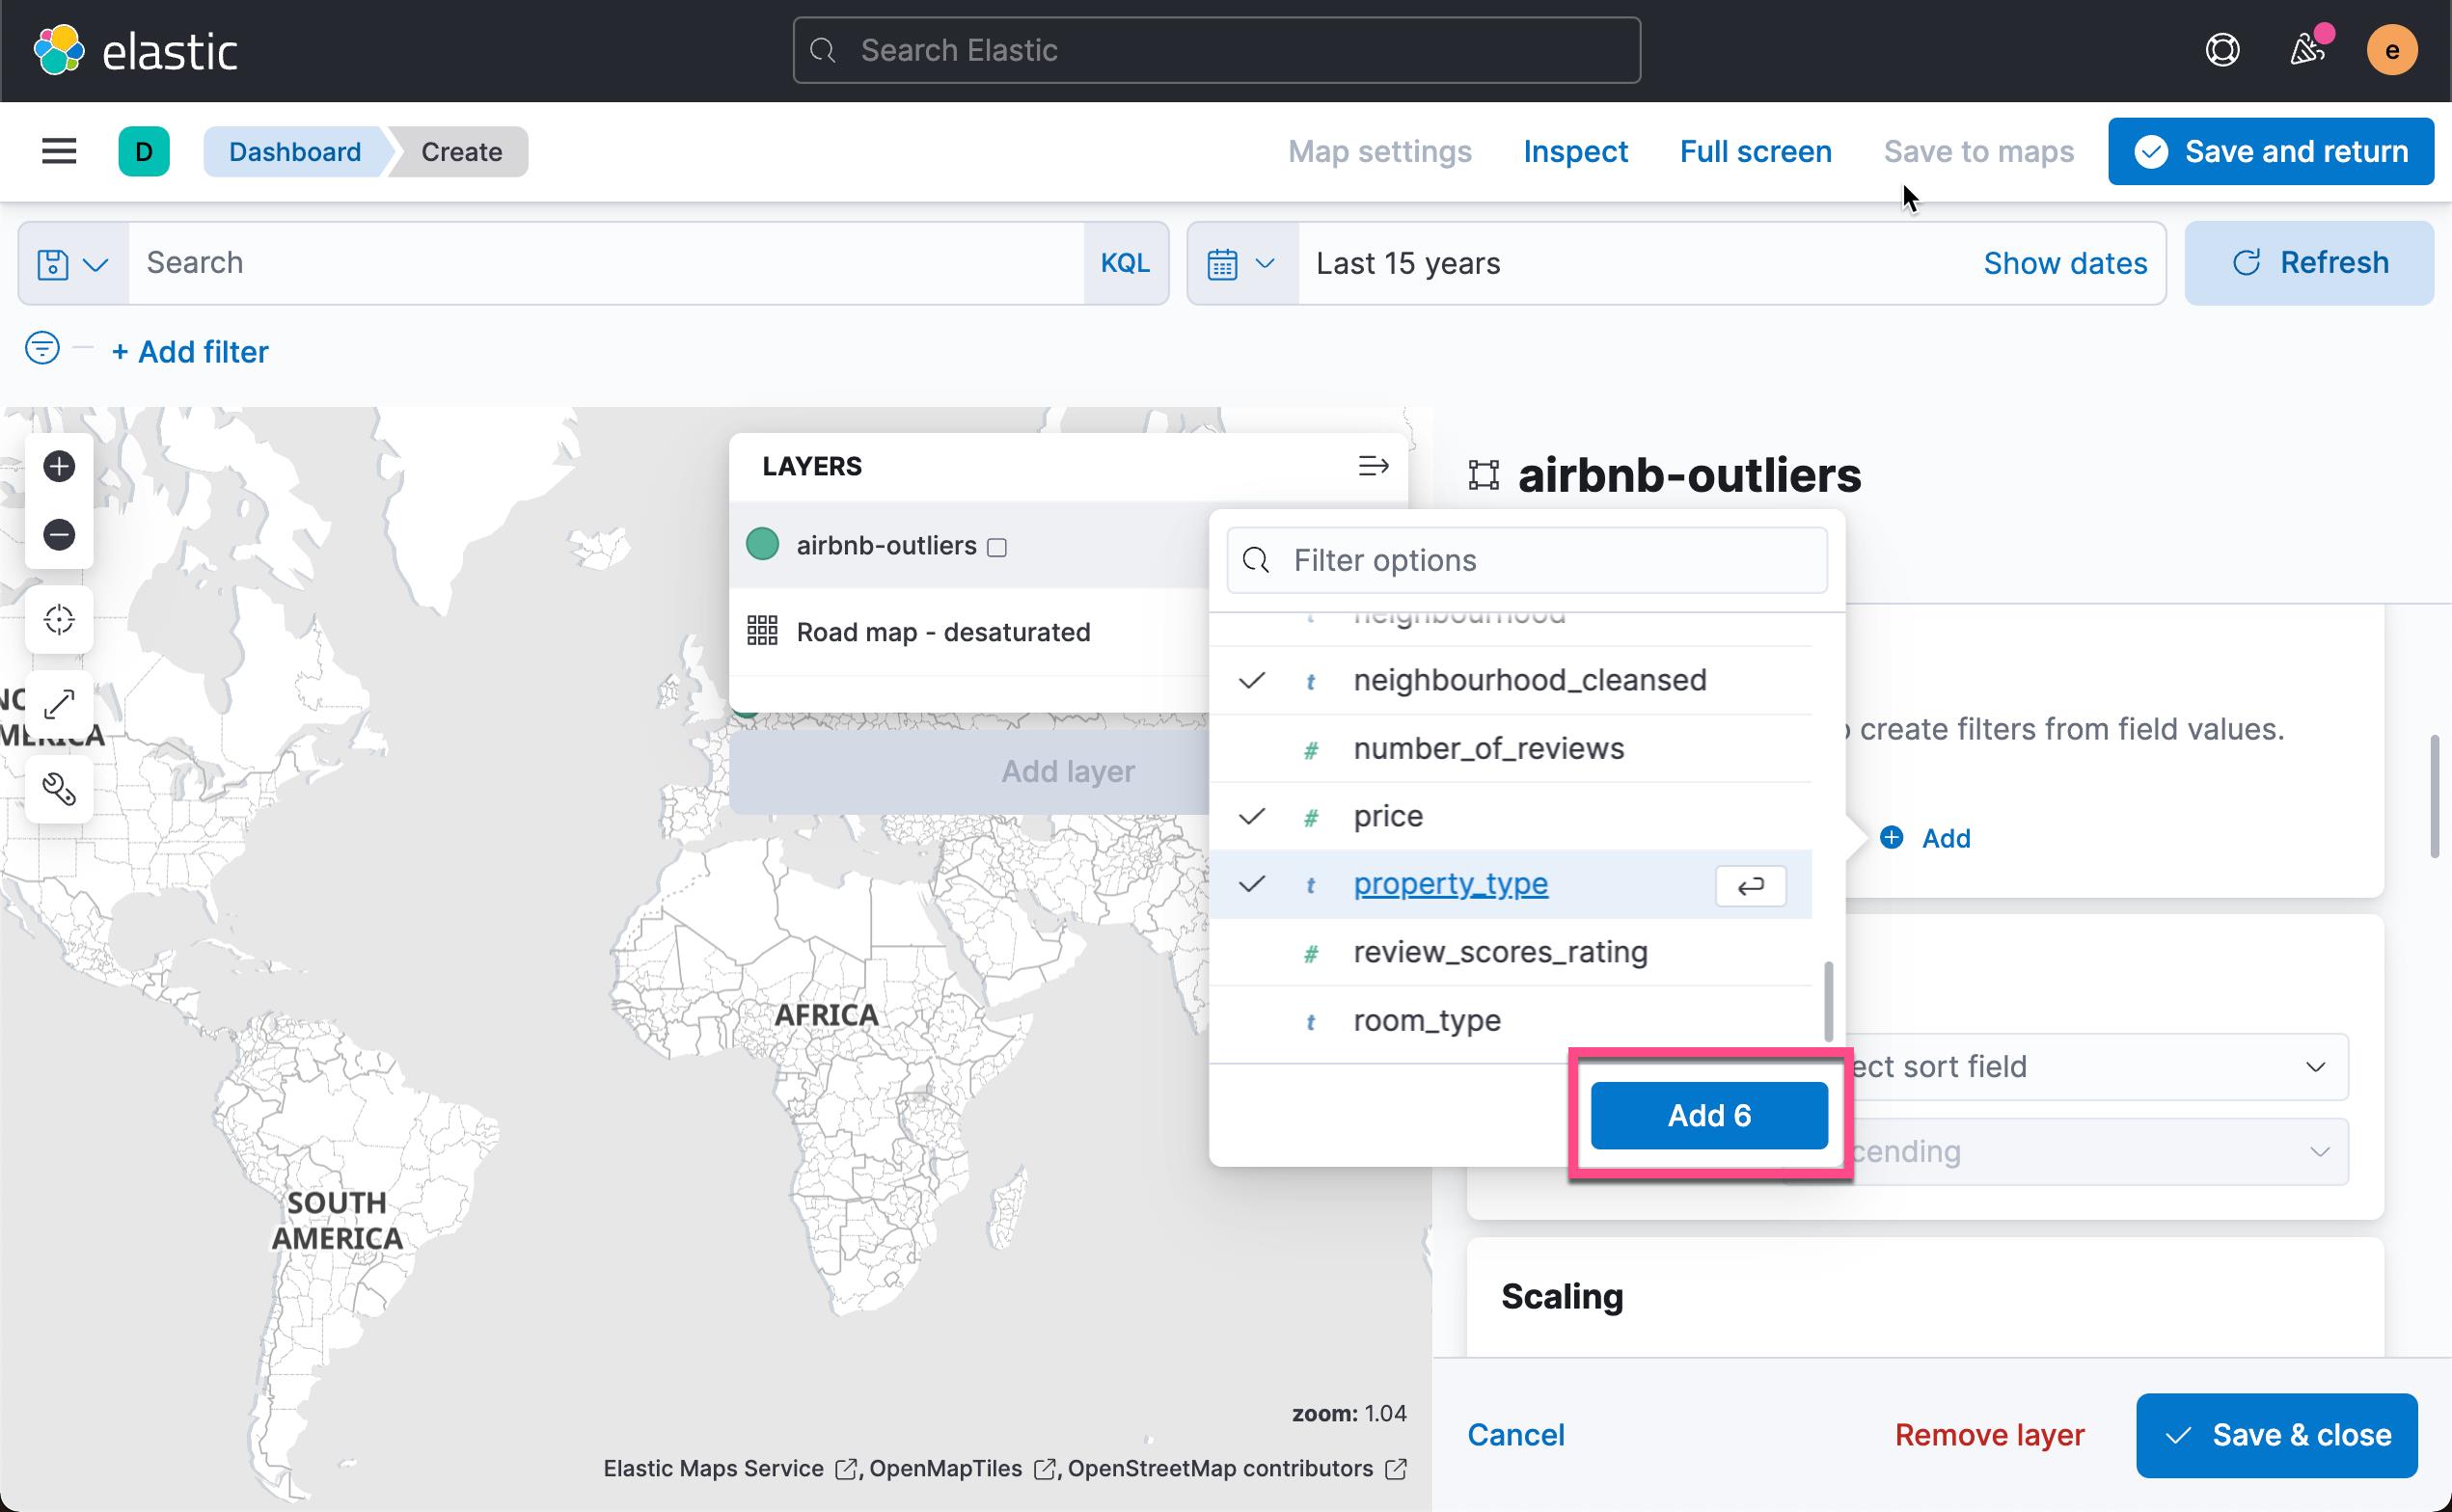
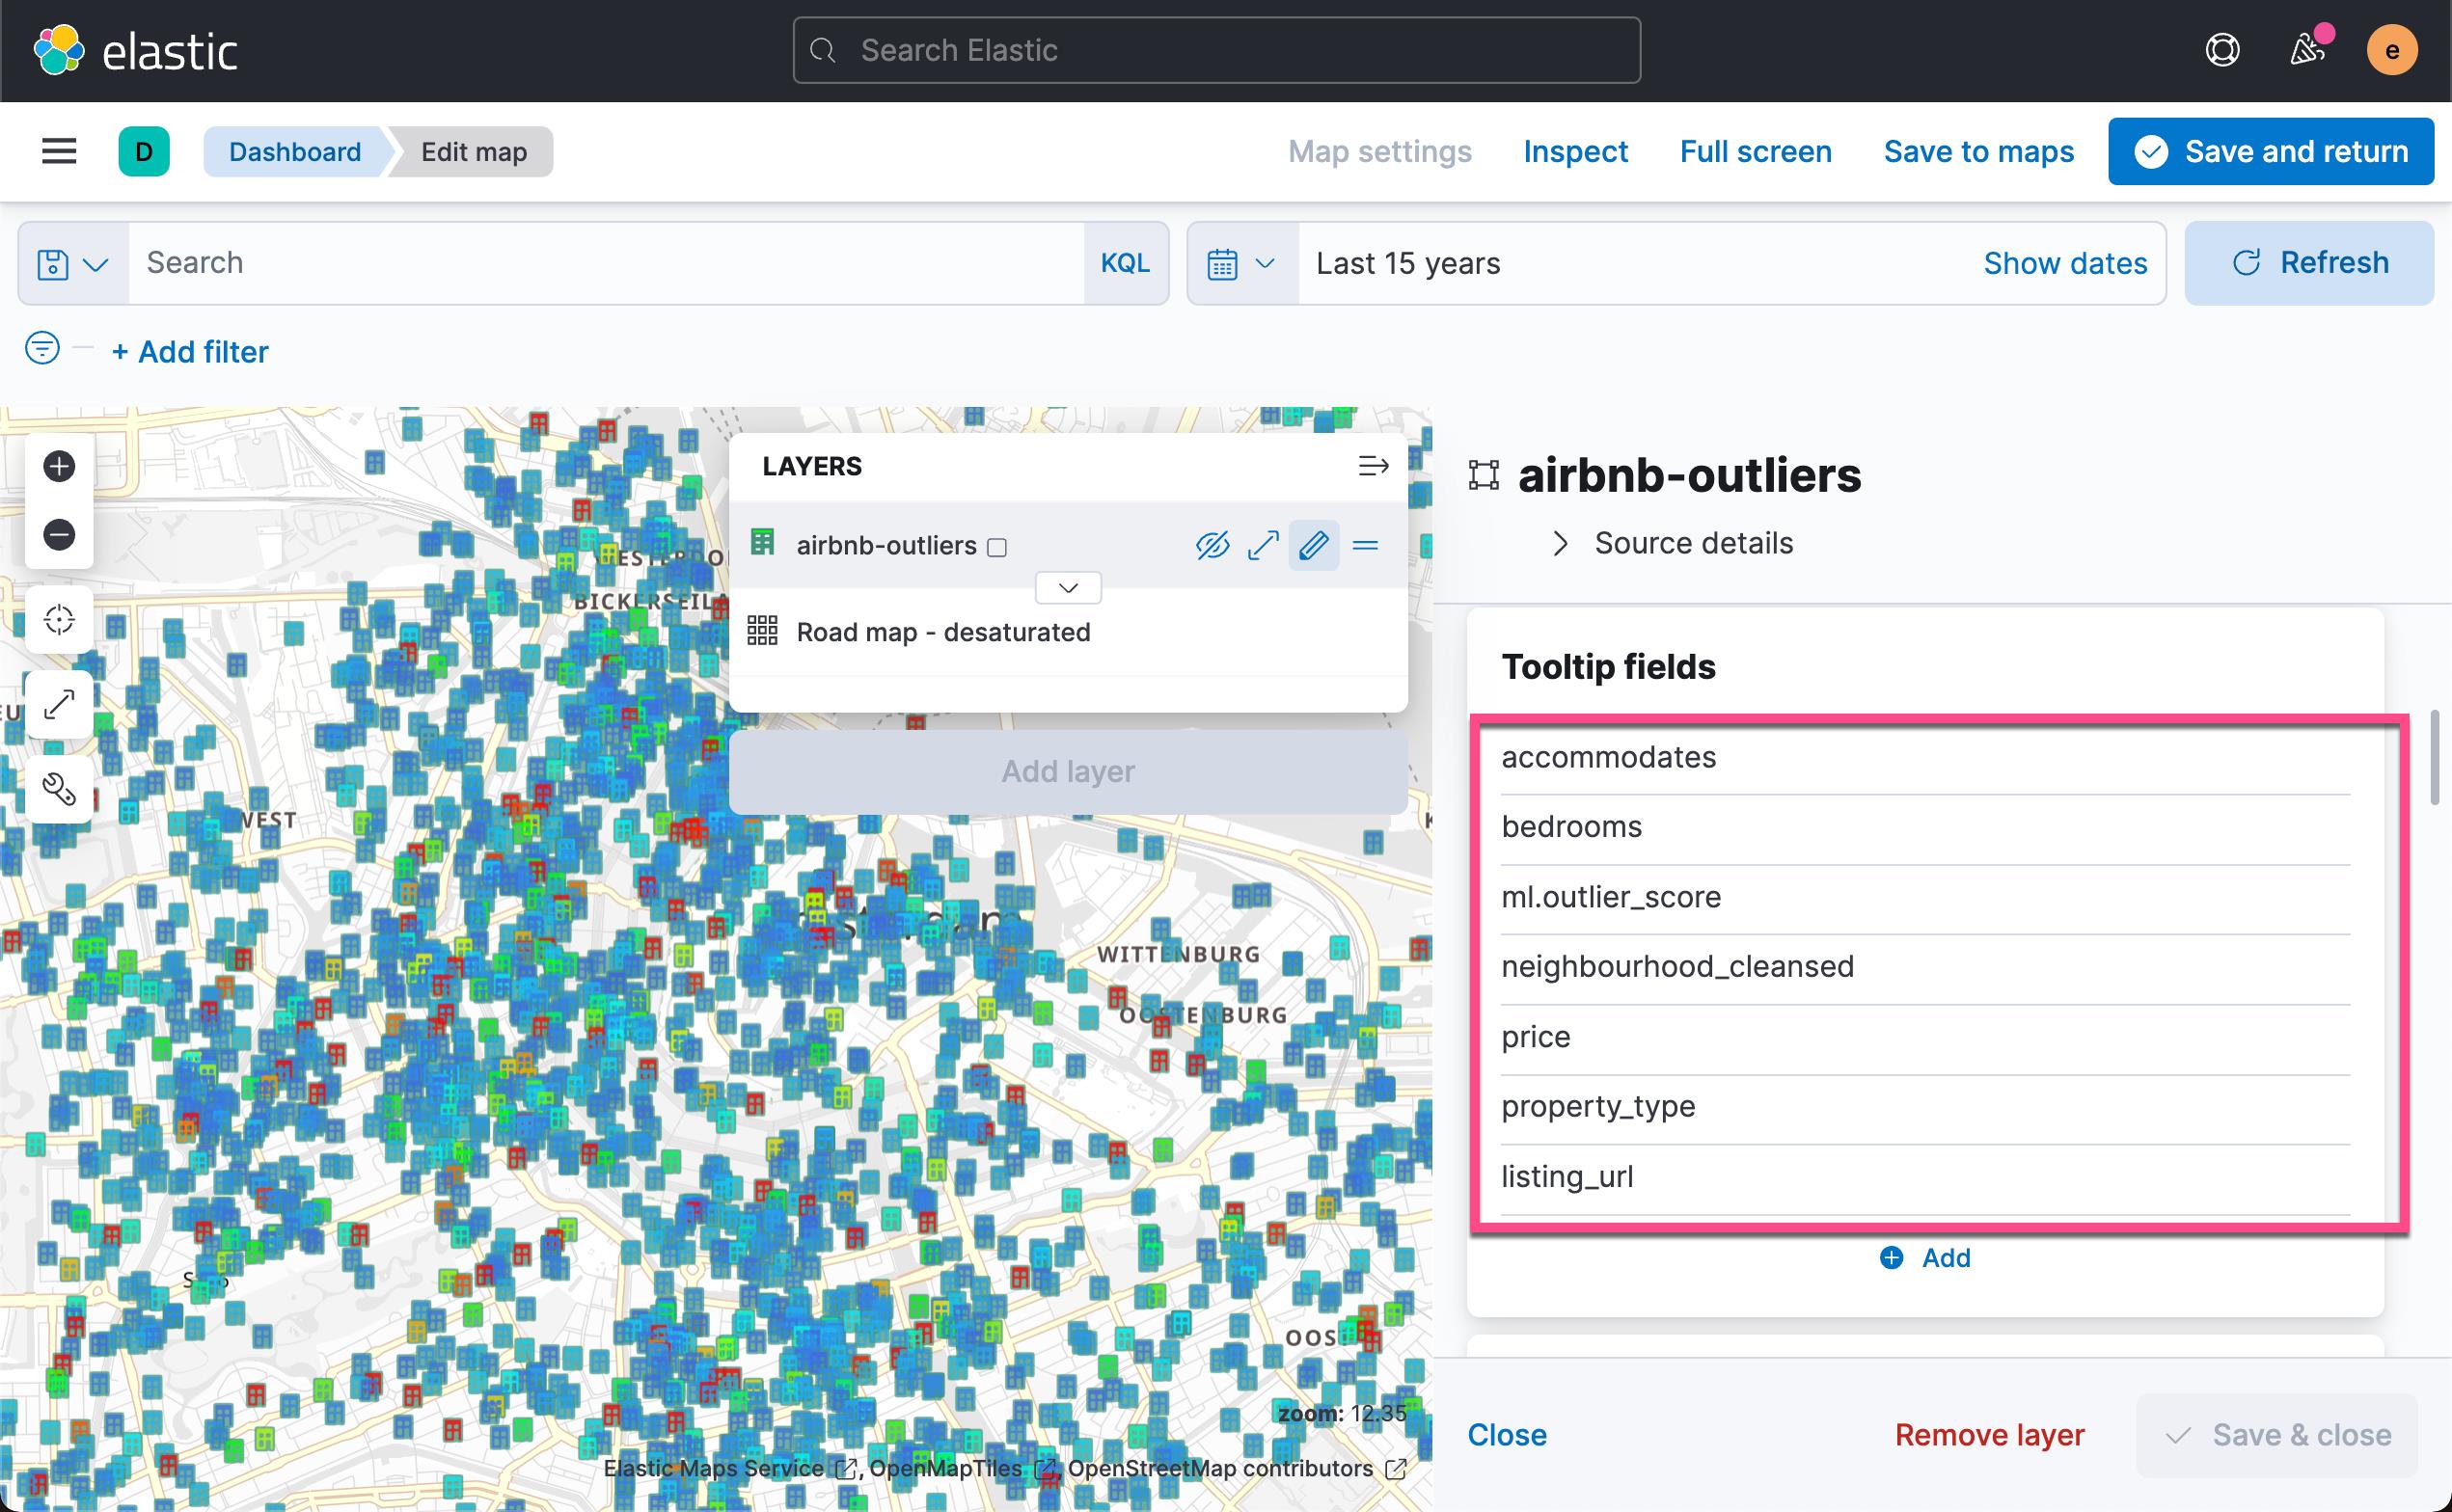
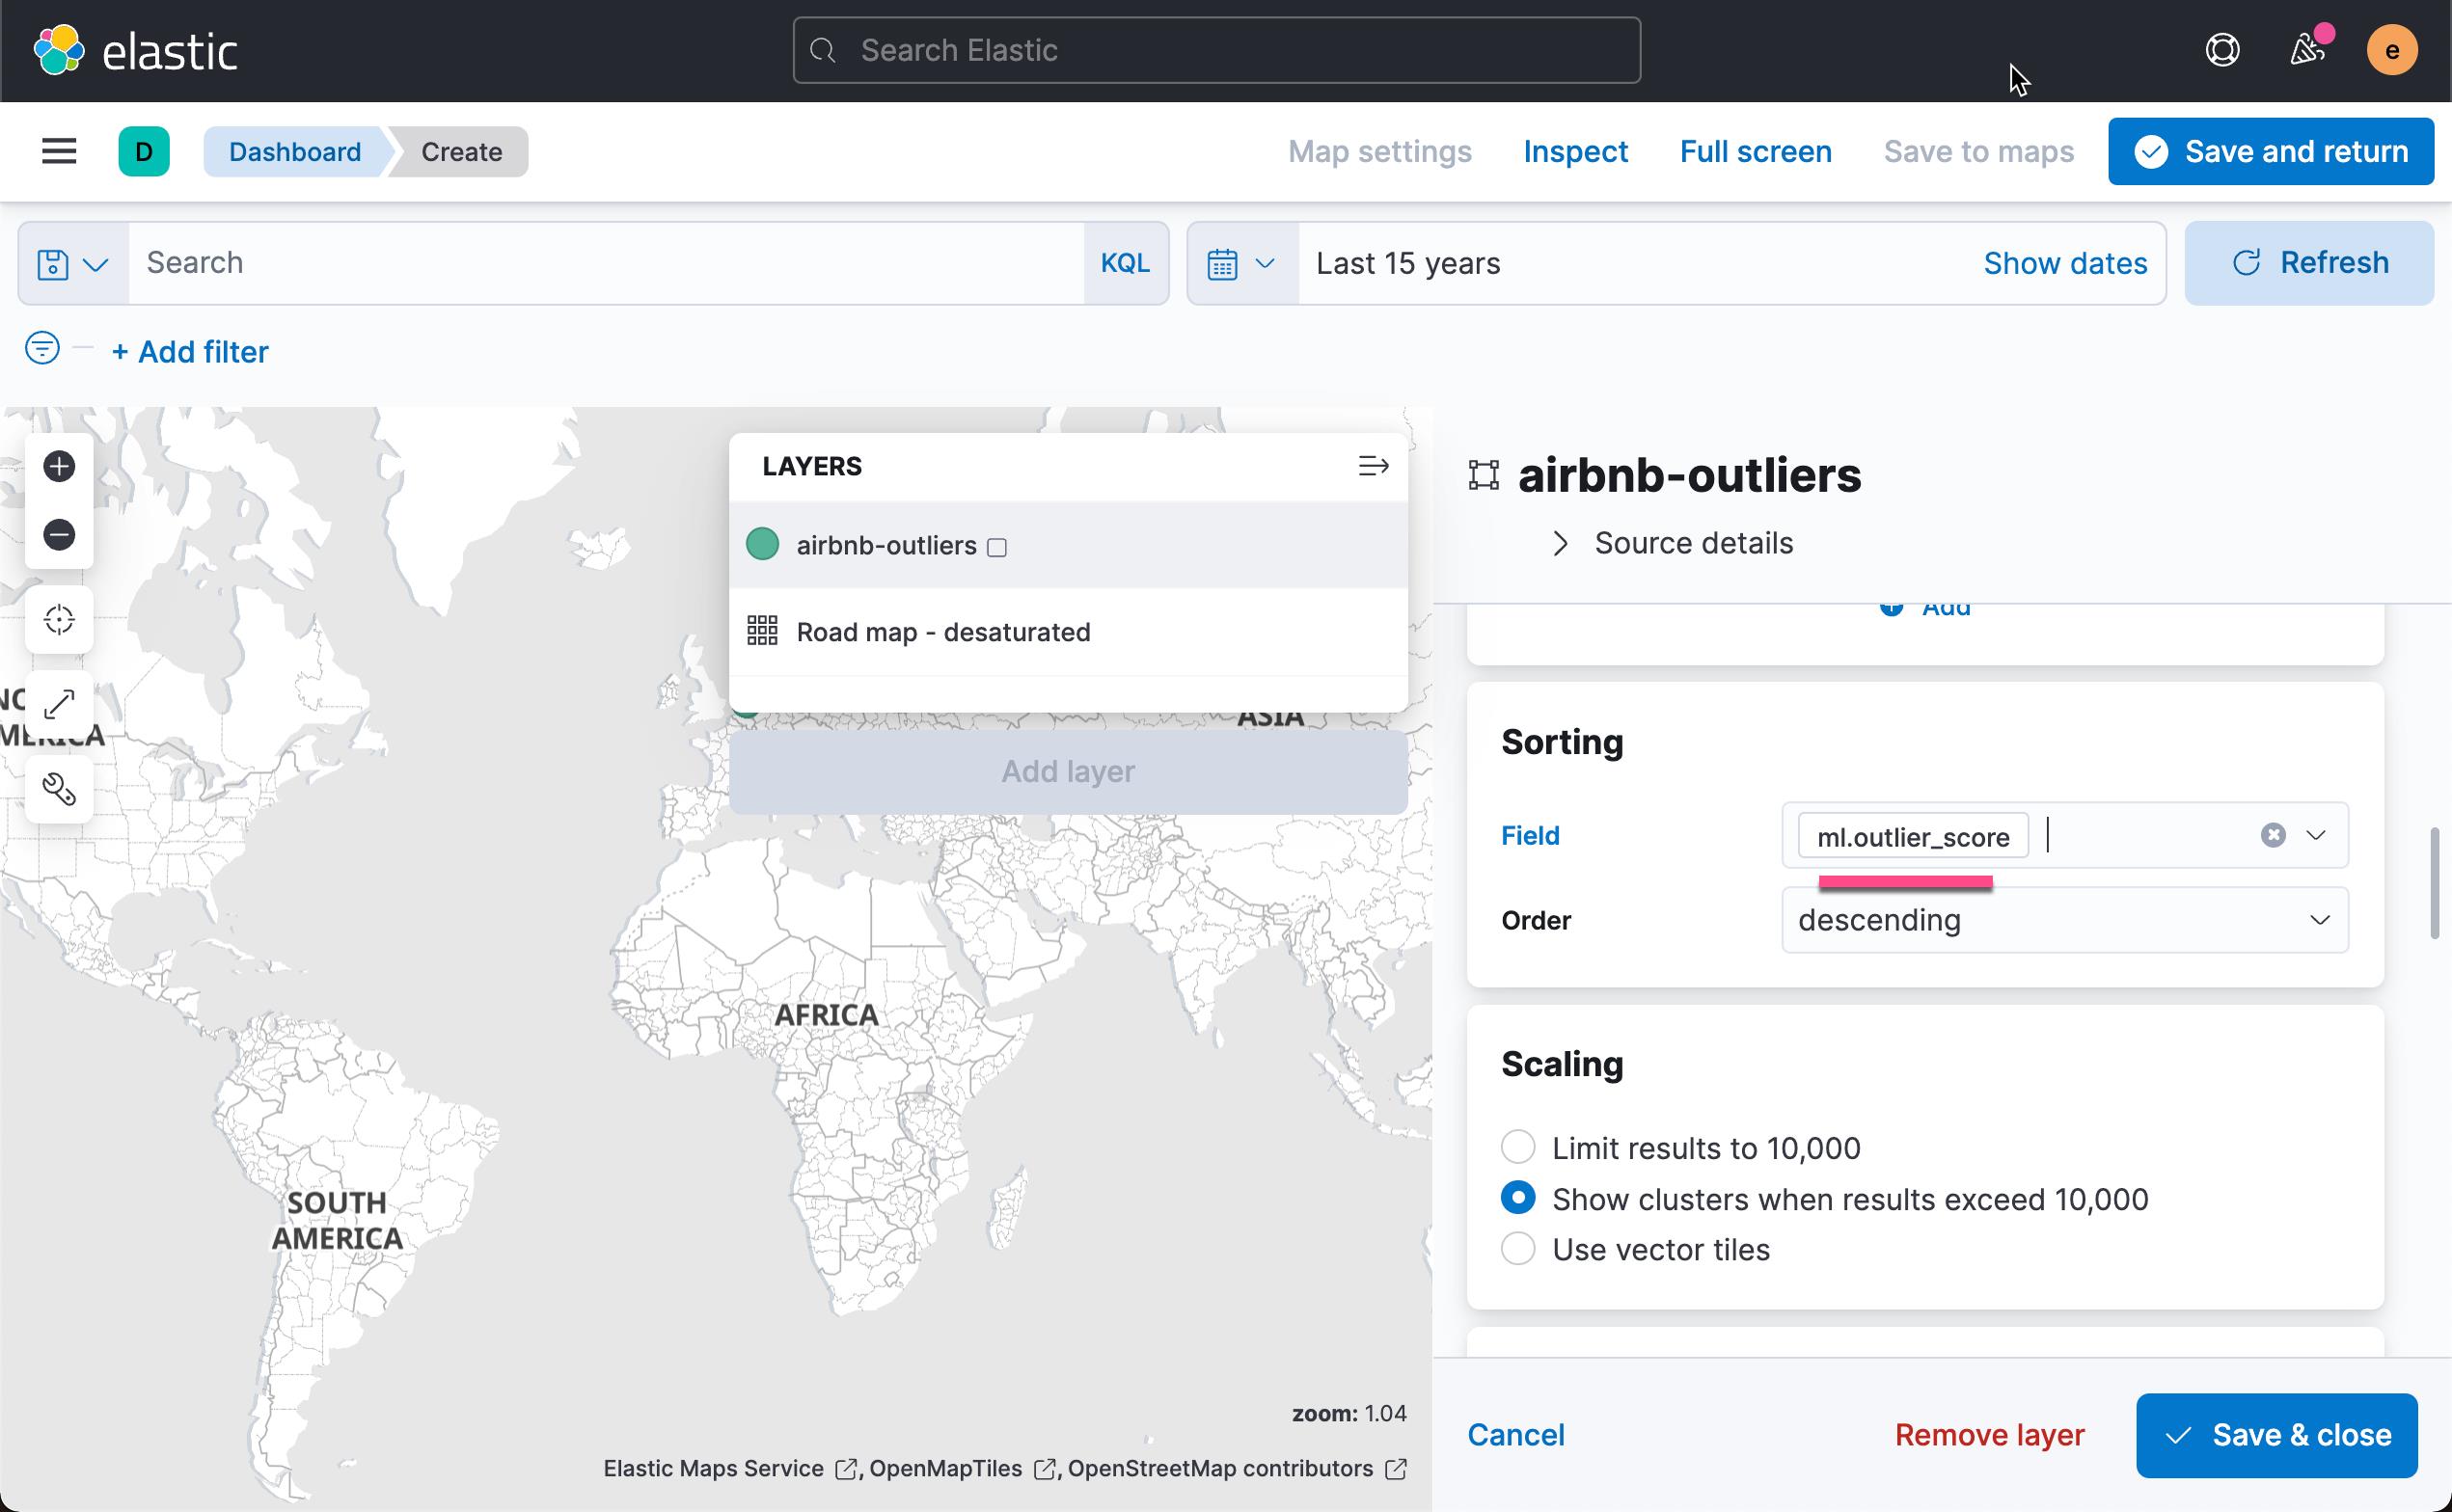
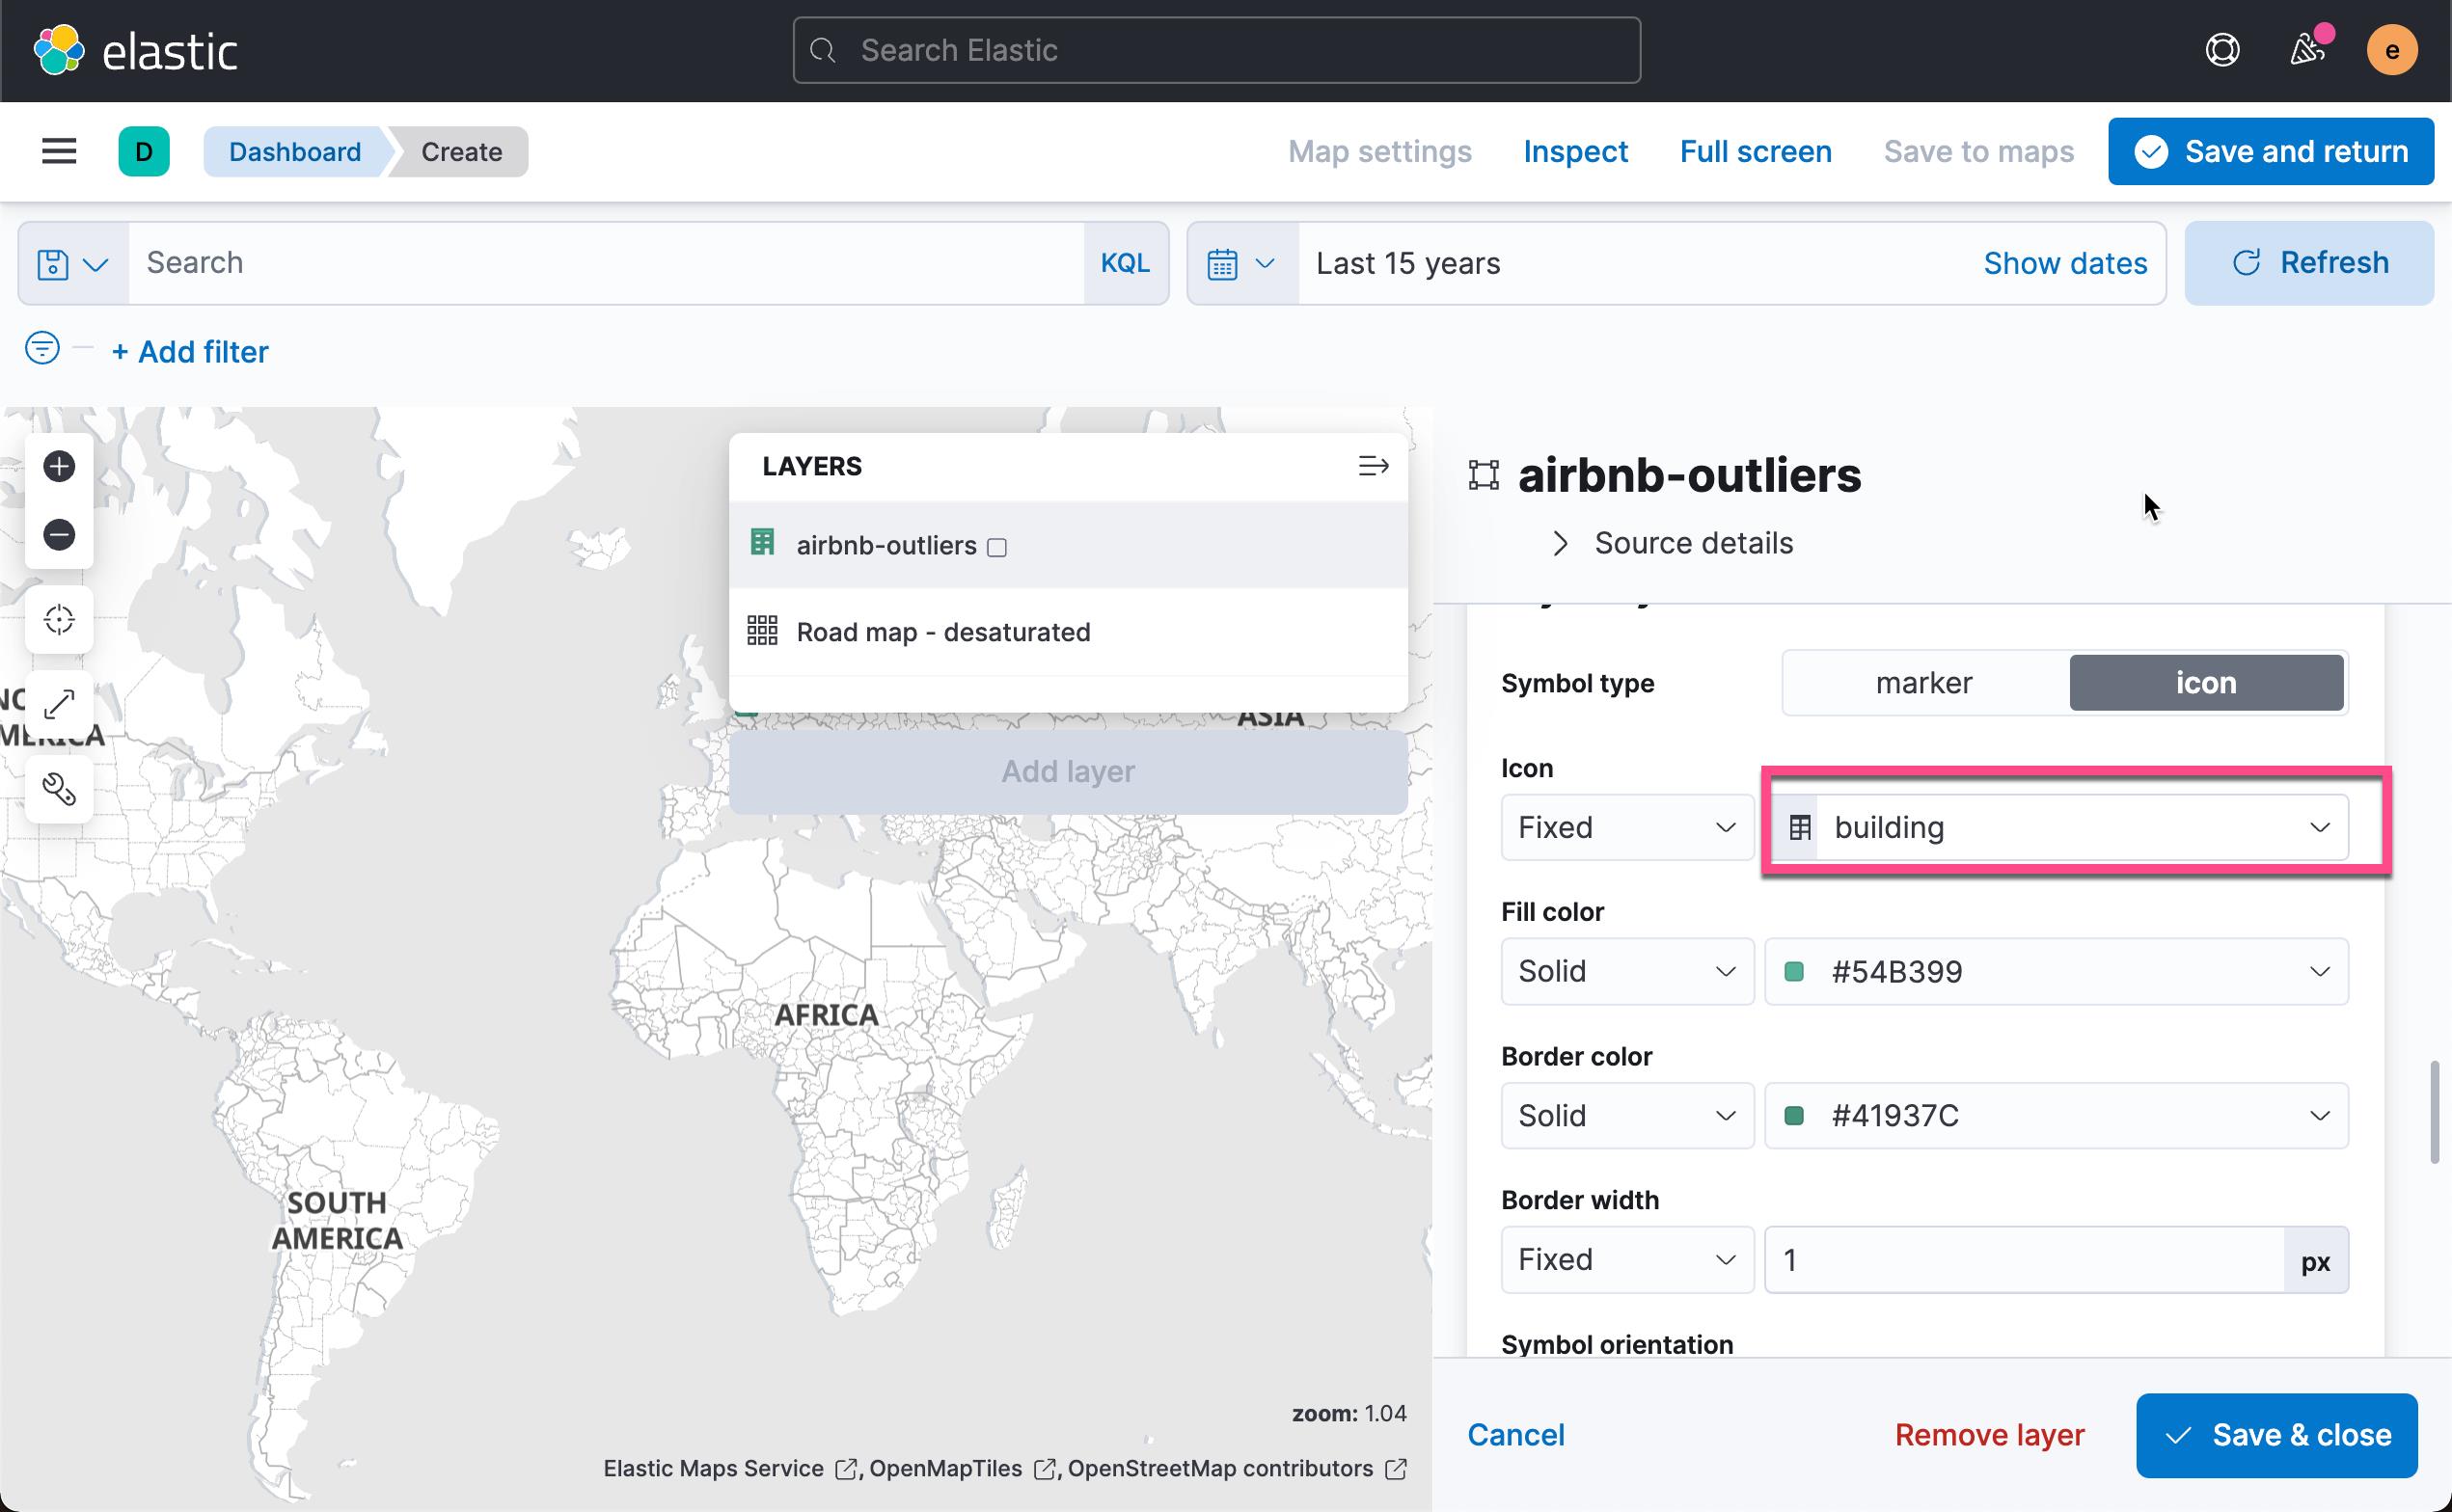
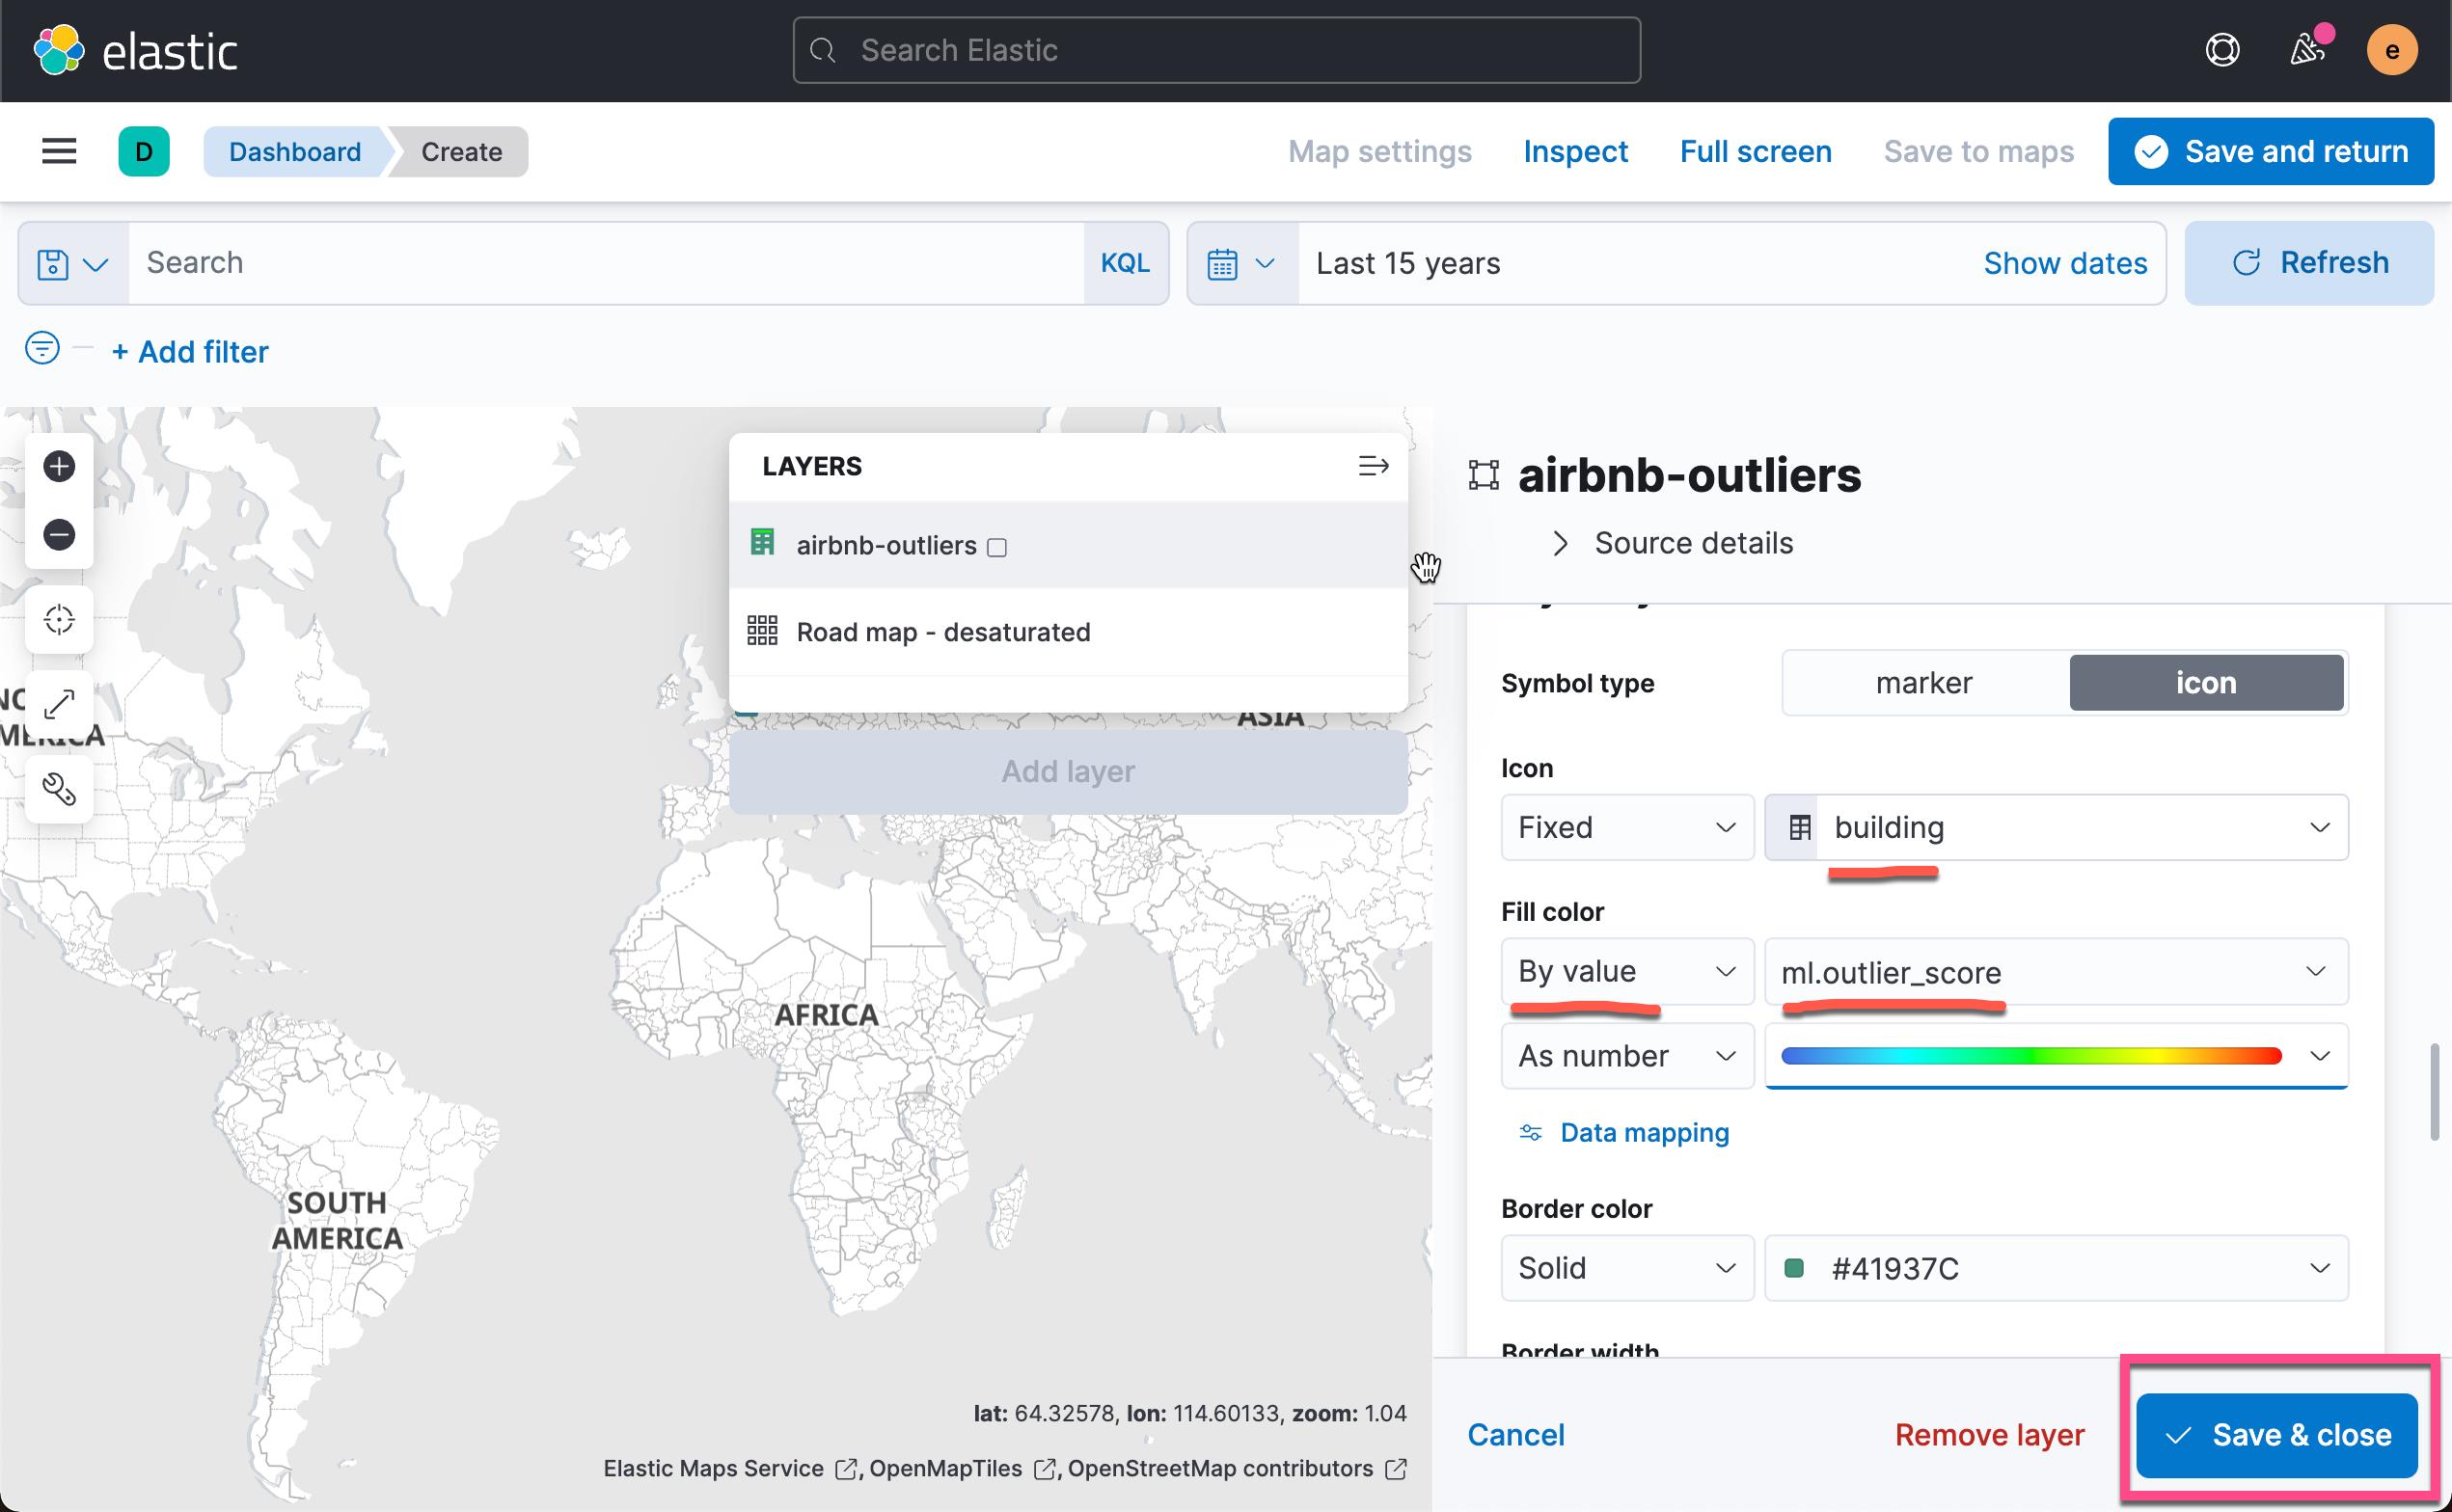
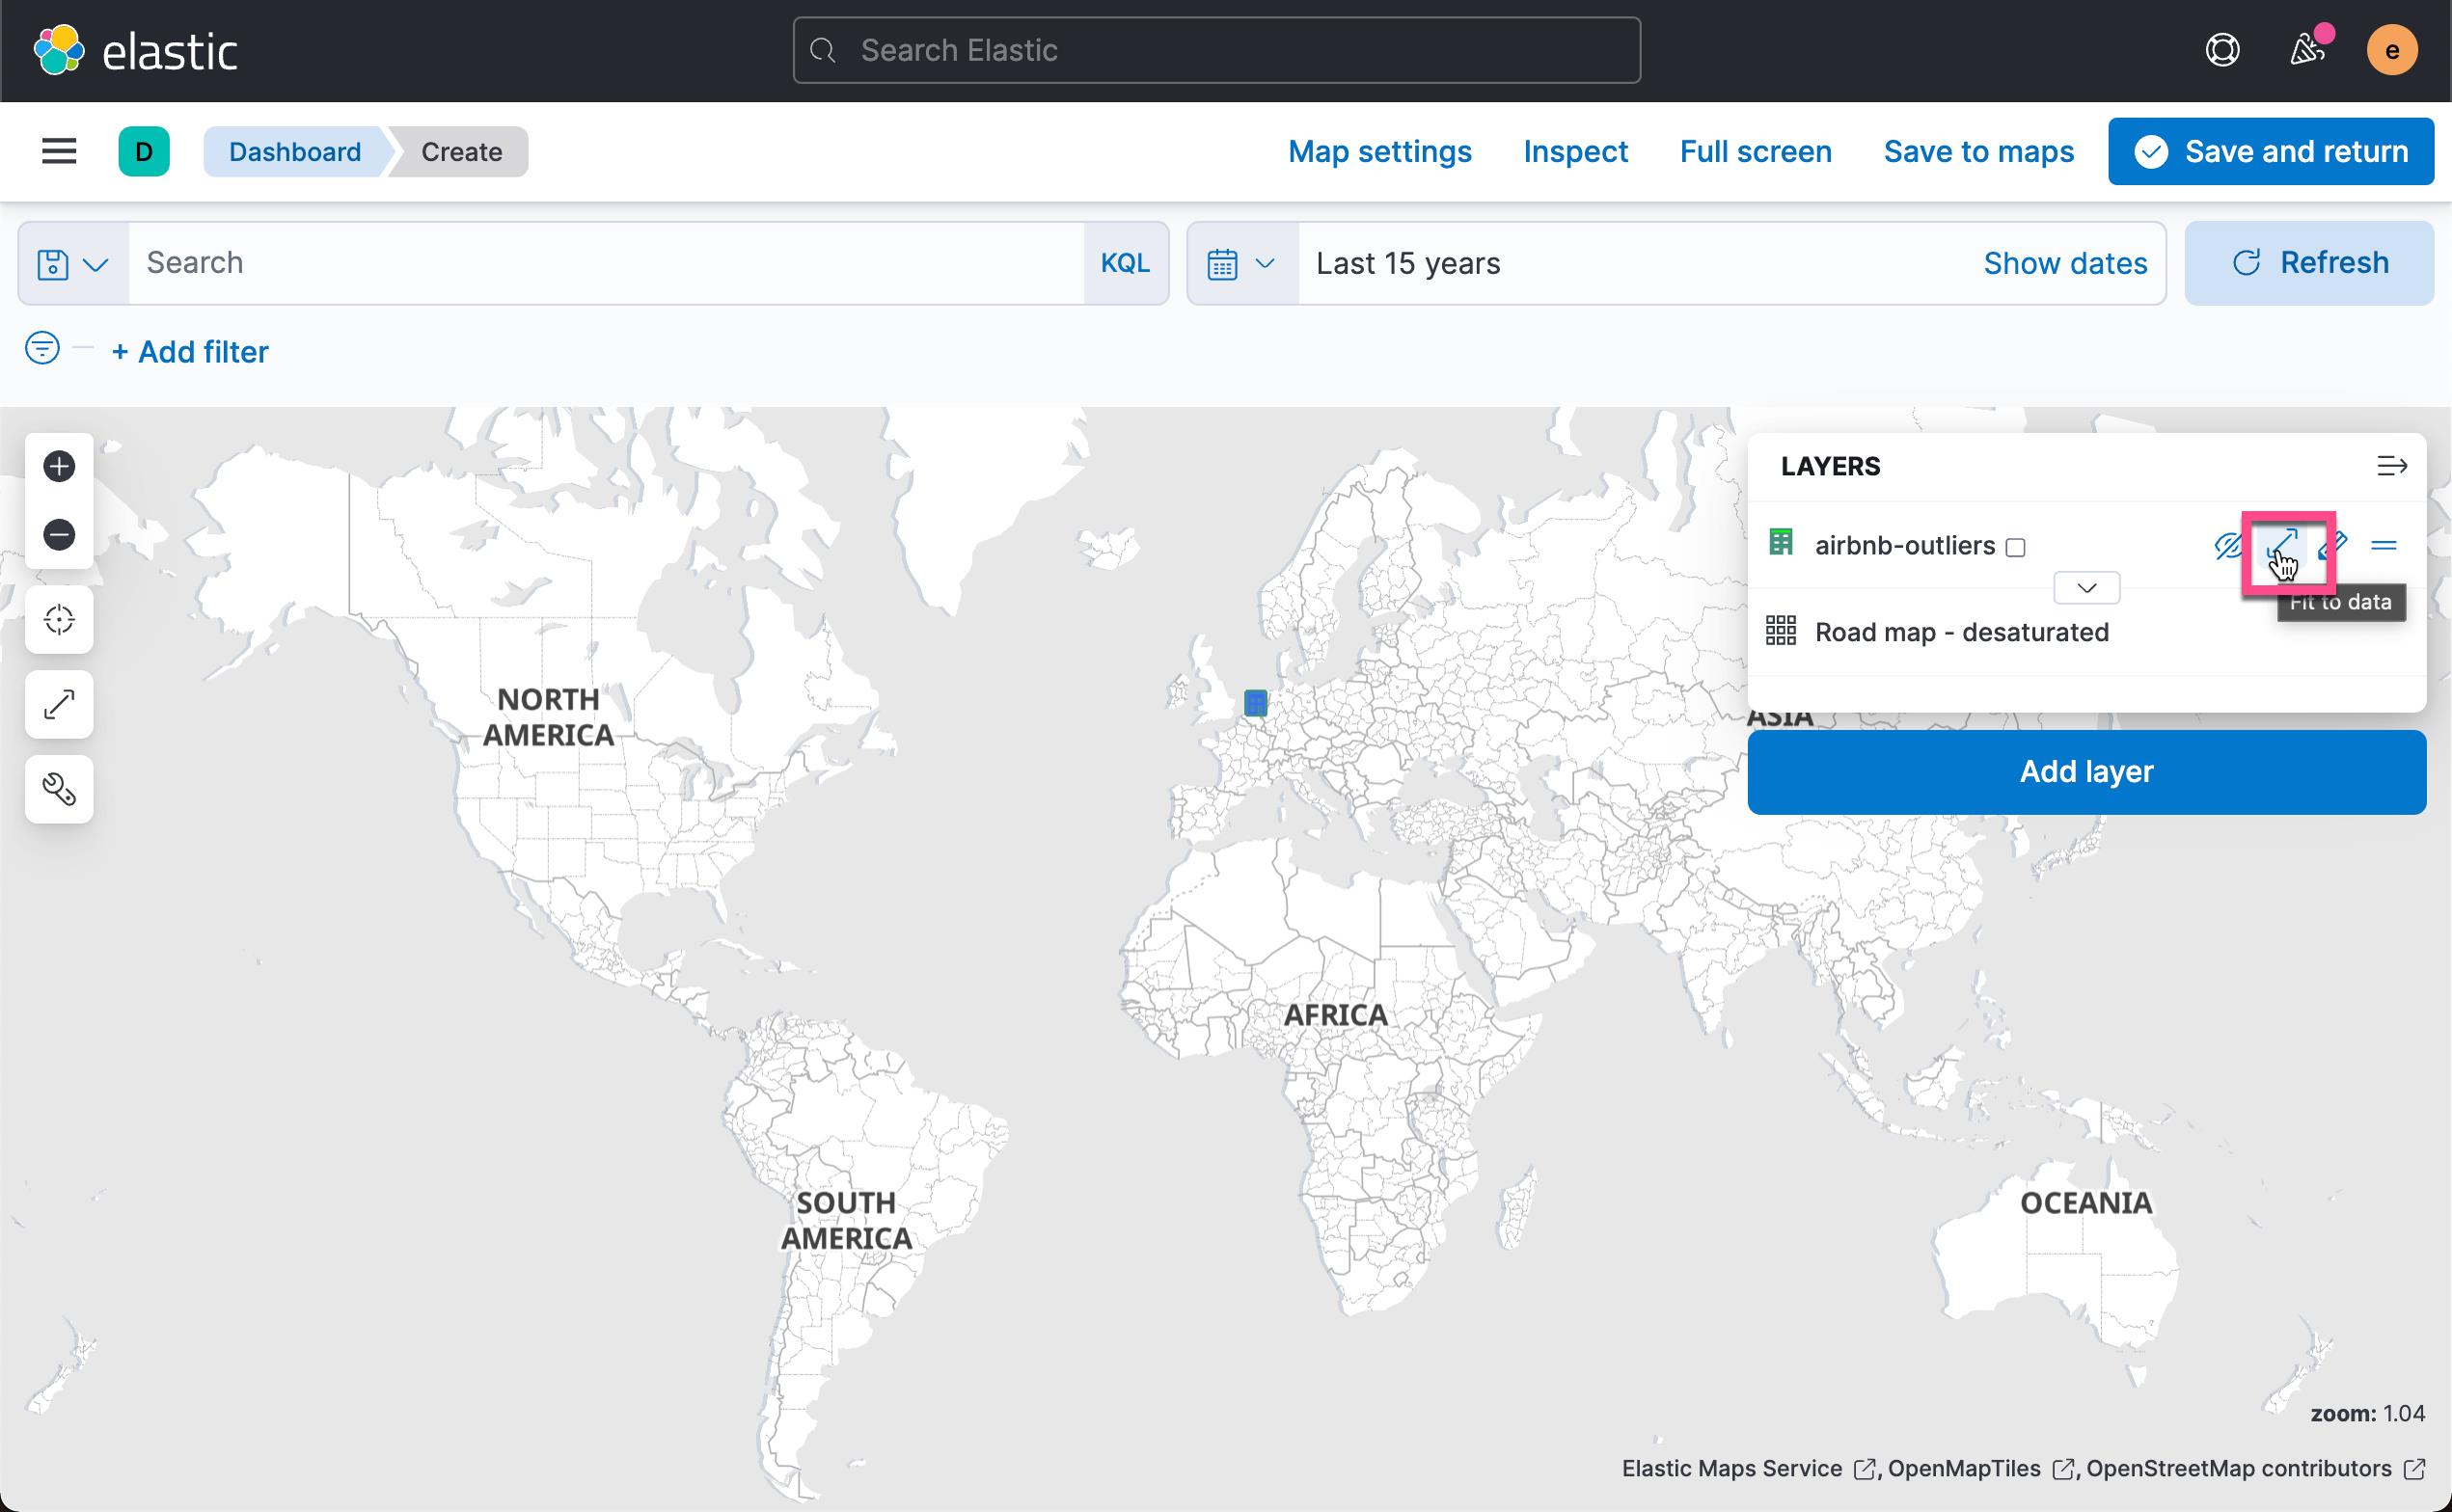

这样我们就得到了所有数据的异常分数值地理分布。 点击上面的 Save & return:
这样就得到了我们的第三个地图可视化。我们点击 Dashboard 的 Save 按钮来保存当前的可视化。
有了这个 Dashboard,我们可以针对数据进行搜索,比如,我们想找到 ml.outlier_socre > 0.8 的所有文档:
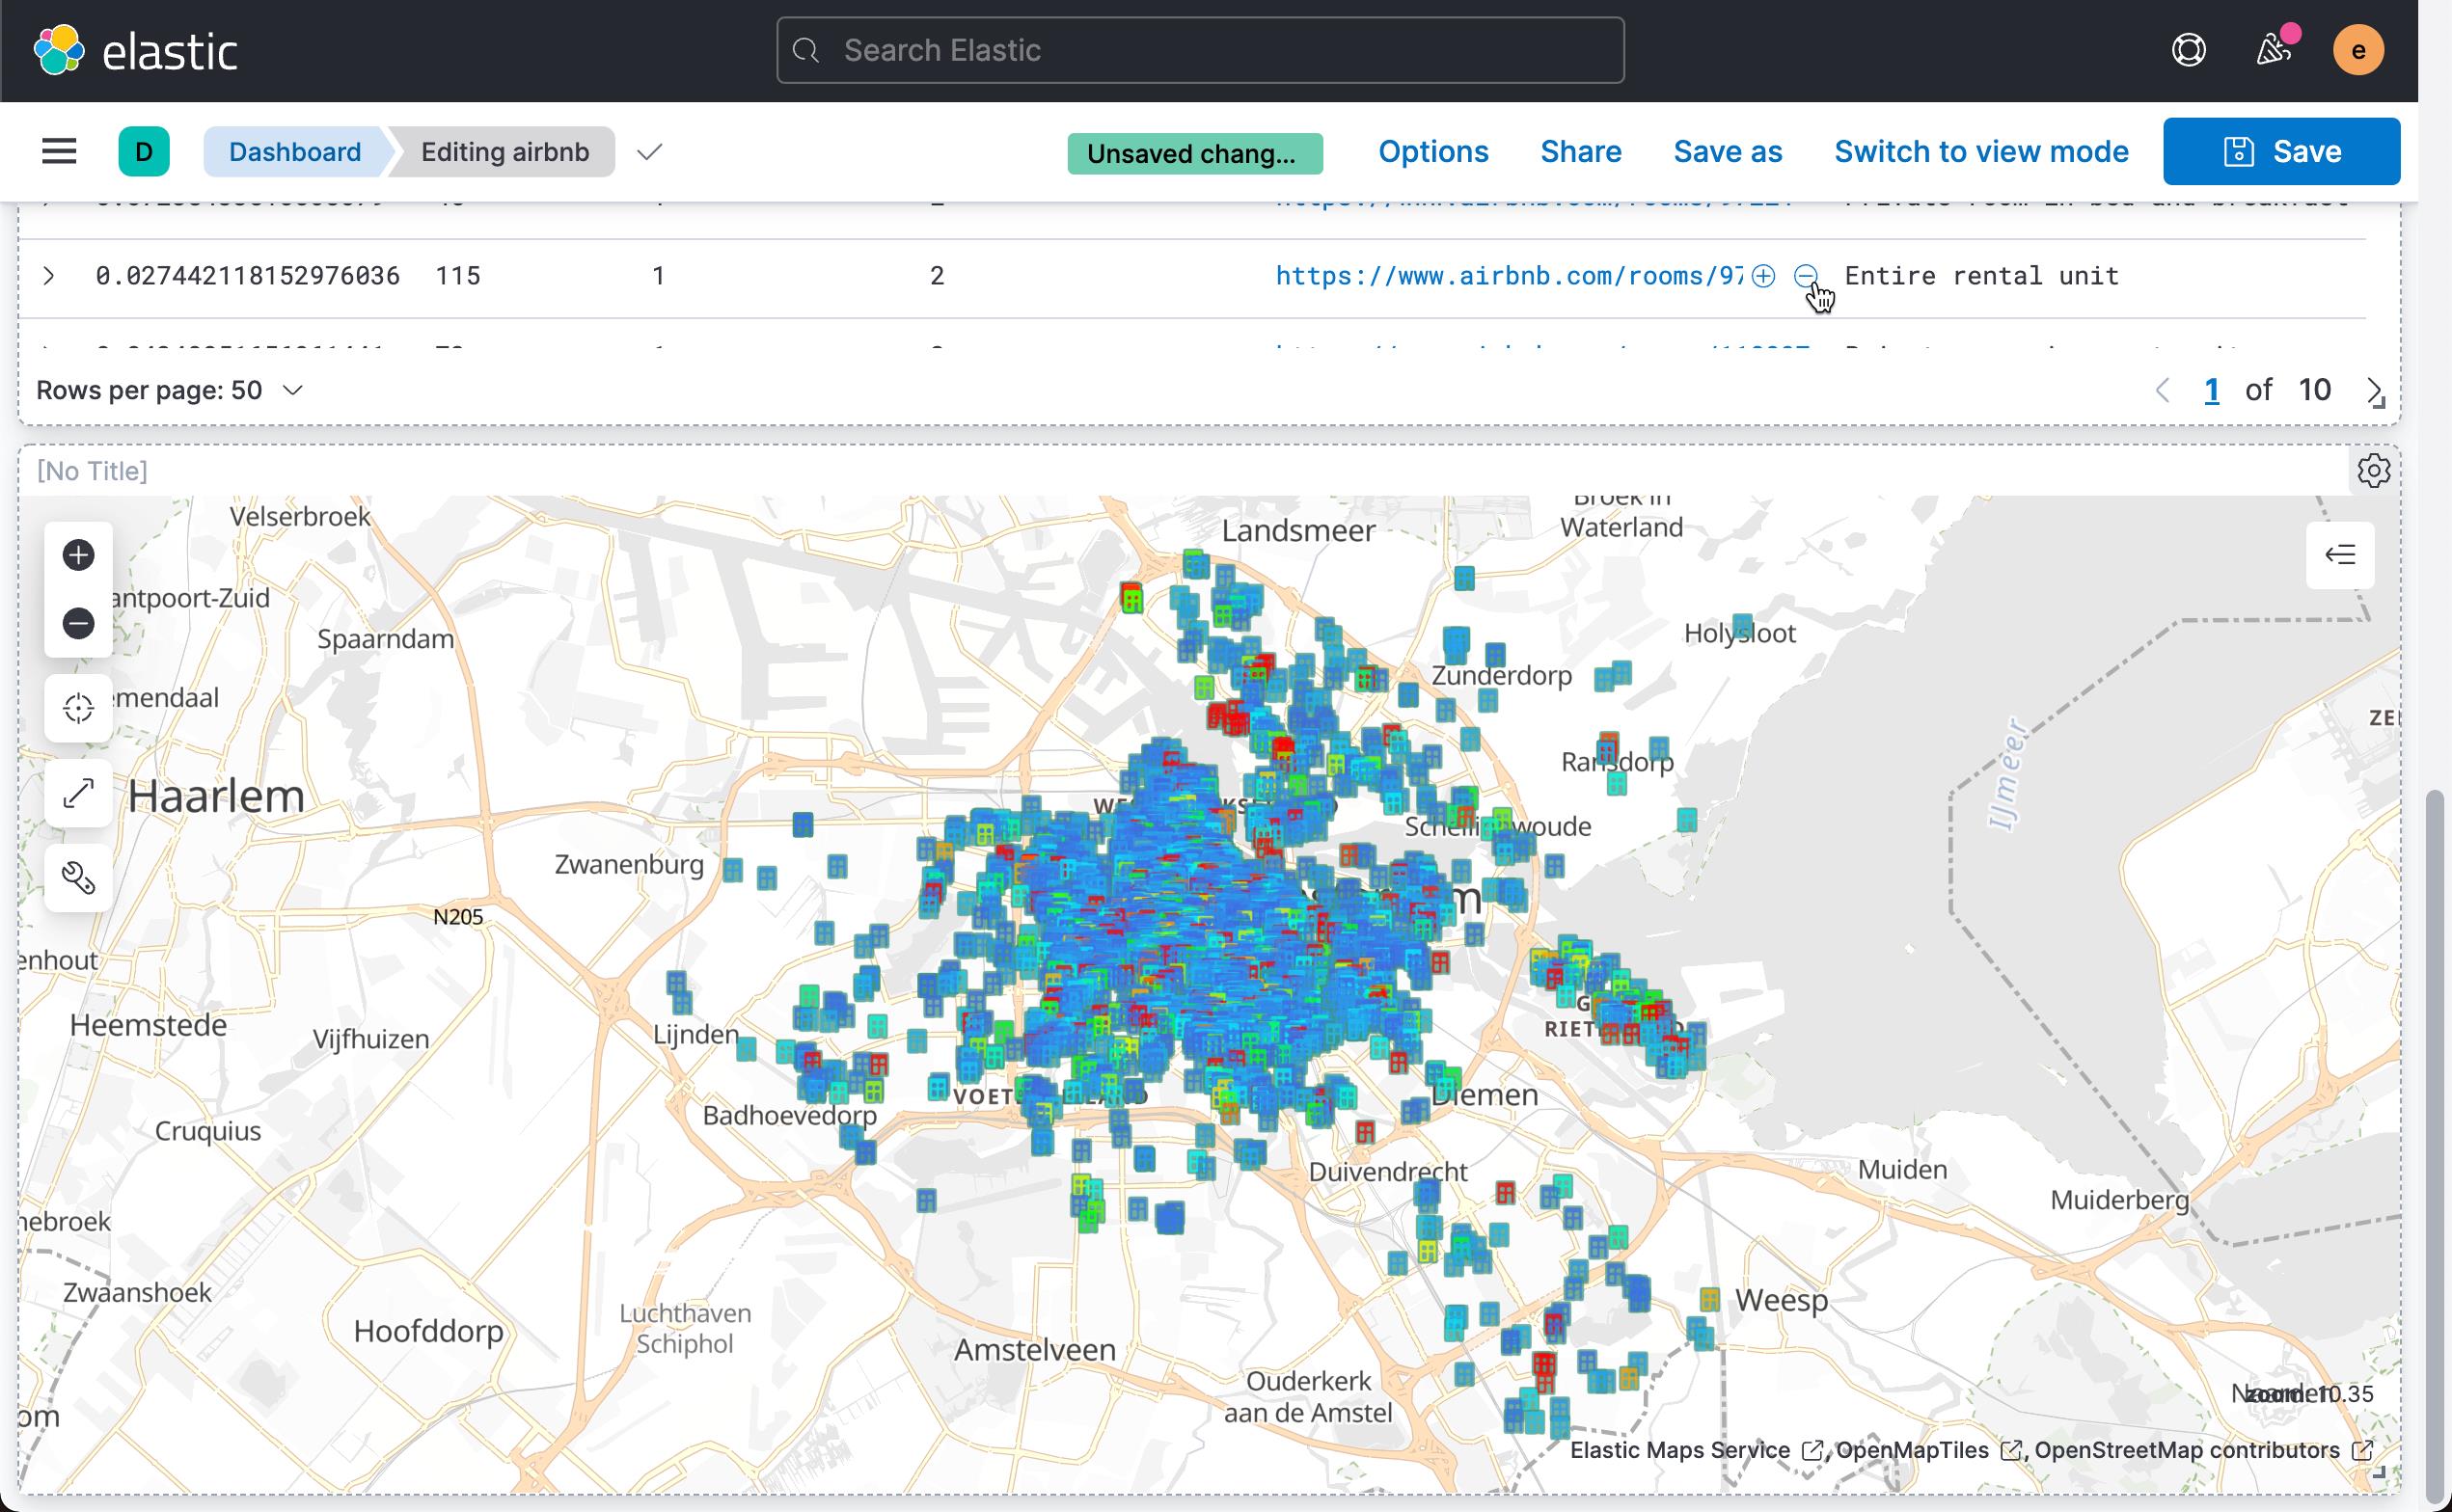
我们可以运用地图查看是那些位置的房子有异常:
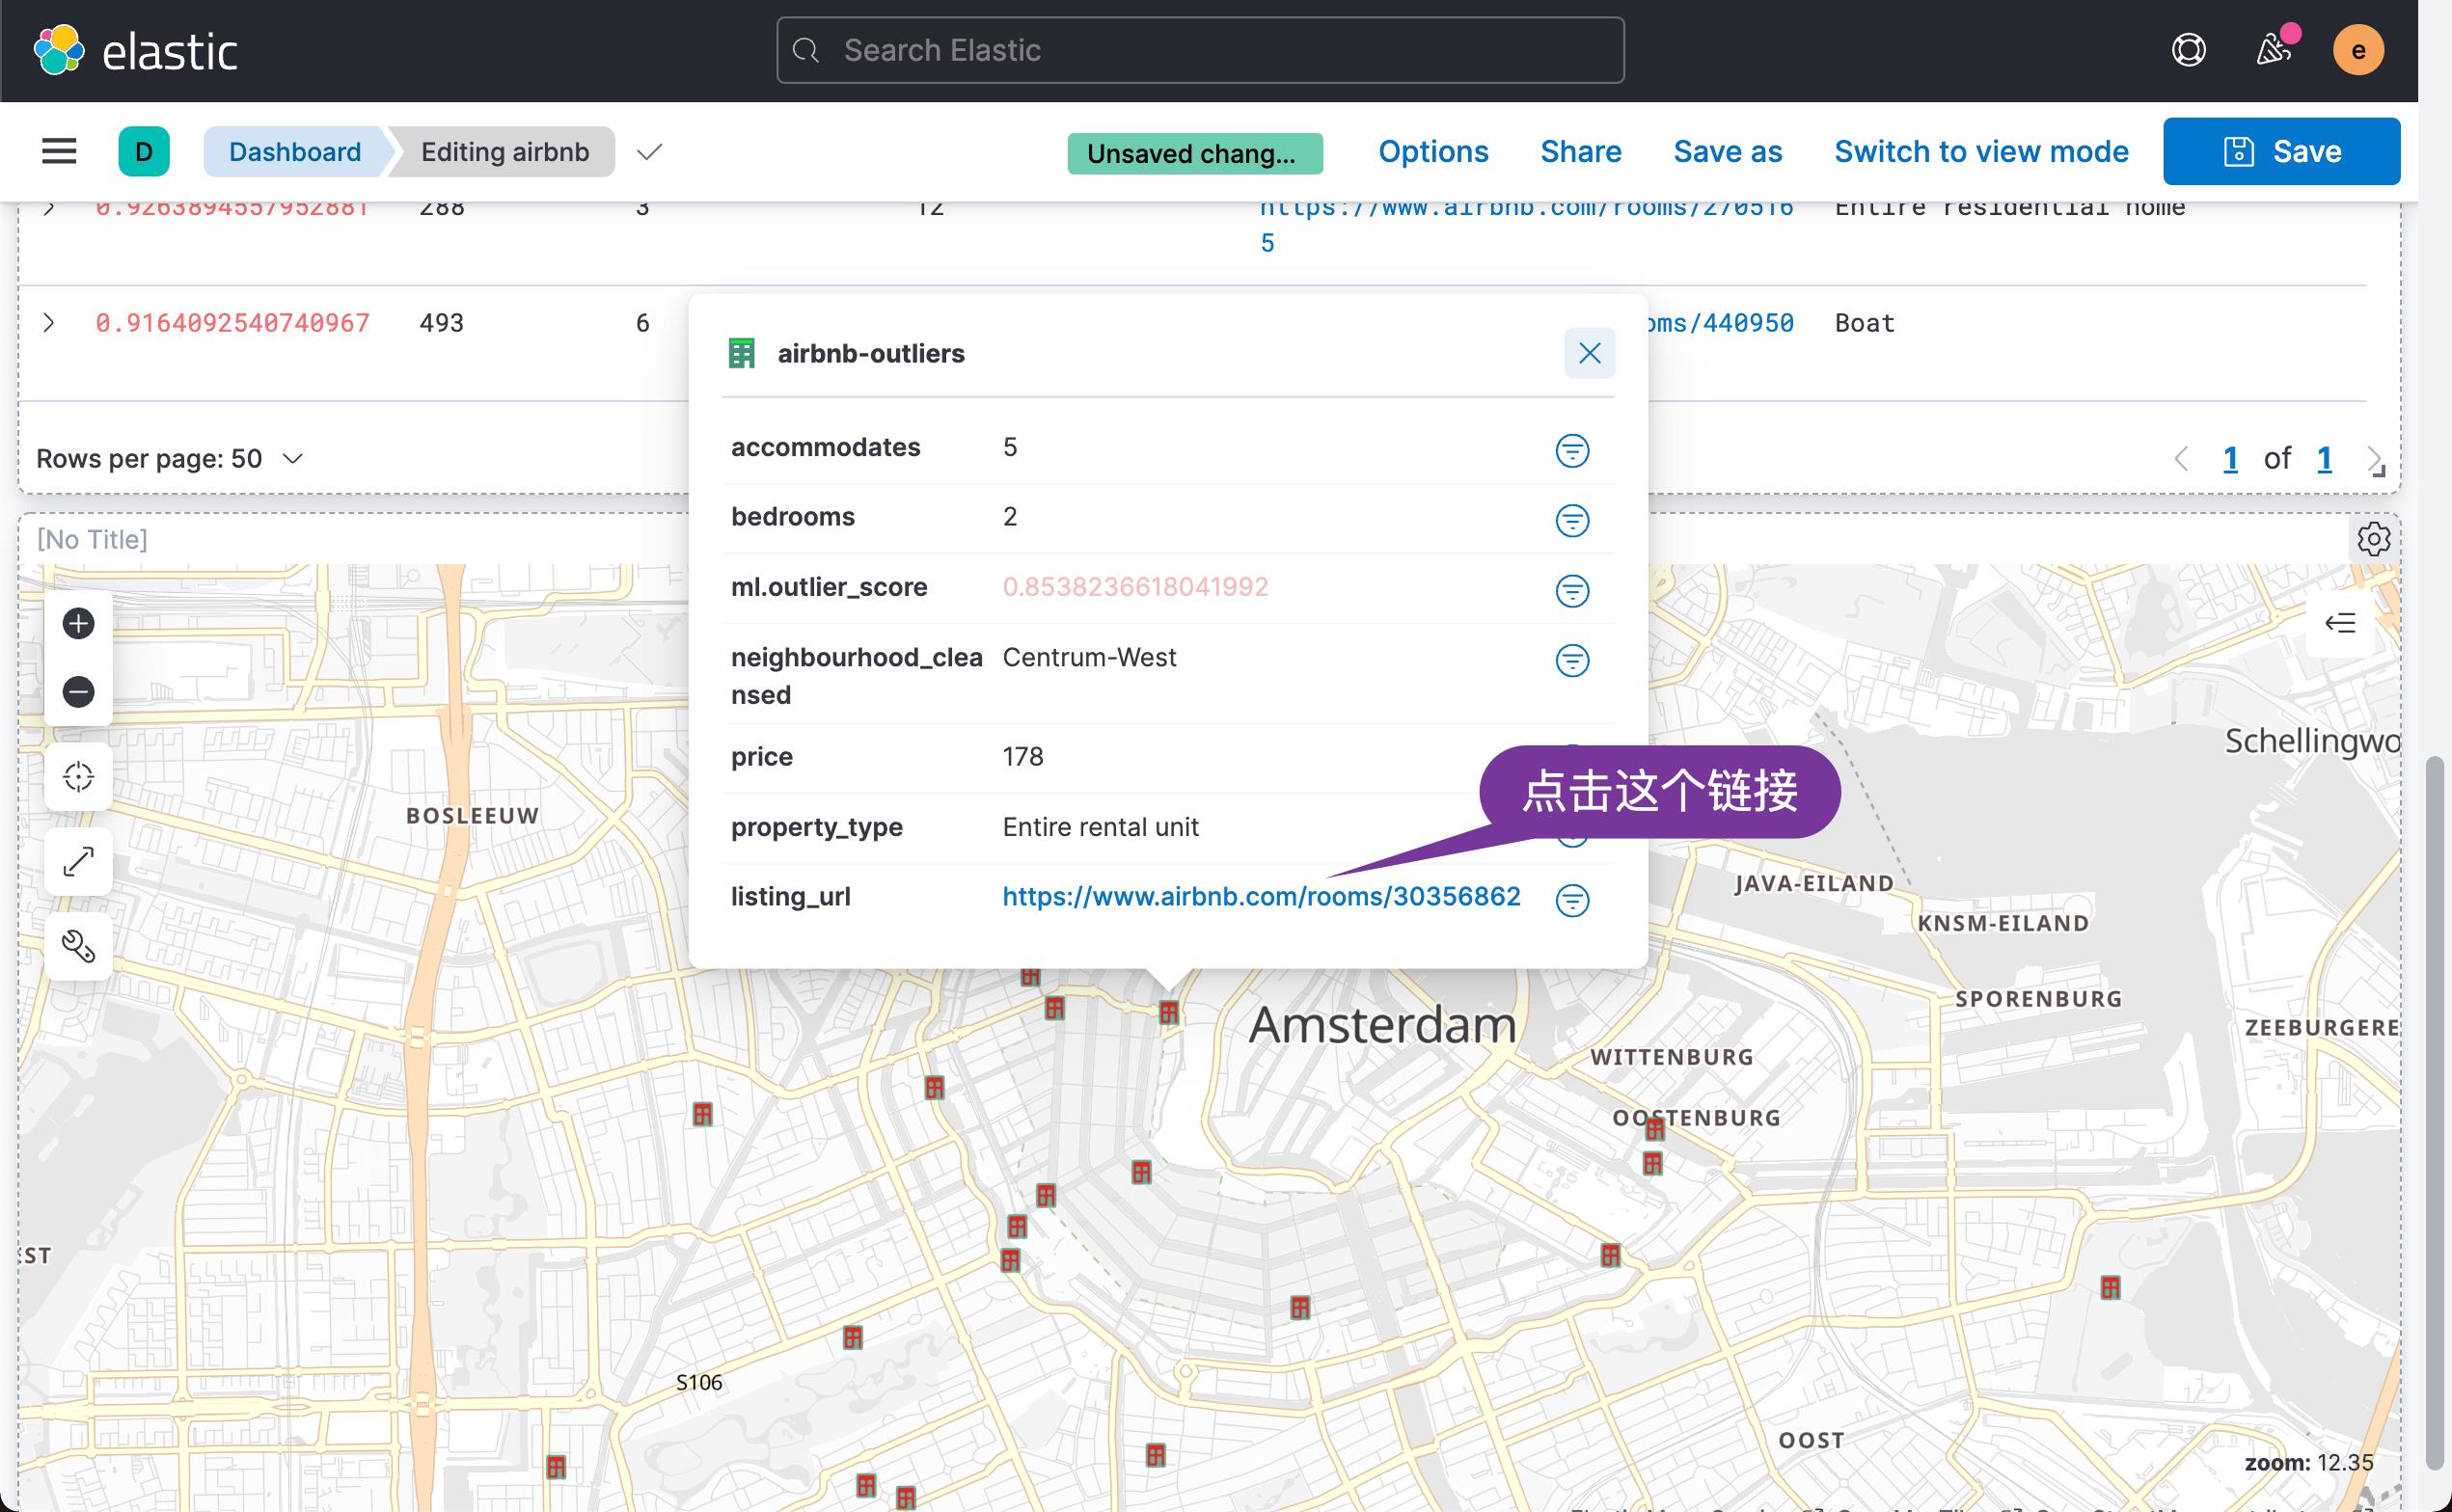

我们可以看到这个房子网站的详细信息。
以上是关于Elastic:使用 Elastic Stack 进行异常值检测 - airbnb 数据分析的主要内容,如果未能解决你的问题,请参考以下文章