Enrichment Map User guide用户指南
Posted
tags:
篇首语:本文由小常识网(cha138.com)小编为大家整理,主要介绍了Enrichment Map User guide用户指南相关的知识,希望对你有一定的参考价值。
参考技术AEnrichment Map User guide
译者:Y大宽
http://www.baderlab.org/Software/EnrichmentMap/UserManual#rnk
总概
CM可以使GSEA结果以网络化的形式可视化呈现。可以是GSEA的结果,当然也可以是DAVID,BINGO等其他的富集结果。Nodes代表基因集,edge代表每个set间的重叠。这种方式呈现的话,高度冗余的基因集会被划为一组叫clusters,这样就大大增强了导航和解释富集结果的准确性。基因富集是一种数据分析技术,需要有一下2个输入。
1.一个从基因组实验来的排列的基因列表
2.基因集,依据先验知识来的已经归类的功能基因集(如GO)或实验数据(如共表达模型)。
有了以上的输入,那么会输出一个基因集富集列表。也就是能更好的概况基因列表的基因集。通常gene-set enrichment 指的的功能富集,因为指定的功能基因集(如GO)是基于功能范畴的。如下图。
快速使用手册
生成EM(以下Enrichment Map简称为EM)
有几种选择:
加载GSEA结果
加载Generic 结果
加载David结果
加载Bingo结果
以上几种模式的唯一区别是富集列表的结构。如果要使用EM,需要以下文件
File.gmt:基因集 to gene ID
File.txt或.gct:表达谱矩阵(可选择)
File.txt或.xls(*):富集列表(s)
(*)GSEA以.xsl格式保存富集列表,这不是真正的excel文件,而是修饰过的tab-separated文本文件,EM不能加载真正的EXCEL文件。
假如你的富集结果从GSEA产生的,主要从你的结果文件夹选择正确的文件即可,如果是用其他方法产生的富集结果,那你就去看下面的Full user guide,file 格式部分,确保文件格式和EM匹配。
另外,你可以选择参数缺省。如果你想自己设置自己的参数,那还是去Full user guide的参数选择部分。
EM****的地图
1.Nodes代表基因集
2.Edge代表相互重叠部分
3.富集显著性(p-value)以node颜色密度代表
4.富集的表型以node的颜色(hub)代表
Node在标准的2分类设计中,2个表型比较(比如处理组和非处理组,颜色hue代表富集表型。比如上调和下调的基因。如果两个表型中的一个作为参考(比如未处理),另外一个表型是感兴趣的。在这样的case中,在感兴趣的表型中富集意味up,在对照表表型中富集意味这down
5.Node size代表这个基因集中基因的数目。
探索****EM
1.窗口右边的results panel 的参数tab包含一些说明,比如表型颜色,还展示产生map的参数(比如cut-off值和data files)。
2.control panel面板中的左边network tab列出了当前session中所有可用的网络,底部有一个当前网络的总概,并可以方便的在网络中导航,甚至可以通过拖曳矩形框进行放大(当前窗口)。
3.点击一个node(代表一个基因集的圆圈)会打开data panel的(EM Geneset expression viewer)tab,显示选择基因集的所有基因的表达值的热图。
4.点击边(两个node之间的连线)会打开data panel的(EM overlap expression viewer)会显示被这个边连接的两个基因集中共有的所有基因的热图(也就是重叠基因)
5.如果同时选择了几个nodes和edges(可以通过拖曳感兴趣的基因集的box),那么EM geneset expression view会显示选中的基因集中的所有基因的union并且,EM overlap expression view会显示所有选中的基因集中共有的基因(也就是选中的几个基因集重叠基因)。
高级提示
1.对于大的网络和低放大水平的cytoscape会自动的减少这个细节(比如隐藏节点标签,不显示node边界0.若override(手动操作?无视?)这个策略,可以点击view-show graphics details
2.可视化地图和节点-边属性浏览会打开很多可视化选择,比如把标签大小和富集得分或p-values进行连接。这可以参考cytoscape手册
3.如果你使用的是GSEAs MSigDb,那么你可以为每个基因集获取额外的信息,方法是添加一个额外的属性(edit-preferences-properties-add-enter proterty name:nodelinkouturl.MSigDb-enter property value: http://www.broad.mit.edu/gsea/msigdb/cards/%ID%.html- make current cytoscape properties default-OK*现在你可以在一个node上右击选择linkout/MSigDb
在浏览器打开这个node代表的基因集。
4.当家长GSEA结果时,无序定义每个file。使用GSEA RPT文件就自动包含了EM界面所有的file。(具体在下面5的下面)
5.你可以在一开始定义更为宽松的p-value,q-value和系数阈值,也可以在网络产生之后来调整他们,这个操作在结果面板的右边。
RPT files
1.GSEA结果的一个特殊的trick,在任何的GSEA分析中,会产生一个rpt文件,这个文件定义了所有文件的位置(包括gmt,gct,result文件,phenotype specification,rank files)
2.dataset tab(expression,enrichment results1 or enrichment result 2)下的任何fields都可以识别rpt文件,并且populate(进入)GMT,Expression,enrichment results1,enrichment results2,phenotypes,和ranks the values)。
3.第二个rpt文件可以从dataset2加载。如果定义的GMT文件和dataset1的文件不同,会产生一个警告,你可以选择使用dataset1的GMT,dataset2的GMT,或放弃第二个rpt的加载。
4.rpt文件是一个text文件,有下面的信息(用”’’”围绕的参数是EM使用的)。
EDB files(GSEAfile****类型)
GSEA结果文件夹中有一个edb文件夹。里面有下面几个文件
1.result.edb
2.gene-sets.gmt
3.classfile.cls(只在GSEA分析,不在GSEAPreranked分析)
4.rankfile.rnk
5.如果在dataset tab(expression,enrichmentent results1或enrichment results2)定义了results.edb文件,那么gmt和enrichment 文件区域会自动加载。
6.if你想把表达谱文件加到分析中,那得需要手动加载。
高级设置-****额外文件
每个dataset,用户还可以设置额外的参数文件(但不是必须的)
这些高级参数包括
1.ranks files 定义分析中基因的ranks
这个文件有固定的格式,上面也说过了。Gene tab rank(得分)。RNK文件是GSEA文件类型。和GCT,TXT文件完全不同。它只有包含基因名字和rank(或得分)。第一行包含列文件名(比如,gene name(-tab)rank name
RANK文件的每一行包含name(--tab--)rank (or score)
参数
Node参数
1.node筛选出现在EM中的基因集
2.若在EM中出现,那么基因集许通过p-value和q-value阈值
p-value
所有小于p-value阈值的基因集都会在EM中出现
FDR Q-VALUE
所有在限定的q-value阈值之下的基因集都会在EM中出现。
根据分析类型,FDR Q-value用于EM过滤基因集的标准不一样
GSEA:使用的是gsea-result文件的第八列,名为FDR q-value
Generic:generic结果文件的第四列
David:davide结果文件的低12列,名为“Benjamini“
Bingo:Bingo结果文件的第三列,名为“core p-value”
Edge参数 (gene集关系)
1.一个边代表存在的两个基因集A和B的基因重叠程度
2.edge定义EM中边的数目Edge specific parameters control the number of edges that are created in the enrichment map
3.过滤边只能选择一种系数type(coefficient type)
参数选择的tips
P-value和FDR阈值
GSEA可以使用两种不同的显著性评估:基因集permutation和phenotype permutation。Gene-set permutation用于GM应用例子
Gene-set permutation
下面是你可以考虑的gene-set permutation的不同设置阈值
Very permissive(p-value<0.05,FDR<0.25)
Moderately permissive(p-value<0.01,FDR<0.1)
Moderately conservative(p-value<0.075,FDR<0.075)
Conservative(p-value<0.001,FDR<0.05)
为了获取更高的质量,高覆盖范围的转录组数据,以非常保守的阈值进行富集的基因集数目通常在100-250之间,(使用gene-set permutation)
phenotype permutation
推荐 p-value<0.05,FDR<0.25
总体,只有你很难发现富集的基因集,我们才推荐使用permissive 阈值。
Jaccard vs Overlap coefficient
1.选择overlap系数:发生重叠的基因集发生在large size和small size之间,比如GO条目
2.选择Jaccard系数:和上面相反,比如两个基因集含的基因数差不多
3. When the gene-sets are about the same size, Jaccard is about the half of the Overlap Coefficient for gene-set pairs with a small intersection, whereas it is about the same as the Overlap Coefficient for gene-sets with large intersections.
4.特殊情况,当使用OC时,如果产生的map有几个大的基因集过分的和很多其他基因集发生连接,这是可以转向JC
Overlap阈值
大多数的分析推荐使用0.5,一个相对moderately conservative阈值
0.3更加permissive,可能会导致一个混乱的map
Jaccard阈值
0.5非常保守
0.25moderately 保守
界面
输入面板
1.分析类型Analysis Type
GSEA: 接受GSEA的结果文件。文件格式对GSEA的文件十分友好。这个类型和generic的最大区别是富集结果文件的数目和格式。GSEA分析总是有2个富集结果文件,分别是两个相比较的表型文件对应的结果文件,也就是一个表型文件一个。
Generic:接受和GSEA分析结果一样的文件格式,就是富集结果文件不一样。并且,它就一个富集文件。Enrichment Map User guid
DAVID: 没有gmt或表达谱文件,接受DAVIDE来的富集文件
2.基因集
描述基因集的 gmt 格式文件。用户可以通过硬盘上的文件加载
3.Dataset1:用户可以指定表达谱或富集文件,或者一个 rpt 文件,这个rpt文件可以加载所有的genesets,dataset1,2,和高级部分。
4.Advanced:初始状态是隐藏的,这可以通过点击右边的小箭头展开。用户可以修饰表型标签或加载基因rank文件
5.参数:用户可以指定p-value,FDR和OC或JC值。
6Actions:user有三种选择,reset(清除所有输入),close(关闭输入面板),build enrichment map(执行)
Data面板(位于底部)
有2中不同的展示窗口,每一个都是单独的数据面板。EM overlap和EM gene set。这两种表达方式的差异仅仅是基因列表的差异。
1.EM overlap expression viewer显示所有算则的基因集之间的重叠基因的表达(交集)
2.EM geneset expression viewer显示选择的基因集的所有合并的基因表达情况(并集)
3.标准化
Data as is-代表载入的数据
Row Normalize Data-每一行的表达值的平均值跟随SD
Log Transform Data-每个表达值的log值
4.sorting
Hierarchical cluster-根据整个表达set的皮尔逊相关系数计算
如果rank文件被提供,会显示Dataset 1ranking和dataset 2 ranking,通过选择,用户可以相应的对表达谱排序
如果表达值没有相应的rank,那么热途中不会出现表达值
Add ranking运行用户上传额外的rank文件(格式要正确)对rank文件的大小没有限制。但用户需要对rank文件提供一个名字。
5.save expression set
在展示的窗口,用户可以保存表达值成txt 文件(当前展示的)*
6.输出表达set(PDF)
用户可以储存当前展示的表达热图成pdf文件。不幸的是这个PDF文件不完美。列的名字在底部而不是在上部。这个问题希望在以后的cytoscape版本解决。
results面板(位于右边)
参数pane
用户可以通过滑动块调整p值和q值
1.phenotype1
2phenotype2
3.p-value cutoff向左移降低p****值,会导致网络中node和相应的边减少;向右移会重新建立新node和相应的边。注意的是,建立网络的时候定义的p值不能增加。
4.Q-value cutoff向左移,降低q值,导致node和相应边在网络中移除;向右移重建。同p值,不能大于建网时的q值。
5.相似性cutoff向右移,增加阈值,导致边被移除,向左移,重建新边。不能小于建网时定义的值。
6.在浏览器加载GSEA结果
7.建立EM时的参数列表
8.热图自动聚焦默认是选中的。当你选中网络中的任何node和edge,EM自动更新表达视图。
9.default sorting order在表达视图gene可以根据等级聚类,rank,columns进行sort或不sort。
10.default distance metric对于等级聚类有三种可选择的distance metrics来计算基因之间的距离。默认是皮尔逊相关系数。如果你想使用其他的方法,重新选择就可以。
User Guide for ILProtector
Usually,the Non-open program with .net will have some important code and some sensitive information, we did not want to open them to others,as we know, it’s very easy to reverse the .net program exe and dll file, so we have to encrypt our program to avoid being reversed.
I have tried all kind of obfuscation tools,they always have some issues,for example:
1.Always show some source code after obfuscation.
2.Can not be executed after obfuscation.
3.The obfuscated DLL can be used,but the program with obfuscated DLL can not be debuged on IDE tool like Visual Studio.
4.many antivirus software will recognize the obfuscated exe or dll file as a virus.
So we decide to find a satisfying software,we found the ILProtector, it solved all these issues perfectly , it is easy to use also,we highly recommend it. The official website is: http://vgrsoft.net/
We will use a simple example to demonstrate the obfuscation effect and operation instructions.
Firstly, we will show the obfuscation effect:
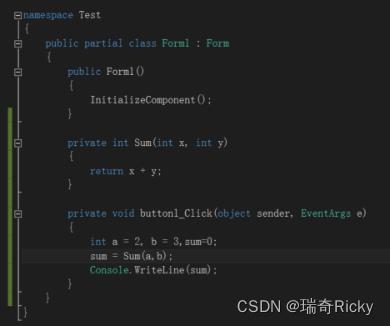
1.Here is source code:

We defined the Sum( int x , int y) and button_Click(object sender , EventArgs e) function and compare the confusion effect before and after the confusion.
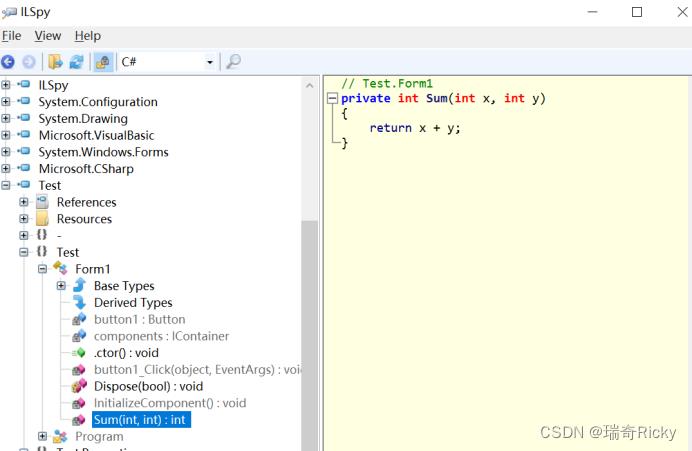
2.Reverse the exe file before confusion :


Obviously, the reverse code ( Sum( int , int ) and buuton1_Click( object , EventArgs) function) is same with source code.
3.Reverse the exe file after confusionwith ILProtector:


The code (Sum( int, int ) and buuton1_Click( object, EventArgs) function) is completely unreadable after confusion.
Now, we will show how to confuse your exe via ILProtector software step by step, the steps for dll file is same:
1.Download ILProtector from website and install it.

Introduction:
ILProtector is a protector for .NET applications. ILProtector is designed to protect intellectual property of the software.
ILProtector allows to protect your .NET code quickly and without distractions on routine tasks.
Confusion theory:
ILProtector will switch the intermediary language MSIL from .net applications to special code, so the other software can not reverse it.
ILProtector support the .net 2.0, 3.0, 3.5, 4, 4.5, 4.5.1, 4.5.2, 4.6, 4.6.1, 4.6.2, 4.7, 4.7.1, 4.7.2, 4.8.
ILProtector support 32bit or 64bit windows system.
ILProtector support String encryption and Integrity checking.
2.Drag your exe or dll file to the “Assemblies” dialog box under “Project”

Firstly,Drag file to Assemblies.
Then set the output folder.
3.Right-click the file, click “Properties”, and set “EnableIntegrity” and “EncryptStrings” to True

Notes:
EnableIntegrity:
It will check the integrality of your program,it can not be executed when the program was modified unexpectedly.
EncryptStrings:
It will encrypt the string variables in your program if you set it to True.
For other options, you can check the corresponding tips.
4.Select the “Protection” to embed the protection code in the exe or dll file and click “Save”

Notes:
Inherit form ILProtector options
It menas you can also put the protection code to independent dll file, it will out put the exe and dll file with two extra dll files.
5.Finally, click “Process” to output the confused exe or dll file.

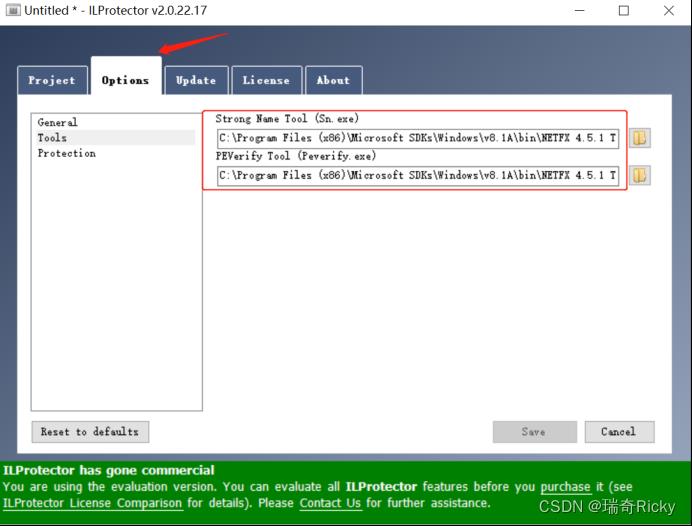
6.If you meet some error and can not output the confused file, maybe you can check the IDE location in “Options”

以上是关于Enrichment Map User guide用户指南的主要内容,如果未能解决你的问题,请参考以下文章