需要在WPF中绘制曲线图,请问使用哪种控件比较好
Posted
tags:
篇首语:本文由小常识网(cha138.com)小编为大家整理,主要介绍了需要在WPF中绘制曲线图,请问使用哪种控件比较好相关的知识,希望对你有一定的参考价值。
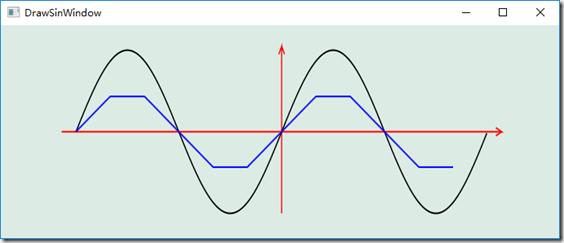
WPF的toolkit里有自带的chart控件的。如果你只想做些简单的图表展示就够了。如果你要有很好的用户体验和比较多的图表设置,可以使用第三方控件中的Chart。推荐Visifire的Chart控件,它家是专门做wpf,silverlight,wp的图表控件的。希望对你的回答有帮助。 参考技术A 正在用ComponentOne的Chart,我也没具体测过,据说只能对付两万个点,多了就很慢很慢。 VisiFire我也用过几天,据客服说1万个点要用9-10秒。 我是新手不知道说得对不对,目前感觉这两个都是胜在灵活性,同一个图里可以同时画不同类型的图,比如...补充如何在WPF中绘制正弦曲线
分类:C#、VS2015
创建日期:2016-06-19
使用教材:(十二五国家级规划教材)《C#程序设计及应用教程》(第3版)
一、要点
本例子提前使用了教材第13章介绍的基本知识。
二、设计步骤
1、新建一个名为MyTest1的WPF应用程序项目。
2、将MainWindow.xaml改为下面的内容。
<Window x:Class="MyTest1.MainWindow"
        xmlns="http://schemas.microsoft.com/winfx/2006/xaml/presentation"
        xmlns:x="http://schemas.microsoft.com/winfx/2006/xaml"
        xmlns:d="http://schemas.microsoft.com/expression/blend/2008"
        xmlns:mc="http://schemas.openxmlformats.org/markup-compatibility/2006"
        xmlns:local="clr-namespace:MyTest1"
        mc:Ignorable="d"
        Title="DrawSinWindow" Height="300" Width="700" Background="#FFDCECE5">
    <Window.Resources>
        <Style TargetType="Path">
            <Setter Property="StrokeThickness" Value="2" />
            <Setter Property="RenderTransform">
                <Setter.Value>
                    <TransformGroup>
                        <TranslateTransform X="360" Y="-110" />
                        <ScaleTransform ScaleY="-1" ScaleX="0.7" />
                    </TransformGroup>
                </Setter.Value>
            </Setter>
        </Style>
    </Window.Resources>
    <Canvas Name="canvas1" Width="500" Height="220" Margin="20">
        <!--绘制坐标轴-->
        <Path Name="path1" Stroke="Red"
              Data="M-385,0 L385,0 375 5 M385,0 L375,-5
                    M0,-100 L0,105 -5,95 M0,105 L5,95">
        </Path>
        <!--绘制正弦曲线-->
        <Path Name="path2" Stroke="Black"/>
        <Path Name="path3" Stroke="Blue"/>
    </Canvas>
</Window>
3、将MainWindow.xaml.cs改为下面的内容。
using System;
using System.Windows;
using System.Windows.Media;

namespace MyTest1
{
    public partial class MainWindow : Window
    {
        public MainWindow()
        {
            InitializeComponent();

            GeometryGroup group1 = new GeometryGroup();
            var g1 = GetSinGeometry(1, 100);
            group1.Children.Add(g1);
            path2.Data = group1;

            GeometryGroup group2 = new GeometryGroup();
            var g2 = GetSinGeometry(60, 50);
            group2.Children.Add(g2);
            path3.Data = group2;
        }

        public StreamGeometry GetSinGeometry(int dx, int dy)
        {
            StreamGeometry g = new StreamGeometry();
            using (StreamGeometryContext ctx = g.Open())
            {
                int x0 = 360;
                double y0 = Math.Sin(-x0 * Math.PI / 180.0);
                ctx.BeginFigure(new Point(-x0, dy * y0), false, false);
                for (int x = -x0; x < x0; x += dx)
                {
                    double y = Math.Sin(x * Math.PI / 180.0);
                    ctx.LineTo(new Point(x, dy * y), true, true);
                }
            }
            g.Freeze();
            return g;
        }
    }
}
4、按<F5>键调试运行,就会看到下面的结果:

以上是关于需要在WPF中绘制曲线图,请问使用哪种控件比较好的主要内容,如果未能解决你的问题,请参考以下文章