python学习笔记
Posted 小琳子要开心呀
tags:
篇首语:本文由小常识网(cha138.com)小编为大家整理,主要介绍了python学习笔记相关的知识,希望对你有一定的参考价值。
个人学习python过程中的记录,仅供个人查阅。
python学习笔记
- 应用
- 画图(matplotlib)
- 常见报错
- SettingWithCopyWarning:A value is trying to be set on a copy of a slice from a DataFrame(Pandas库)
应用
打印变量和字符串(使用变量和字符串给文件名命名)
# 1. 使用f-string语法(这个比较直观, 推荐使用)
# 直接在需要添加变量的位置添加大括号和变量名, 最后在引号前面加上f
name = 'tem.txt'
print(f'D:\\test\\name')
file = open(f'D:\\test\\name')
# 2. 使用转换说明符(占位符),需要用表示字符串类型的%s或者%r
name = ’tem.txt’
print(f'D:\\test\\%s'%name)
file = open(’D:\\test\\%s’%name)
保留指定小数点位数
需要将多个数值都保留两位小数打印
使用round()不行, 不支持列表,元组等格式
- np.round()可以, 支持将列表元组等
import numpy as np
print(np.round([z_95, z_99, z_995, z_999, z_max, z_95_mean], 2))
-
字符串和数字打印样式可以参考下面的教程
https://blog.csdn.net/qq_17576739/article/details/120720019
(Python 格式化输出保留两位小数)%s : 字符串
%d :十进制整数
%f : 浮点型, %.3f: 保留三位小数
%x : 十六进制指定长度:
%5d 右对齐,不足左边补空格
%-5d - 代表左对齐,不足右边默认补空格
%05d 右对齐,不足左边补0浮点数:
%f
默认是输出6位有效数据, 会进行四舍五入
指定小数点位数的输出 %.2f—保留小数点后2位
‘%4.8f’
4代表整个浮点数的长度,包括小数,只有当字符串的长度大于4位才起作用.不足4位空格补足,可以用%04.8使用0补足空格
#方法1:
print("%.2f" % 0.13333)
#方法2
print(":.2f".format(0.13333))
#方法3
round(0.13333, 2)
计算百分位
np.percentile(a, q, axis=None, out=None, overwrite_input=False, interpolation=‘linear’, keepdims=False)
- a : array,用来算分位数的对象,可以是多维的数组
- q : 介于0-100的float,用来计算是几分位的参数,如四分之一位就是25,如要算两个位置的数就(25,75)
- axis : 坐标轴的方向,一维的就不用考虑了,多维的就用这个调整计算的维度方向,取值范围0/1
- out : 输出数据的存放对象,参数要与预期输出有相同的形状和缓冲区长度
- overwrite_input : bool,默认False,为True时及计算直接在数组内存计算,计算后原数组无法保存
- interpolation : 取值范围‘linear’, ‘lower’, ‘higher’, ‘midpoint’, ‘nearest’
默认liner,比如取中位数,但是中位数有两个数字6和7,选不同参数来调整输出 - keepdims : bool,默认False,为真时取中位数的那个轴将保留在结果中
import numpy as np
a = np.array([[6,10,11],[3,2,12]])
print(a)
print(np.percentile(a, [0,25,50,75,100]))
# [ 2.    3.75  8.   10.75 12.  ]
# 线性插值法计算百分位数

a = np.array([[10,7,4],[3,2,1]])
np.percentile(a, 50, axis=0) # 对行  array([6.5, 4.5, 2.5])
np.percentile(a, 50, axis=1) # 对列  array([7., 2.])
np.percentile(a, 50, axis=1, keepdims=True) # 保持维度不变
'''
array([[7.],
       [2.]])
'''
 - 不过针对不同的数据类型使用相应的函数, 速度会更快一点
针对DataFrame数据的复制可以使用 pd.DataFrame(data, copy=True)函数
d2 = pd.DataFrame(d1, copy=True)
```python
import pandas as pd
d1 = pd.DataFrame([[1,2,3], [4,5,6]])
d2 = pd.DataFrame(d1, copy=True)
d2[1,1] = 100
print(d1)
print(d2)
创建DataFrame格式数据
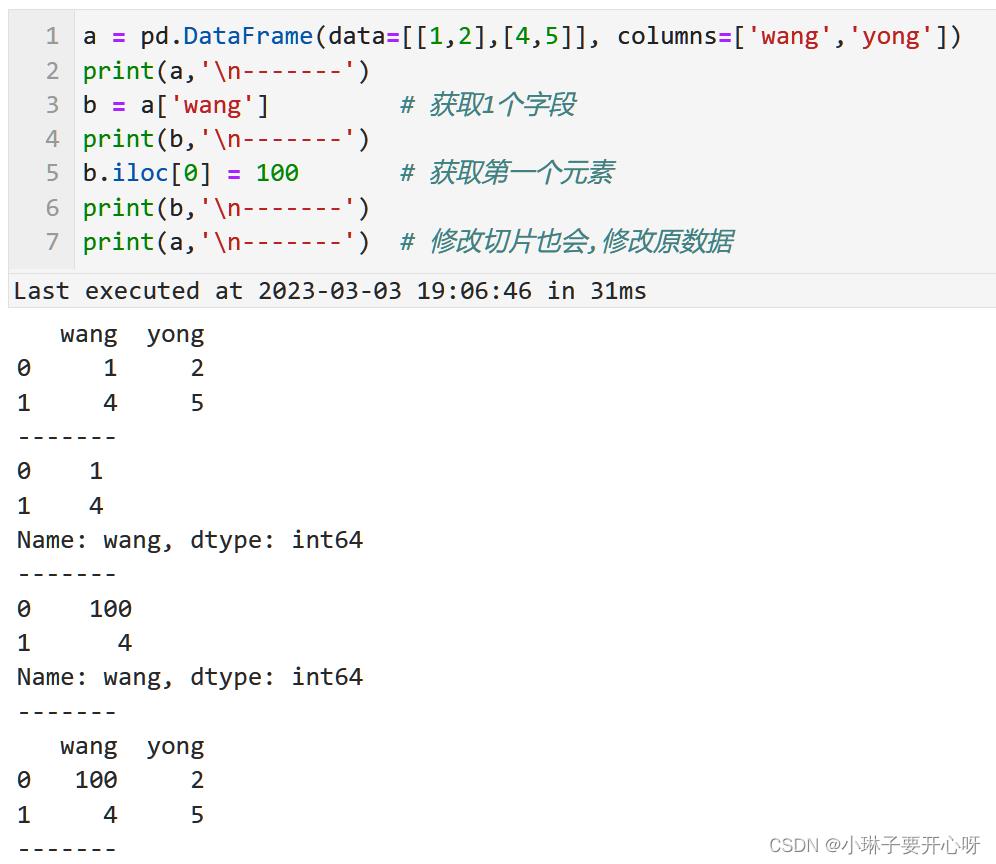
小心切片会改变原数据
注意:
使用切片或者等号(=)从数据框获取的数据框或者series, 如果发生修改会影响原数据.
可以使用copy库中的 .deepcopy() 函数进行深拷贝
或者使用python自带的 .copy()函数进行浅拷贝

复制数据
copy库有copy()和deepcopy()函数
- copy()是浅拷贝, 只拷贝一层, 有嵌套的慎用, .copy()函数可以不用导入copy库, python自带
- deepcopy()是深拷贝, 创建新的存储,需要导入copy库
两者详细区别可参考下面博文链接
https://blog.csdn.net/weixin_50829653/article/details/127675849
inport copy
d1 = [1,2,3]
d2 = copy.deepcopy(d1)
d2[1] = 100
print(d1)
print(d2)

# [1, 2, 3]
# [1, 100, 3]
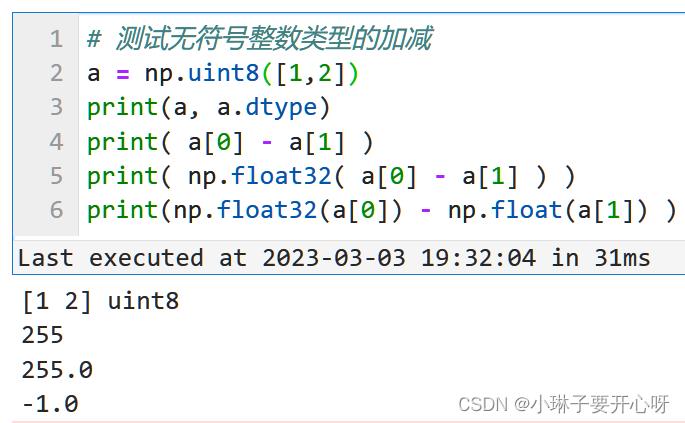
科学计算前要修改为浮点类型
遇到的问题:
无符号整数类型的(uint8)的两个数相减,结果就算是负数, 也会被uint8数据类型改为正负,
想要得到正确的计算结果, 需要先将数据格式转换为float, 再进行科学计算.

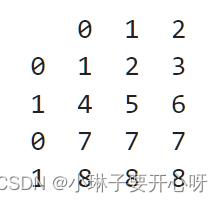
DataFrame格式数据拼接
拼接两个DataFrame
d = pd.concat([d1, d2])
import pandas as pd
d1 = pd.DataFrame([[1,2,3], [4,5,6]])
d2 = pd.DataFrame([[7,7,7], [8,8,8]])
d = pd.concat([d1, d2])
print(d)

DataFrame格式数据处理
DataFrame删除指定列
# 删除"ndvi"这一列,并且覆盖源数据
data.drop(columns = 'ndvi', inplace = True)
读取文件夹内某一后缀的所有文件
import glob
import os
path = "C:\\\\Users\\\\Dell\\\\Desktop\\\\"
file_path = glob.glob(os.path.join(path, '*.txt'))  # 读取指定后缀的文件名, 是绝对路径
# file_path = glob.glob(path + '*.txt')             # 使用+号的方法

print(file_path[0].split("\\\\")[-1])     # 去掉第一个文件的路径只提取文件名
print(os.path.basename(path_i))         # 使用函数的方法, 去掉第一个文件的路径只提取文件名

file_name = os.listdir(path))           # 读取指定目录下的所有文件名, 不带路径的所有文件名
print(os.path.splitext(file_name[0])[0])     # 将文件名分离为名称和后缀
将字符串按照指定位数用0在前面补全
.zfill(6)
str = ["1name","11name"]
for i in str:
    print(i, len(i))              # 读取字符串长度
print(str[0].zfill(6))            # 在左用0补齐
# -->
# 1name 5
# 11name 6
# 01name
#-->
数据类型转换
- padans的dataframe列数据格式转换
方法一
pandas.to_numeric(arg, errors=‘raise’, downcast=None)
将参数arg转为numpy数值类型
- arg:需要被转换的参数;
- errors:默认’raise’,处理错误的方式,可选‘ignore’, ‘raise’, ‘coerce’;
‘ignore’:无效的转换将返回输入;
‘raise’:无效的转换将引发异常;
‘coerce’:无效的转换将设为NaN; - downcast:默认None, 可选‘integer’, ‘signed’, ‘unsigned’, ‘float’;
如果不是None,并且数据已成功转换为数字数据类型,则根据一定规则将结果数据向下转换为可能的最小数字数据类型;
‘integer’ 或 ‘signed’: 最小的有符号整型(numpy.int8);
‘unsigned’: 最小的无符号整型(numpy.uint8);
‘float’: 最小的浮点型(numpy.float32);
方法二
(不知道为啥方法1总是不成功, 所有找到方法二)
使用函数 df.astype(‘float32’,errors=‘raise’)
df.astype('float32',errors='raise').dtypes    # 转换整个数据框
df[['red', 'green']].astype('float32', errors='raise').dtypes  # 转换整数据框里面的某些字段
df.astype('red':'float32', 'green':'int16' errors='raise').dtypes  # 转换整数据框里面的某些字段
python自带函数的数据格式转换
int(x [,base ]) 将x转换为一个整数
long(x [,base ]) 将x转换为一个长整数
float(x ) 将x转换到一个浮点数
complex(real [,imag ]) 创建一个复数
str(x ) 将对象 x 转换为字符串
repr(x ) 将对象 x 转换为表达式字符串
eval(str ) 用来计算在字符串中的有效Python表达式,并返回一个对象
tuple(s ) 将序列 s 转换为一个元组
list(s ) 将序列 s 转换为一个列表
chr(x ) 将一个整数转换为一个字符
unichr(x ) 将一个整数转换为Unicode字符
ord(x ) 将一个字符转换为它的整数值
hex(x ) 将一个整数转换为一个十六进制字符串
oct(x ) 将一个整数转换为一个八进制字符串
科学计算
- 除法取整
//
7//4 # 1 - 除法取余
- %
7%4 # 3

画图(matplotlib)
导入库
import matplotlib.pyplot as plt
设置可以显示中文
plt.rcParams[‘font.sans-serif’] = [‘SimHei’]
- 详细的设置可以参考下面的教程
https://blog.csdn.net/qq_43797817/article/details/125142325
(Python:WIN10解决matplotlib画图中显示中文宋体英文TimesNewRoman问题)
设置figure尺寸和axis的边界
fig = plt.figure( figsize=(4,3) )
ax = fig.add_axes([0.15,0.15,0.8,0.80])
ax.hist(data)
ax.set_title('title')
ax.xlabel('xlabel')
ax.ylabel('ylabel')
plt.show()
添加文本
- annotate() 使用绝对位置
plt.annotate(“z_max”, xy=(800, 12000),xytext=(700, 12000)) - text() 使用绝对位置
plt.text(800, 12000, “z_max”) - figtext() 使用相对位置
- plt.figtext(0.9, 1, “z_max”)
添加横竖线
- axvline() 添加竖线
plt.axvline(800, color=‘r’) - axvline() 添加横线
plt.axhline(800, c=‘r’, ls=‘–’, lw=2)
画子图(plt.subplots)
fig, axes = plt.subplots(nrows=2, ncols=3, figsize=(15,4))
axes[0][0].hist(pc_unit1.red, range=(0,150), bins=50)
axes[0][0].set_title(“red”)
axes[1][0].hist(pc_new.red, range=(0,150), bins=50)
axes[1][0].set_title(“red_new”)
axes[0][1].hist(pc_unit1.green, range=(0,150), bins=50)
axes[0][1].set_title(“green”)
axes[1][1].hist(pc_new.green, range=(0,150), bins=50)
axes[1][1].set_title(“green_new”)
axes[0][2].hist(pc_unit1.blue, range=(0,150), bins=50)
axes[0][2].set_title(“blue”)
axes[1][2].hist(pc_new.blue, range=(0,150), bins=50)
axes[1][2].set_title(“blue_new”)
调整子图的间距
plt.subplots_adjust(left=None,bottom=None,right=None,top=None,wspace=0.2,hspace=0.25)
# left : float, optional,The position of the left edge of the subplots, as a fraction of the figure width.
# right : float, optional,The position of the right edge of the subplots, as a fraction of the figure width.
#bottom : float, optional The position of the bottom edge of the subplots, as a fraction of the figure height.
# top : float, optional,The position of the top edge of the subplots,    as a fraction of the figure height.
# wspace : float, optional,The width of the padding between subplots,    as a fraction of the average Axes width.
# hspace : float, optional,The height of the padding between subplots,    as a fraction of the average Axes height.
画箱线图(plt.boxplot)
plt.figure( figsize = (5,4) )
plt.boxplot(x, labels=[‘top’, ‘mid’, ‘bot’])
- x :绘图数据。
- notch :是否以凹口的形式展现箱线图,默认非凹口。
- sym:指定异常点的形状,默认为+号显示。
- vert :是否需要将箱线图垂直放,默认垂直放。
- whis :指定上下须与上下四分位的距离,默认为1.5倍的四分位差。
- positions :指定箱线图位置,默认为[0,1,2.…]。
- widths :指定箱线图宽度,默认为0.5。
- patch _ artist :是否填充箱体的颜色。
- meanline :是否用线的形式表示均值,默认用点表示。
- showmeans :是否显示均值,默认不显示。
- showcaps :是否显示箱线图顶端和末端两条线,默认显示。
- showbox :是否显示箱线图的箱体,默认显示。
- showfliers :是否显示异常值,默认显示。
- boxprops :设置箱体的属性,如边框色、填充色等。
- labels :为箱线图添加标签,类似于图例的作用。
- filerprops :设置异常值的属性,如异常点的形状、大小、填充色等。
- medianprops :设置中位数的属性,如线的类型、粗细等。
- meanprops :设置均值的属性,如点的大小、颜色等。
- capprops :设置箱线图顶端和末端线条的属性,如颜色、粗细等。
- whiskerprops :设置须的属性,如颜色、粗细、线的类型等。
画直方图(plt.hist)
matplotlib.pyplot.hist(x, bins=None, density=None,……kwargs*)
- bins: 指定bin(箱子)的个数。例如(bins=10)
- color: 设置箱子颜色。例如(color=‘r’)
- normed: 设置箱子密度。例如(normed=1)
- alpha: 设置透明度。例如(alpha=0.5)
- range: 设置x轴的范围。例如(range=(0,100))
- bottom: 设置y轴起始范围。例如(bottom=100)
- histtype:箱子类型。“bar”: 方形,“barstacked”: 柱形,“step”: “未填充线条”,“stepfilled”: “填充线条”。
- align:对齐方式。 “left”: 左,“mid”: 中间,“right”: 右。
- orientation 箱子方向。“horizontal”: 水平,“vertical”: 垂直。
- log,单位是否以科学计术法,bool。
常见报错
SettingWithCopyWarning:A value is trying to be set on a copy of a slice from a DataFrame(Pandas库)
推荐看下面的博客, 写的很清楚.
- https://blog.csdn.net/Fwuyi/article/details/123519659
(SettingWithCopyWarning:A value is trying to be set on a copy of a slice from a DataFrame(Pandas库))
解决方案有两种
- 使用链式索引赋值会报错(使用多个中括号[ ][ ]提取dataframe数据)
推荐使用.loc和.iloc - 使用.loc和.iloc获取切片, 之后再对切片赋值, 也会报错
推荐在切片后面增加 .copy() 明确表示进行复制,不再是原dataframe的切片视图
[Python] Python 学习笔记
Python 学习笔记
安装包
在 CMD 中输入:
pip install matplotlib
python -m pip install matplotlib
以上是关于python学习笔记的主要内容,如果未能解决你的问题,请参考以下文章