Elasticsearch学习3-集群访问
Posted Huazie
tags:
篇首语:本文由小常识网(cha138.com)小编为大家整理,主要介绍了Elasticsearch学习3-集群访问相关的知识,希望对你有一定的参考价值。
集群访问
原文请查看 Exploring Your Cluster
上篇博文《Elasticsearch学习2-安装介绍》 中,我们了解了 Elasticsearch 的安装,并在一个集群中成功启动了我们一个的节点。
现在(既然)我们已经启动并运行了节点(和集群),(那)下一步就是了解如何与之通信。好在 Elasticsearch 提供了一个非常全面和强大的 REST API,你可以使用它与集群进行交互。使用 API 可以完成以下几件事情:
-
检查集群、节点和索引的运行状况、状态和统计信息
-
管理集群、节点、索引数据和元数据
-
对索引执行 CRUD(创建、读取、更新和删除)和搜索操作
-
执行高级搜索操作,如分页、排序、筛选、脚本、聚合等
Now that we have our node (and cluster) up and running, the next step is to understand how to communicate with it. Fortunately, Elasticsearch provides a very comprehensive and powerful REST API that you can use to interact with your cluster. Among the few things that can be done with the API are as follows:
- Check your cluster, node, and index health, status, and statistics
- Administer your cluster, node, and index data and metadata
- Perform CRUD (Create, Read, Update, and Delete) and search operations against your indexes
- Execute advanced search operations such as paging, sorting, filtering, scripting, aggregations, and many others
集群运行状况
(首先)让我们从最基础的健康检查开始,我们可以使用它来查看集群的运行状况。(下面)我们将使用 curl 来操作它(集群的健康检查),但也可以使用任何允许我们进行HTTP/REST 调用的工具。(这里)让我们假设我们仍然处于同一个 Elasticsearch 启动的节点上,并打开另一个shell 命令窗口。
Let’s start with a basic health check, which we can use to see how our cluster is doing. We’ll be using curl to do this but you can use any tool that allows you to make HTTP/REST calls. Let’s assume that we are still on the same node where we started Elasticsearch on and open another command shell window.
为了检查集群运行状况,我们将使用 _cat API。
你可以在Kibana的控制台中运行下面的命令。
GET /_cat/health?v
To check the cluster health, we will be using the _cat API. You can run the command below in Kibana’s Console by clicking “VIEW IN CONSOLE” or with curl by clicking the “COPY AS CURL” link below and pasting it into a terminal.
得到(如下)响应:

我们可以看到,名为 "elasticsearch" 的集群处于绿色状态。
We can see that our cluster named “elasticsearch” is up with a green status.
每当我们询问集群健康状况时,我们都会得到绿色、黄色或红色。
- 绿色 :一切正常(集群完全正常)
- 黄色 :所有数据都可用,但一些副本尚未分配(集群完全正常)
- 红色 :某些数据因其他原因不可用(集群部分运行)
Whenever we ask for the cluster health, we either get green, yellow, or red.
- Green - everything is good (cluster is fully functional)
- Yellow - all data is available but some replicas are not yet allocated (cluster is fully functional)
- Red - some data is not available for whatever reason (cluster is partially functional)
注意: 当集群为红色时,它将继续服务于可用分片的搜索请求,但由于存在未分配的分片,你可能需要尽快修复它。
Note: When a cluster is red, it will continue to serve search requests from the available shards but you will likely need to fix it ASAP since there are unassigned shards.
而且从上面的响应中,我们可以看到总共有 1 个节点,并且我们有 0 个分片,因为我们还没有数据。请注意,由于我们使用的是默认的群集名称(elasticsearch),并且 elasticsearch 默认使用单播网络发现来查找同一台计算机上的其他节点,因此你可能会意外启动计算机上的多个节点,并使它们都加入一个群集。在这种情况下,你可能会在上面的响应中看到不止一个节点。
Also from the above response, we can see a total of 1 node and that we have 0 shards since we have no data in it yet. Note that since we are using the default cluster name (elasticsearch) and since Elasticsearch uses unicast network discovery by default to find other nodes on the same machine, it is possible that you could accidentally start up more than one node on your computer and have them all join a single cluster. In this scenario, you may see more than 1 node in the above response.
我们还可以获得集群中的节点列表,如下所示:
We can also get a list of nodes in our cluster as follows:
GET /_cat/nodes?v
得到(如下)响应:

在(如上响应)这里,我们可以看到一个名为 “wfsWji9” 的节点,它是当前位于集群中的单个节点。
Here, we can see our one node named “wfsWji9”, which is the single node that is currently in our cluster.
列出所有索引
现在让我们来看看我们的索引:
Now let’s take a peek at our indices:
GET /_cat/indices?v
得到(如下)响应:
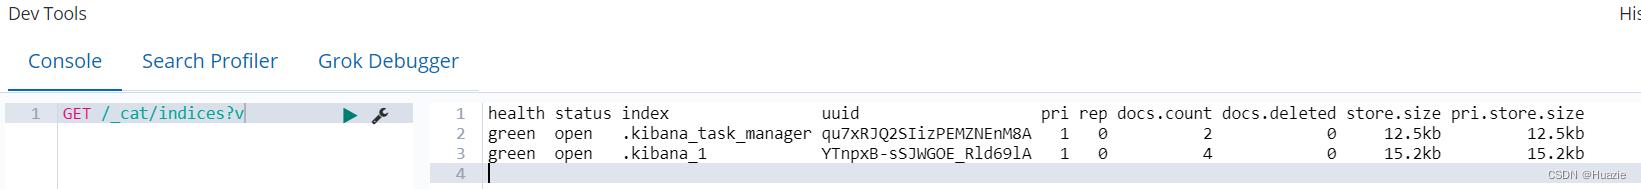
(从上面响应可知,除了 kibana 相关的索引),我们的ES集群中还没有其他索引。
创建索引
现在,让我们创建一个名为 "customer" 的索引,然后再次列出所有索引:
Now let’s create an index named “customer” and then list all the indexes again:
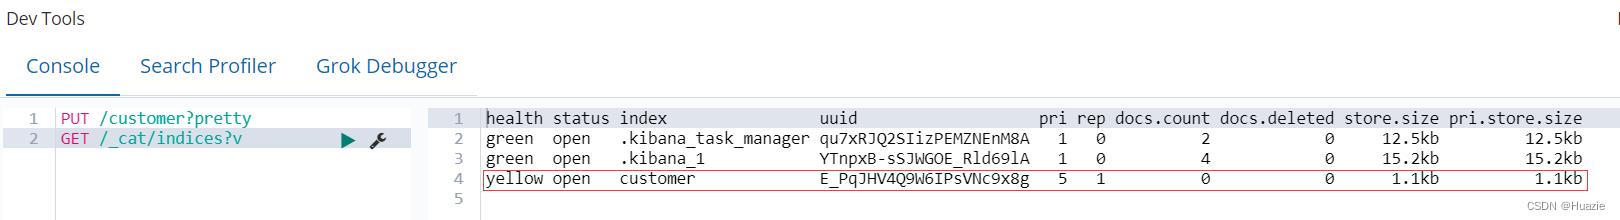
PUT /customer?pretty
GET /_cat/indices?v
得到(如下)响应:

第一个命令使用 PUT 动词创建名为 "customer" 的索引。我们只需在调用的结尾添加 pretty,告诉它(如果有可能的话)美化打印JSON响应内容。
The first command creates the index named “customer” using the PUT verb. We simply append pretty to the end of the call to tell it to pretty-print the JSON response (if any).
第二个命令的结果告诉我们,现在有一个名为 "customer" 的索引,它有 5 个主分片和 1 个副本(默认值),其中包含 0 个文档。
The results of the second command tells us that we now have 1 index named customer and it has 5 primary shards and 1 replica (the defaults) and it contains 0 documents in it.
(上面运行结果中)你可能还注意到,客户索引的健康状况标记为 黄色。回想我们之前的讨论,黄色表示一些副本尚未分配。这是因为Elasticsearch默认为该索引创建了一个副本。由于目前只有一个节点在运行,因此在稍后另一个节点加入集群之前,还无法分配该副本(用于高可用性)。一旦副本被分配到第二个节点,该索引的运行状况将变为绿色。
You might also notice that the customer index has a yellow health tagged to it. Recall from our previous discussion that yellow means that some replicas are not (yet) allocated. The reason this happens for this index is because Elasticsearch by default created one replica for this index. Since we only have one node running at the moment, that one replica cannot yet be allocated (for high availability) until a later point in time when another node joins the cluster. Once that replica gets allocated onto a second node, the health status for this index will turn to green.
索引和查询文档
现在,让我们在 客户索引 中添加一些内容。我们将一个简单的客户文档编入客户索引,ID为1,如下所示:
Let’s now put something into our customer index. We’ll index a simple customer document into the customer index, with an ID of 1 as follows:
PUT /customer/doc/1?pretty

  "name": "John Doe"
得到(如下)响应:

从上面的响应内容中,我们可以看到在客户索引中成功创建了一个新的客户文档。该文档还具有我们在索引时指定的内部id,它的值为1。
From the above, we can see that a new customer document was successfully created inside the customer index. The document also has an internal id of 1 which we specified at index time.
值得注意的是,Elasticsearch 并不要求你在将文档编入索引之前先明确创建索引。在前面的示例中,如果客户索引事先不存在,Elasticsearch 将自动创建客户索引。
It is important to note that Elasticsearch does not require you to explicitly create an index first before you can index documents into it. In the previous example, Elasticsearch will automatically create the customer index if it didn’t already exist beforehand.
现在,让我们检索刚刚索引的文档:
Let’s now retrieve that document that we just indexed:
GET /customer/doc/1?pretty
得到(如下)响应:
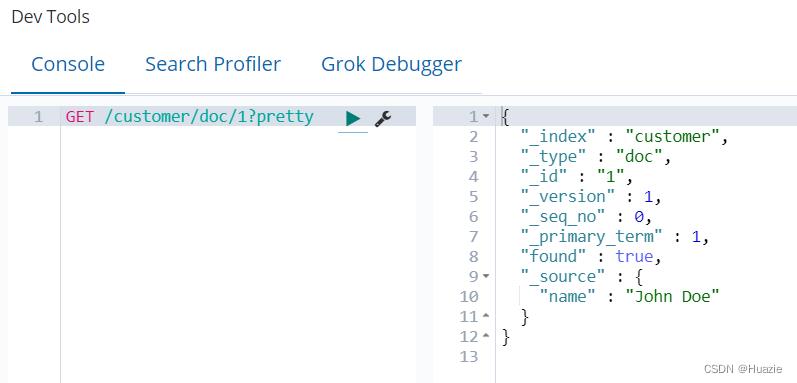
除了一个字段 found 之外,(上图)这里没有其他异常,它说明我们找到了一个 请求ID为1 的文档和另一个字段 _source,它返回了我们从上一步索引的完整 JSON 文档。
Nothing out of the ordinary here other than a field, found, stating that we found a document with the requested ID 1 and another field, _source, which returns the full JSON document that we indexed from the previous step.
删除索引
现在,让我们删除刚才创建的索引,然后再次列出所有索引:
Now let’s delete the index that we just created and then list all the indexes again:
DELETE /customer?pretty
GET /_cat/indices?v
得到(如下)响应:
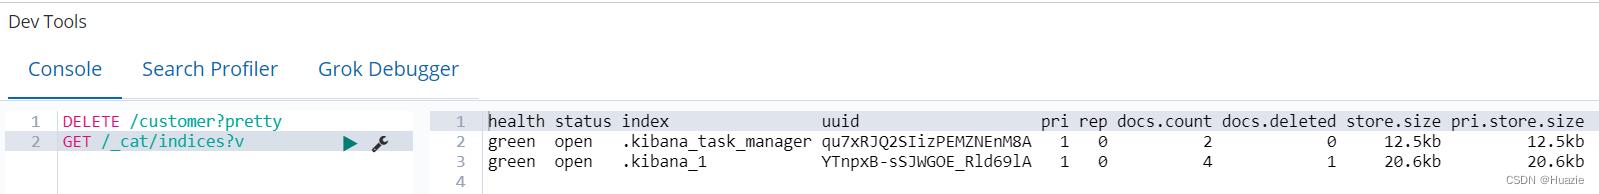
这意味着索引被成功删除,我们现在回到了最初的位置,集群中(除了 kibana 相关得索引)其他什么都没有。
Which means that the index was deleted successfully and we are now back to where we started with nothing in our cluster.
总结
在继续之前,让我们再次仔细了解一下我们迄今为止学习的一些 API 命令:
Before we move on, let’s take a closer look again at some of the API commands that we have learned so far:
PUT /customer
PUT /customer/doc/1

  "name": "John Doe"

GET /customer/doc/1
DELETE /customer
如果仔细研究上述命令,我们实际上可以看出 Elasticsearch 中访问数据的模式。这种模式可以概括如下:
If we study the above commands carefully, we can actually see a pattern of how we access data in Elasticsearch. That pattern can be summarized as follows:
<REST Verb> /<Index>/<Type>/<ID>
这种 REST 访问模式在所有 API 命令中都非常普遍,如果您能够简单地记住它,那么你将在掌握 Elasticsearch 方面有一个良好的开端。
This REST access pattern is so pervasive throughout all the API commands that if you can simply remember it, you will have a good head start at mastering Elasticsearch.
以上是关于Elasticsearch学习3-集群访问的主要内容,如果未能解决你的问题,请参考以下文章