MATLAB绘制雷达图/蜘蛛图
Posted WW、forever
tags:
篇首语:本文由小常识网(cha138.com)小编为大家整理,主要介绍了MATLAB绘制雷达图/蜘蛛图相关的知识,希望对你有一定的参考价值。
雷达图/蜘蛛图
1 方法一
函数来源为MATLAB | 如何使用MATLAB绘制雷达图(蜘蛛图)
1.1 调用函数
| 名称 | 说明 | 备注 |
|---|---|---|
| ‘Type’ | 用于指定每个轴的标签 | [‘Line’(默认)/‘Patch’] |
1.2 案例
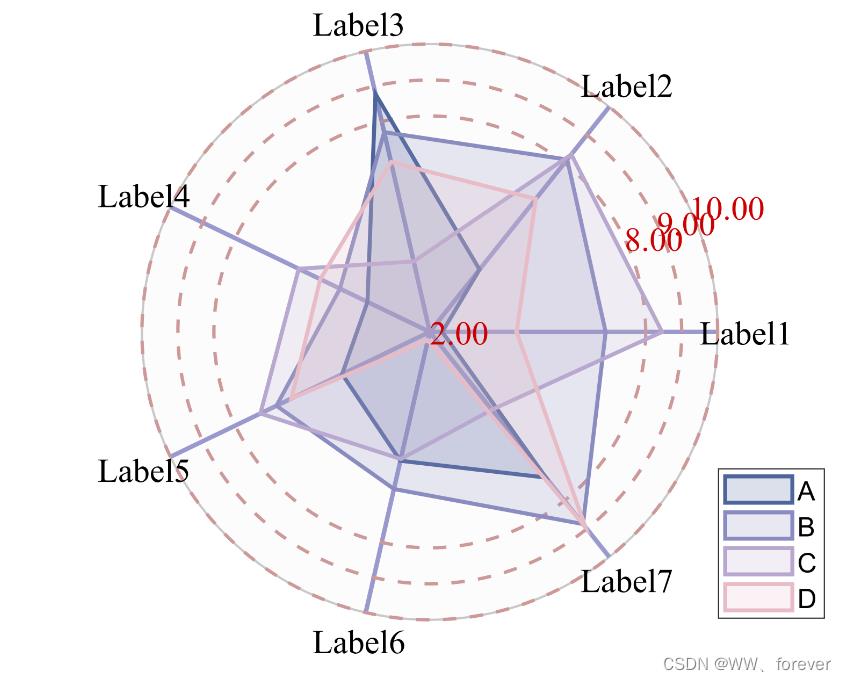
1.2.1 案例1:填充型
成图如下所示:
MATLAB实现代码如下:
clc
close all
clear
%% 导入数据
pathFigure= '.\\Figures\\' ;

%% Example 1
X = randi([2,8],[4,7])+rand([4,7]);

figure(1)
RC = radarChart(X ,'Type','Patch');
RC.RLim = [2,10];                         % 范围
RC.RTick = [2,8:1:10];                   % 刻度线
RC.PropName = 'Label1','Label2','Label3','Label4','Label5','Label6','Label7';
RC.ClassName = 'A','B','C','D';
RC = RC.draw();
RC.legend();                                 % 添加图例

colorList=[78 101 155;
          138 140 191;
          184 168 207;
          231 188 198;
          253 207 158;
          239 164 132;
          182 118 108]./255;
for n=1:RC.ClassNum
    RC.setPatchN(n,'FaceColor',colorList(n,:),'EdgeColor',colorList(n,:))
end

RC.setThetaTick('LineWidth',2,'Color',[.6,.6,.8]);          % theta轴颜色设置
RC.setRTick('LineWidth',1.5,'Color',[.8,.6,.6]);              % R轴颜色设置
RC.setPropLabel('FontSize',15,'FontName','Times New Roman','Color',[0,0,0])               % 属性标签
RC.setRLabel('FontSize',15,'FontName','Times New Roman','Color',[.8,0,0])                    % R刻度标签
% RC.setBkg('FaceColor',[0.8,0.8,0.8])                % 圆形背景颜色
% RC.setRLabel('Color','none')                           % 圆形背景颜色

str= strcat(pathFigure, "Figure1", '.tiff');
print(gcf, '-dtiff', '-r600', str);
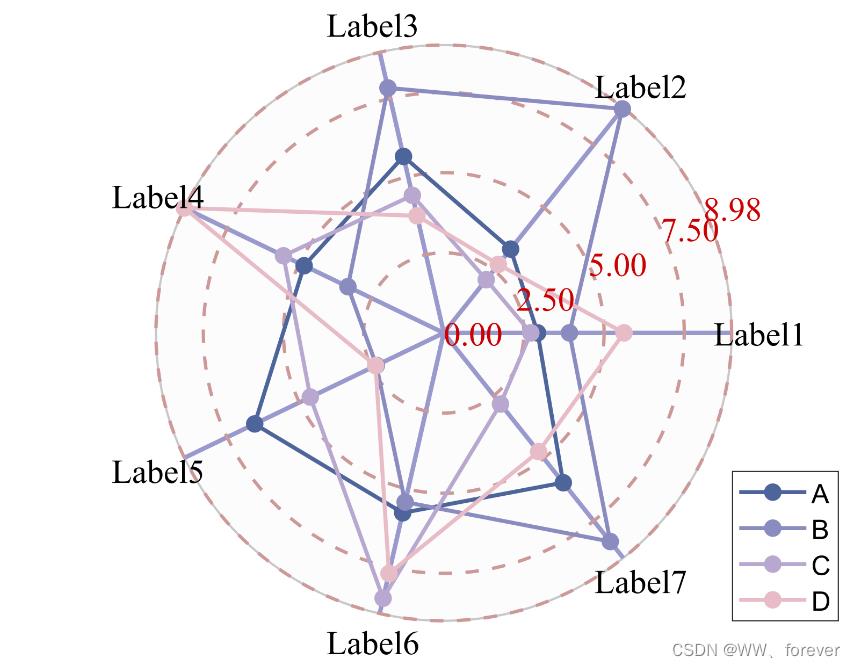
1.2.2 案例2:线型
成图如下所示:
MATLAB实现代码如下:
clc
close all
clear
%% 导入数据
pathFigure= '.\\Figures\\' ;

%% Example 2
X = randi([2,8],[4,7])+rand([4,7]);

figure(2)
RC=radarChart(X ,'Type','Line');
RC.PropName = 'Label1','Label2','Label3','Label4','Label5','Label6','Label7';
RC.ClassName = 'A','B','C','D';
RC=RC.draw();
RC.legend();

colorList=[78 101 155;
          138 140 191;
          184 168 207;
          231 188 198;
          253 207 158;
          239 164 132;
          182 118 108]./255;
for n=1:RC.ClassNum
    RC.setPatchN(n,'Color',colorList(n,:),'MarkerFaceColor',colorList(n,:))
end

RC.setThetaTick('LineWidth',2,'Color',[.6,.6,.8]);          % theta轴颜色设置
RC.setRTick('LineWidth',1.5,'Color',[.8,.6,.6]);              % R轴颜色设置
RC.setPropLabel('FontSize',15,'FontName','Times New Roman','Color',[0,0,0])               % 属性标签
RC.setRLabel('FontSize',15,'FontName','Times New Roman','Color',[.8,0,0])                    % R刻度标签
% RC.setBkg('FaceColor',[0.8,0.8,0.8])                % 圆形背景颜色
% RC.setRLabel('Color','none')                           % 圆形背景颜色

str= strcat(pathFigure, "Figure2", '.tiff');
print(gcf, '-dtiff', '-r600', str);
2 方法二
函数来源为MATLAB帮助-spider_plot
2.1 调用函数
语法(Syntax):
spider_plot(P)

spider_plot(P, Name, Value, ...)

h = spider_plot(_)
输入变量:
- P:用于绘制蜘蛛图的数据点。行是数据组,列是数据点。如果没有指定轴标签和轴限制,则自动生成。[向量|矩阵]
输出变量:
- h:蜘蛛图的图柄。(图对象)
名称-值对参数(Name-Value Pair Arguments):
| 名称 | 说明 | 备注 |
|---|---|---|
| AxesLabels | 用于指定每个轴的标签 | [自动生成(默认)/单元格的字符串/ ‘none’] |
| AxesInterval | 用于更改显示在网页之间的间隔数 | [3(默认值)/ integer] |
| AxesPrecision | 用于更改轴上显示的值的精度级别 | [1(默认)/ integer / vector] |
| AxesDisplay | 用于更改显示轴文本的轴数。'None’或’one’可用于简化规范化数据的图形外观 | [‘none’(默认)/ “没有”/“一”/“数据”/“data-percent”] |
2.2 案例
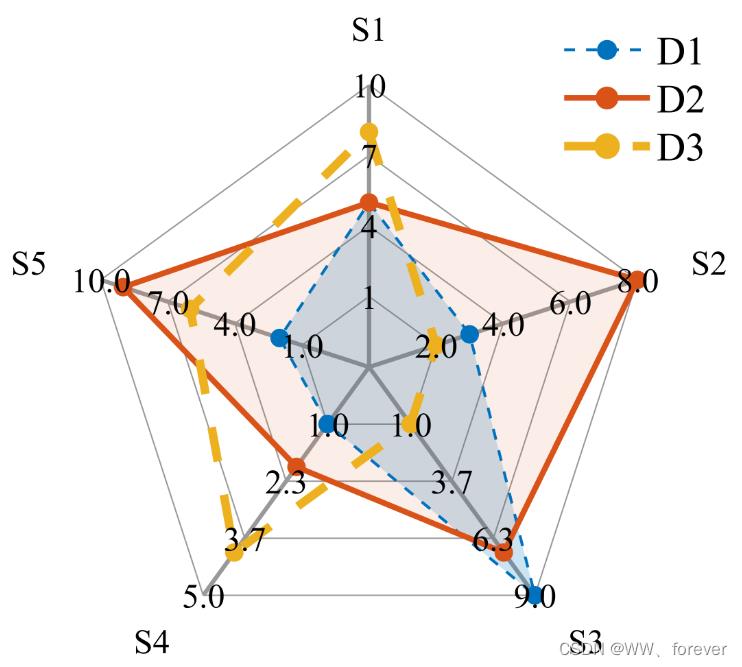
2.2.1 案例1:填充型
成图如下所示:
MATLAB实现代码如下:
clc
close all
clear
%% 导入数据
pathFigure= '.\\Figures\\' ;
%% Example 1
% Initialize data points
D1 = [5 3 9 1 2];
D2 = [5 8 7 2 9];
D3 = [8 2 1 4 6];
P = [D1; D2; D3];

% Spider plot
figure(1)
h = spider_plot(P,...
    'AxesLabels', 'S1', 'S2', 'S3', 'S4', 'S5',...
    'FillOption', 'on', 'on', 'off',...
    'FillTransparency', [0.2, 0.1, 0.1],...
    'AxesLimits', [1, 2, 1, 1, 1; 10, 8, 9, 5, 10],...             % [min axes limits; max axes limits]
    'AxesPrecision', [0, 1, 1, 1, 1],...
    'LineStyle', '--', '-', '--',...
    'LineWidth', [1, 2, 3],...
    'AxesFont', 'Times New Roman',...
    'LabelFont', 'Times New Roman',...
    'AxesFontSize', 12,...
    'LabelFontSize', 12,...
    'AxesLabelsEdge', 'none');


% Legend settings
hl = legend('D1', 'D2', 'D3', 'Location', 'northeast');
set(hl,'Box','off','FontSize',14,'Fontname', 'Times New Roman');

str= strcat(pathFigure, "Figure1", '.tiff');
print(gcf, '-dtiff', '-r600', str);
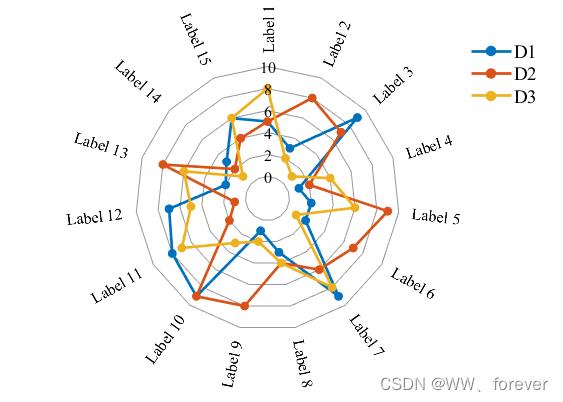
2.2.2 案例2:线型
成图如下所示:
MATLAB实现代码如下:
clc
close all
clear
%% 导入数据
pathFigure= '.\\Figures\\' ;
%% Example 2
% Initialize data points
D1 = [5 3 9 1 2 2 9 3 1 9 8 7 2 3 6];
D2 = [5 8 7 2 9 7 6 4 8 9 2 1 8 2 4];
D3 = [8 2 1 4 6 1 8 4 2 3 7 5 6 1 6];
P = [D1; D2; D3];

% Spider plot
spider_plot(P,...
    'AxesLimits', [0 0 0 0 0 0 0 0 0 0 0 0 0 0 0;...
    10 10 10 10 10 10 10 10 10 10 10 10 10 10 10],...
    'AxesInterval', 5,...
    'AxesDisplay', 'one',...
    'AxesPrecision', 0,...
    'AxesLabelsRotate', 'on',...
    'AxesLabelsOffset', 0.1,...
    'AxesRadial', 'off',...
     'AxesFont', 'Times New Roman',...
    'LabelFont', 'Times New Roman',...
    'AxesFontSize', 12,...
    'LabelFontSize', 12,...
    'AxesLabelsEdge', 'none');

% Legend settings
hl = legend('D1', 'D2', 'D3', 'Location', 'northeast');
set(hl,'Box','off','FontSize',14,'Fontname', 'Times New Roman');

str= strcat(pathFigure, "Figure2", '.tiff');
print(gcf, '-dtiff', '-r600', str);
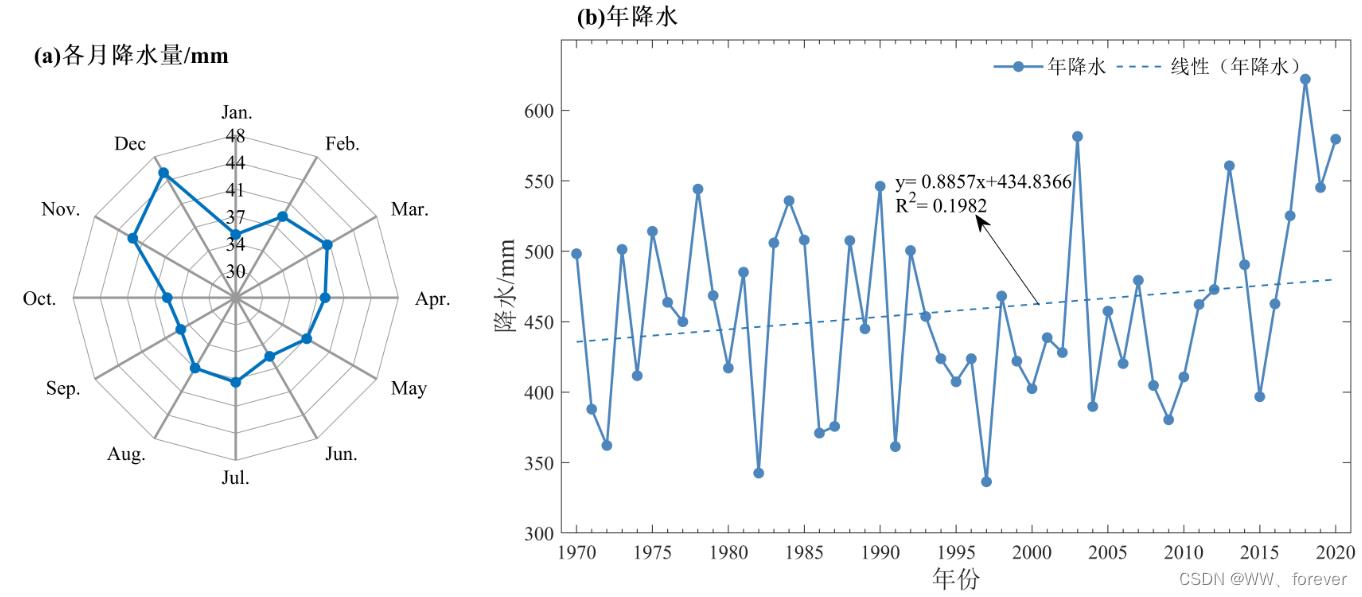
2.2.3 案例3:绘制各月降水量
成图如下所示:
MATLAB绘图代码如下:
clc
close all
clear
%% 导入数据
pathFigure= '.\\Figures\\' ;

%% 开始绘图
figureUnits = 'centimeters';
figureWidth = 30;
figureHeight = 15;

figure(1)
set(gcf, 'Units', figureUnits, 'Position', [0 0 figureWidth figureHeight]);

pos1 = [0.05 0.1 0.3 0.8];
subplot('Position',pos1)
hold on;
box on;
spider_plot(PArea,...
    'AxesLabels', 'Jan.', 'Feb.', 'Mar.', 'Apr.', 'May','Jun.', 'Jul.', 'Aug.', 'Sep.', 'Oct.', 'Nov.', 'Dec.',...
    'AxesLimits', [ones(1,12)*30 ; ones(1,12)*48 ],...
    'AxesInterval', 5,...
    'AxesDisplay', 'one',...
    'AxesPrecision', 0,...
    'AxesLabelsRotate', 'off',...
    'AxesLabelsOffset', 0.1,...
    'AxesRadial', 'on',...
     'AxesFont', 'Times New Roman',...
    'LabelFont', 'Times New Roman',...
    'AxesFontSize', 12,...
    'LabelFontSize', 12,...
    'AxesLabelsEdge', 'none');
text( 'string', "\\fontnameTimes New Roman(a)\\fontname宋体各月降水量\\fontnameTimes New Roman/mm", 'Units','normalized','position',[0.02,1.05],  'FontSize',14,'FontWeight','Bold');


pos2 = [0.43 0.15 0.56 0.7];
subplot('Position',pos2)
hold on;
box on;
h(1) = plot(PAreaYear,'-o','LineWidth',1.5,'color',[77,133,189]/255,'MarkerEdgeColor',[77,133,189]/255,'MarkerFaceColor',[77,133,189]/255,'Markersize',5);
h(2) = plot(1:nYear, PAreaYearfit ,'--','color',[40 120 181]/255,'LineWidth',1);
xlabel("\\fontname宋体\\fontsize15年份",'FontName','宋体','FontSize',12);                          % 后续调整坐标标题
ylabel("\\fontname宋体\\fontsize15降水\\fontnameTimes New Roman\\fontsize15/mm",'FontSize',12);                          % 后续调整坐标标题
text( 'string', "\\fontnameTimes New Roman(b)\\fontname宋体年降水", 'Units','normalized','position',[0.02,1.05],  'FontSize',14,'FontWeight','Bold');
set(gca,'xlim',[0  nYear+1],'xtick',[1:5:nYear+1],'xticklabel', [yearStart :5:yearEnd] ,'FontSize',12,'FontName','Times New Roman','XMinorTick','on');
text( nYear/2-3.5,550 ,"y= "+roundn( P(1,1),-4) +"x+"+roundn( P(1,2),-4) , 'color','k', 'FontSize',12,'FontName','Times New Roman' );
text( nYear/2-3.5,535 ,"R^2= "+ roundn(R,-4) , 'color','k', 'FontSize',12,'FontName','Times New Roman' );
ax = gca;
ax.XAxis.MinorTickValues = 1:1:nYear+1;
set(gca,'ylim',[300 650],'ytick',[300:50:620],'yticklabel',[300:50:620],'FontSize',12,'FontName','Times New Roman');
hl = 以上是关于MATLAB绘制雷达图/蜘蛛图的主要内容,如果未能解决你的问题,请参考以下文章