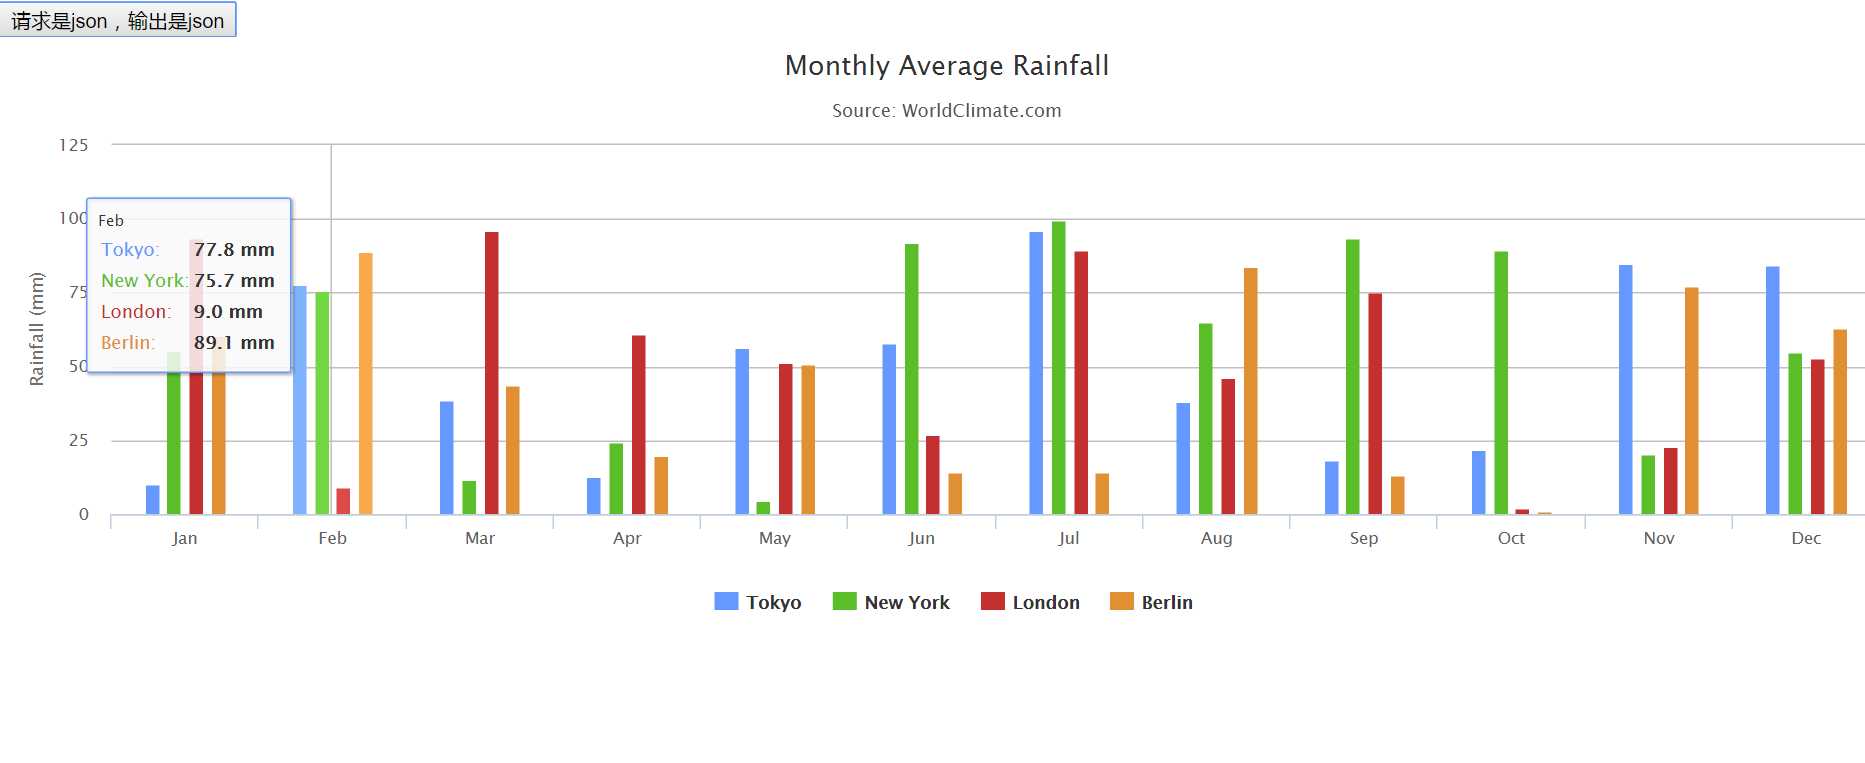
Struts2+json+hignchart(简单柱状图实现--适合jquery小白)
Posted
tags:
篇首语:本文由小常识网(cha138.com)小编为大家整理,主要介绍了Struts2+json+hignchart(简单柱状图实现--适合jquery小白)相关的知识,希望对你有一定的参考价值。
做了一个简单的基于Struts2 + Json + HighChart的小例子,费了一下午+晚上的时间,虽然简单,但对于我这种Jquery+Ajax小白的人还是很值得记录的。
哈哈哈
# 0. 关键点找到highchart的模板网站
https://www.hcharts.cn/docs/basic-tooltip
# 1. 关键点,在struts.xml中配置返回类型为json
<action name="queryItemsJson" class="com.bestplan.action.JsonAction" method="jsonTest">
<result type="json">
<param name="root">dataMap</param>
</result>
# 2. 关键点2
public class JsonAction {
private Map<String, Object> dataMap;
public String jsonTest(){
dataMap = new HashMap<String,Object>();
dataMap.clear();
List<List<Float>> aveTimeForCpsWay = new ArrayList<List<Float>>();
for(int x=0;x<4;x++){
List<Float> temp = new ArrayList<Float>();
for(int i=0;i<12;i++){
temp.add((new Random().nextFloat())*100); // 随机产生12个float数
}
aveTimeForCpsWay.add(temp);
}
List<String> name = new ArrayList<String>();
name.add("Tokyo");
name.add("New York");
name.add("London");
name.add("Berlin");
dataMap.put("dataArr", aveTimeForCpsWay);
dataMap.put("nameArr", name);
return "success";
}
public Map<String, Object> getDataMap() {
return dataMap;
}
public void setDataMap(Map<String, Object> dataMap) {
this.dataMap = dataMap;
}
}
# 3. 关键点
<%@ page language="java" contentType="text/html; charset=UTF-8"
    pageEncoding="UTF-8"%>
<%@ taglib prefix="s" uri="/struts-tags" %>
<!DOCTYPE html PUBLIC "-//W3C//DTD HTML 4.01 Transitional//EN" "http://www.w3.org/TR/html4/loose.dtd">
<html>
<head>
<meta http-equiv="Content-Type" content="text/html; charset=UTF-8">
<title>Insert title here</title>
<script src="js/jquery.1.9.1.min.js"></script>
<script src="js/highcharts.js"></script>
<script type="text/javascript">
function requestJson(){
    alert("nihao");
    $.ajax({
        type:‘GET‘,
        url:‘queryItemsJson.action‘,
        contentType:‘application/json;charset=utf-8‘,
        //数据格式是json串
        dataType:"html", //接受响应的数据类型
        success:function(data){//返回json结果
            alert(data);
            var d = eval("("+data+")");
        var chart = new Highcharts.Chart({
            chart: {
                renderTo:‘container‘,
                type: ‘column‘
            },
            title: {
                text: ‘Monthly Average Rainfall‘
            },
            subtitle: {
                text: ‘Source: WorldClimate.com‘
            },
            xAxis: {
                categories: [
                    ‘Jan‘,
                    ‘Feb‘,
                    ‘Mar‘,
                    ‘Apr‘,
                    ‘May‘,
                    ‘Jun‘,
                    ‘Jul‘,
                    ‘Aug‘,
                    ‘Sep‘,
                    ‘Oct‘,
                    ‘Nov‘,
                    ‘Dec‘
                ],
                crosshair: true
            },
            yAxis: {
                min: 0,
                title: {
                    text: ‘Rainfall (mm)‘
                }
            },
            tooltip: {
                headerFormat: ‘<span style="font-size:10px">{point.key}</span><table>‘,
                pointFormat: ‘<tr><td style="color:{series.color};padding:0">{series.name}: </td>‘ +
                ‘<td style="padding:0"><b>{point.y:.1f} mm</b></td></tr>‘,
                footerFormat: ‘</table>‘,
                shared: true,
                useHTML: true
            },
            plotOptions: {
                column: {
                    pointPadding: 0.2,
                    borderWidth: 0
                }
            },
            series: [{
                name: d.nameArr[0],
                data: d.dataArr[0]
            }, {
                name: d.nameArr[1],
                data: d.dataArr[1]
            }, {
                name: d.nameArr[2],
                data: d.dataArr[2]
            }, {
                name: d.nameArr[3],
                data: d.dataArr[3]
            }]
        });

        }
        }
);
}
</script>
</head>
<body>
<input type="button" onclick="requestJson()" value="请求是json,输出是json"><div id="mydiv"></div>
  <div id="container" style="min-width:400px;height:400px"></div>
</body>
</body>
</html>
效果图

以上是关于Struts2+json+hignchart(简单柱状图实现--适合jquery小白)的主要内容,如果未能解决你的问题,请参考以下文章