sklearn cookbook 总结
Posted zzulp
tags:
篇首语:本文由小常识网(cha138.com)小编为大家整理,主要介绍了sklearn cookbook 总结相关的知识,希望对你有一定的参考价值。
Sklearn cookbook总结
1 数据预处理
1.1 获取数据
sklearn自带一些数据集,可以通过datasets模块的load_*方法加载,还有一些数据集比较大,可以通过fetch_*的方式下载。下面的代码示例了加载boston的房价数据和下载california的房价数据的方法。
from sklearn import datasets

boston = datasets.load_boston()
print(boston.DESCR)

california = datasets.fetch_california_housing('./temp')
# print(california.DESCR)
Boston House Prices dataset
===========================

Notes
------
Data Set Characteristics:

    :Number of Instances: 506

    :Number of Attributes: 13 numeric/categorical predictive

    :Median Value (attribute 14) is usually the target

    :Attribute Information (in order):
        - CRIM     per capita crime rate by town
        - ZN       proportion of residential land zoned for lots over 25,000 sq.ft.
        - INDUS    proportion of non-retail business acres per town
        - CHAS     Charles River dummy variable (= 1 if tract bounds river; 0 otherwise)
        - NOX      nitric oxides concentration (parts per 10 million)
        - RM       average number of rooms per dwelling
        - AGE      proportion of owner-occupied units built prior to 1940
        - DIS      weighted distances to five Boston employment centres
        - RAD      index of accessibility to radial highways
        - TAX      full-value property-tax rate per $10,000
        - PTRATIO  pupil-teacher ratio by town
        - B        1000(Bk - 0.63)^2 where Bk is the proportion of blacks by town
        - LSTAT    % lower status of the population
        - MEDV     Median value of owner-occupied homes in $1000's

    :Missing Attribute Values: None

    :Creator: Harrison, D. and Rubinfeld, D.L.

This is a copy of UCI ML housing dataset.
http://archive.ics.uci.edu/ml/datasets/Housing


This dataset was taken from the StatLib library which is maintained at Carnegie Mellon University.

The Boston house-price data of Harrison, D. and Rubinfeld, D.L. 'Hedonic
prices and the demand for clean air', J. Environ. Economics & Management,
vol.5, 81-102, 1978.   Used in Belsley, Kuh & Welsch, 'Regression diagnostics
...', Wiley, 1980.   N.B. Various transformations are used in the table on
pages 244-261 of the latter.

The Boston house-price data has been used in many machine learning papers that address regression
problems.

**References**

   - Belsley, Kuh & Welsch, 'Regression diagnostics: Identifying Influential Data and Sources of Collinearity', Wiley, 1980. 244-261.
   - Quinlan,R. (1993). Combining Instance-Based and Model-Based Learning. In Proceedings on the Tenth International Conference of Machine Learning, 236-243, University of Massachusetts, Amherst. Morgan Kaufmann.
   - many more! (see http://archive.ics.uci.edu/ml/datasets/Housing)
1.2 数据处理
sklearn的preprocess模块提供了若干预处理数据的方法。其功能如下:
| 类或方法 | 作用 |
|---|---|
| StandardScaler | 数据减去均值后除以方差 |
| MinMaxScaler | 减去最小值除以最大最小值的差 |
| normalize | 将数据除以所有点的平方和 |
| binary | 由设置的阀值s进行二值化,x>s?1:0 |
其使用示例如下,由于是二维数组,计算在列上进行,即axis为0:
import numpy as np
from sklearn import preprocessing

a = np.array([[4., 2.], [2., 4.], [2, -2]], dtype=np.float)

print(a)

scaler = preprocessing.StandardScaler()
r = scaler.fit_transform(a)
print(r)

scaler = preprocessing.MinMaxScaler()
r = scaler.fit_transform(a)
print(r)

r = preprocessing.normalize(a)
print(r)

binary = preprocessing.Binarizer(3.5)
r = binary.fit_transform(a)
print(r)
[[ 4.  2.]
 [ 2.  4.]
 [ 2. -2.]]
[[ 1.41421356  0.26726124]
 [-0.70710678  1.06904497]
 [-0.70710678 -1.33630621]]
[[1.         0.66666667]
 [0.         1.        ]
 [0.         0.        ]]
[[ 0.89442719  0.4472136 ]
 [ 0.4472136   0.89442719]
 [ 0.70710678 -0.70710678]]
[[1. 0.]
 [0. 1.]
 [0. 0.]]
###1.3 分类编码
对于类别型的数据,需要将其数值化,以支持向量运算。
对于数值型的,可以使用preprocessing包的OneHotEncoder;对于字符串型的需要借助feature_extraction模块来进行。
from sklearn import preprocessing
from sklearn.feature_extraction import DictVectorizer


labels = [[1], [2], [3], [2]]

onehot = preprocessing.OneHotEncoder()
y = onehot.fit_transform(labels)

print(y.toarray())


labels = ['kind':'apple', 'kind':'orange']
dv = DictVectorizer()
y = dv.fit_transform(labels)
print(y.toarray())


labels = [1,2,3,3,2,1]
lb = preprocessing.LabelBinarizer()
vec = lb.fit_transform(labels)
print(vec)
[[1. 0. 0.]
 [0. 1. 0.]
 [0. 0. 1.]
 [0. 1. 0.]]
[[1. 0.]
 [0. 1.]]
[[1 0 0]
 [0 1 0]
 [0 0 1]
 [0 0 1]
 [0 1 0]
 [1 0 0]]
1.4 缺失值处理
缺失值可以表示为nan,但在计算中无法使用,因此根据需要可以填充为合适的值。sklearn和pandas都能处理缺失值。
import pandas as pd
from sklearn import preprocessing


data = np.array([[1, 2], [np.nan, 4]])
print('origin:\\n', data)

imputer = preprocessing.Imputer(strategy='mean')
r = imputer.fit_transform(data)
print('sklean:\\n', r)


data_df = pd.DataFrame(data)
df = data_df.fillna(data_df.mean())
print('pandas\\n',df)
origin:
 [[ 1.  2.]
 [nan  4.]]
sklean:
 [[1. 2.]
 [1. 4.]]
pandas
      0    1
0  1.0  2.0
1  1.0  4.0
1.5 去除无用的维度
PCA是sklearn的一个分解模块,可以借助它来完成数据降维。
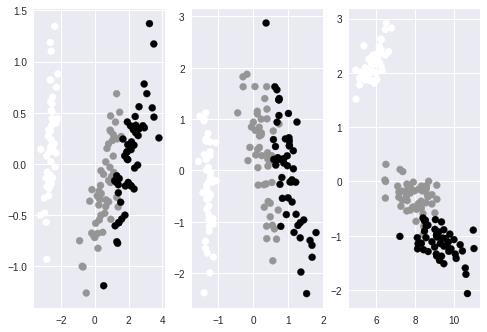
下面的代码对iris的特征进行PCA降维,通过对各维度的贡献分析,96%的变量可以由前两个主成分表示。因此可以把数据降低到前两维上,通过对PCA的参数n_components指定维度或比例,可以将数据进行降维。在只有两维的数据上通过plot作图以验证数据的可分性。
降维的另一个方法是使用FactorAnalysis类,使用上和PCA类似。其支持的核函数有liner, poly, rbf, sigmoid, cosine。
最后,利用矩阵的SVD也可以实现数据降维。各种降维方法的示例代码及效果如下:
import matplotlib.pyplot as plt

from sklearn import datasets
from sklearn.decomposition import PCA, FactorAnalysis
from sklearn.decomposition import TruncatedSVD


iris = datasets.load_iris()

pca = PCA()
dt = pca.fit_transform(iris.data)
print(pca.explained_variance_ratio_)

'''
array([  8.05814643e-01,   1.63050854e-01,   2.13486883e-02,......)
'''

fig, axes = plt.subplots(1,3)

pca = decomposition.PCA(n_components = 2)
dt = pca.fit_transform(iris.data)
axes[0].scatter(dt[:,0], dt[:,1], c=iris.target)


fa = FactorAnalysis(n_components=2)
dt = fa.fit_transform(iris.data)
axes[1].scatter(dt[:,0], dt[:,1], c=iris.target)


svd = TruncatedSVD()
dt = svd.fit_transform(iris.data)
axes[2].scatter(dt[:,0], dt[:,1], c=iris.target)
[0.92461621 0.05301557 0.01718514 0.00518309]


<matplotlib.collections.PathCollection at 0x7f2d406d9ef0>
1.6 使用pipeline连接多个变换
对于多步处理,pipeline提供了一种便捷的组织代码的方式。如下示例:
from sklearn import pipeline, preprocessing, decomposition, datasets

iris = datasets.load_iris()

imputer = preprocessing.Imputer()
pca = decomposition.PCA(n_components=2)
line = [('imputer', imputer), ('pca', pca)]

pipe = pipeline.Pipeline(line)
dt = pipe.fit_transform(iris.data)
print dt.shape #(150,2)
1.7 利用高斯随机过程处理回归
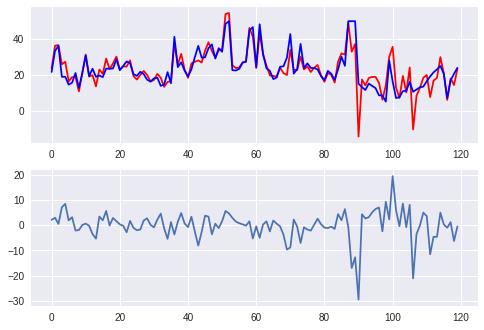
如果假设变量的分布和自变量符合高斯分布或正态分布,则可以使用高斯过程来进行回归分析。
from sklearn import datasets
from sklearn.gaussian_process import GaussianProcess

boston = datasets.load_boston()

sel = np.random.choice([True, False], len(boston.data), p=[0.75, 0.25])
gp = GaussianProcess()
gp.fit(boston.data[sel], boston.target[sel])

pred = gp.predict(boston.data[~sel])
diff = pred - boston.target[~sel]
xtick = range(len(pred))

fig, axes = plt.subplots(2,1)

axes[0].plot(xtick, pred, c='red',label='predict')
axes[0].plot(xtick, boston.target[~sel], c='blue', label='real')

axes[1].plot(xtick, diff)

plt.show()
/usr/local/lib/python3.6/dist-packages/sklearn/utils/deprecation.py:58: DeprecationWarning: Class GaussianProcess is deprecated; GaussianProcess was deprecated in version 0.18 and will be removed in 0.20. Use the GaussianProcessRegressor instead.
warnings.warn(msg, category=DeprecationWarning)
/usr/local/lib/python3.6/dist-packages/sklearn/utils/deprecation.py:77: DeprecationWarning: Function l1_cross_distances is deprecated; l1_cross_distances was deprecated in version 0.18 and will be removed in 0.20.
warnings.warn(msg, category=DeprecationWarning)
/usr/local/lib/python3.6/dist-packages/sklearn/utils/deprecation.py:77: DeprecationWarning: Function constant is deprecated; The function constant of regression_models is deprecated in version 0.19.1 and will be removed in 0.22.
warnings.warn(msg, category=DeprecationWarning)
/usr/local/lib/python3.6/dist-packages/sklearn/utils/deprecation.py:77: DeprecationWarning: Function squared_exponential is deprecated; The function squared_exponential of correlation_models is deprecated in version 0.19.1 and will be removed in 0.22.
warnings.warn(msg, category=DeprecationWarning)
1.8 SGD处理回归
from sklearn import datasets
from sklearn.linear_model import SGDRegressor

X, y = datasets.make_regression(1000)
sel = np.random.choice([True, False], len(X), p=[0.75, 0.25])

sgd = SGDRegressor(max_iter=10, tol=0.1)
sgd.fit(X[sel], y[sel])

pred = sgd.predict(X[~sel])
diff = pred - y[~sel]

xtick = range(len(pred))

fig, axes = plt.subplots(2,1)

axes[0].plot(xtick, pred, c='red',label='predict')
axes[0].plot(xtick, y[~sel], c='blue', label='real')

axes[1].plot(xtick, diff)

plt.show()
2 线性模型
2.1 线性回归模型
from sklearn import datasets
from sklearn import linear_model

boston = datasets.load_boston()
model = linear_model.LinearRegression()

model.fit(boston.data, boston.target)
print(model.coef_)

pred = model.predict(boston.data)
diff = pred - boston.target
xtick = range(len(pred))

fig, axes = plt.subplots(2,1)

axes[0].plot(xtick, pred, c='red',label='predict')
axes[0].plot(xtick, boston.target, c='blue', label='real')

axes[1].plot(xtick, diff)

plt.show()
[-1.07170557e-01  4.63952195e-02  2.08602395e-02  2.68856140e+00
 -1.77957587e+01  3.80475246e+00  7.51061703e-04 -1.47575880e+00
  3.05655038e-01 -1.23293463e-02 -9.53463555e-01  9.39251272e-03
 -5.25466633e-01]
2.2 岭回归
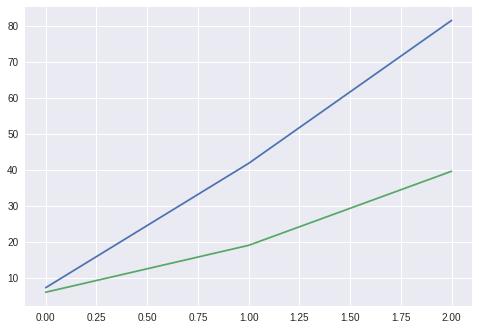
岭回归在处理非满秩的矩阵时比较有用。 它可以去除不相关的系数。
为了找到合适的参数,可以使用交叉验证的方法。
from sklearn.datasets import make_regression
from sklearn.linear_model import LinearRegression, Ridge, RidgeCV
X, y = make_regression(n_samples=100, n_features=3, effective_rank=2, noise=5)


lr = LinearRegression()
lr.fit(X, y)

ridge = Ridge()
ridge.fit(X,y)

_, ax = plt.subplots(1,1)
ax.plot(range(len(lr.coef_)), lr.coef_)
ax.plot(range(len(ridge.coef_)), ridge.coef_)

plt.show()

ridge_cv = RidgeCV(alphas=[0.05, 0.08 ,0.1, 0.2, 0.8])
ridge_cv.fit(X, y)
print(ridge_cv.alpha_)
0.05
2.3 LASSO正则化
通过加入惩罚系数,消除系数之间的相关性。
如下示例所示,使用线性回归得到系数全部是相关的,但使用lasso处理后,只有5个是相关的。
为了找到lasso正则化合适的参数,我们需要使用交叉验证来寻找最优的参数。
from sklearn.linear_model import Lasso, LinearRegression
from sklearn.datasets import make_regression

X, y = make_regression(n_samples=1000, n_features=500, n_informative=5, noise=10)

lr = LinearRegression()
lr.fit(X, y)
print(np.sum(lr.coef_ !=0))

lasso = Lasso()
lasso.fit(X, y)
print(np.sum(lasso.coef_ !=0))

from sklearn.linear_model import LassoCV
lasso_cv = LassoCV()
lasso_cv.fit(X, y)
print(lasso_cv.alpha_)
500
6
0.7173410510859349
2.6 LARS正则化
LARS是一种回归手段,用于解决高维问题,即特征数远大于样本数量。LARS好处是可以设定一个较小的特征数量,防止数据的过拟合。LarsCV也可用来探索最优的参数。
from sklearn.datasets import make_regression
from sklearn.linear_model import Lars

X, y = make_regression(n_samples=200, n_features=500, n_informative=10, noise=2)
lars = Lars(n_nonzero_coefs=10)

lars.fit(X, y)

print(np.sum(lars.coef_ != 0 ))
10
2.7 逻辑回归
逻辑回归和上面的线性回归使用方法类似。
from sklearn.linear_model import LogisticRegression
from sklearn import datasets

iris = datasets.load_iris()
lr = LogisticRegression()

lr.fit(iris.data[:100], iris.target[:100])

pred = lr.predict(iris.data[100:])

diff = pred - iris.target[100:]

print(diff)
[-1 -1 -1 -1 -1 -1 -1 -1 -1 -1 -1 -1 -1 -1 -1 -1 -1 -1 -1 -1 -1 -1 -1 -1
 -1 -1 -1 -1 -1 -1 -1 -1 -1 -1 -1 -1 -1 -1 -1 -1 -1 -1 -1 -1 -1 -1 -1 -1
 -1 -1]
2.8 Bayes岭回归
from sklearn import datasets
from sklearn.linear_model import BayesianRidge
import matplotlib.pyplot as plt

boston = datasets.load_boston()
beyes = BayesianRidge()
beyes.fit(boston.data, boston.target)
print(beyes.coef_)

bayes = BayesianRidge(alpha_1=10, lambda_1=10)
beyes.fit(boston.data, boston.target)
print(beyes.coef_)
[-0.10035603  0.04970825 -0.04362901  1.89550379 -2.14222918  3.66953449
 -0.01058388 -1.24482568  0.27964471 -0.01405975 -0.79764042  0.01011661
 -0.56264033]
[-0.10035603  0.04970825 -0.04362901  1.89550379 -2.14222918  3.66953449
 -0.01058388 -1.24482568  0.27964471 -0.01405975 -0.79764042  0.01011661
 -0.56264033]
2.9 GBR回归
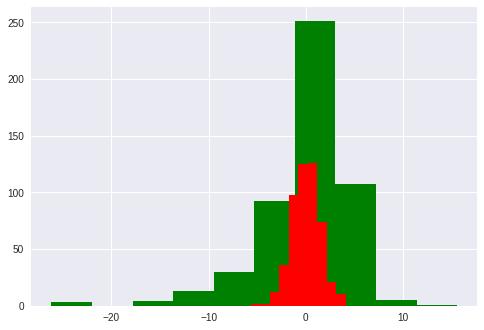
梯度提升树(GradientBoosting)是一种集成学习方法。在ensemble模块中提供了BGR供使用,下面的代码示例了GBR的使用方法,并与Linear模型的误差进行对比。
from sklearn import datasets
from sklearn.ensemble import GradientBoostingRegressor as GBR
from sklearn.linear_model import LinearRegression
import matplotlib.pyplot as plt

boston = datasets.load_boston()

lr = LinearRegression()
lr.fit(boston.data, boston.target)

pred = lr.predict(boston.data)
diff = pred - boston.target
plt.hist(diff, color='g')

gbr = GBR(n_estimators=100, max_depth=3, loss='ls')
gbr.fit(boston.data, boston.target)

pred = gbr.predict(boston.data)
diff = pred - boston.target
plt.hist(diff, color='r')
(array([  2.,   2.,  12.,  36.,  98., 125., 126.,  74.,  21.,  10.]),
 array([-5.64276266, -4.66928597, -3.69580928, -2.72233259, -1.7488559 ,
        -0.77537921,  0.19809748,  1.17157417,  2.14505086,  3.11852755,
         4.09200424]),
 <a list of 10 Patch objects>)
3 聚类模型
3.1 使用KMeans进行聚类
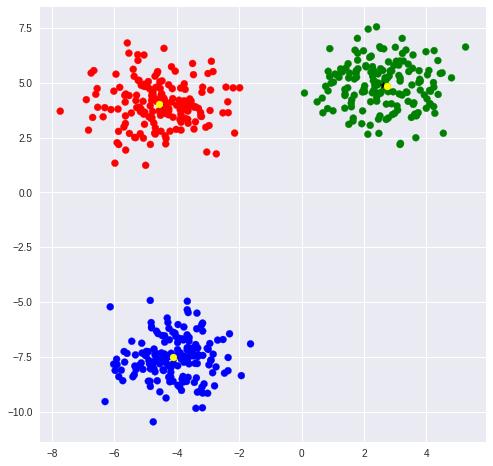
KMeans是最为常用的聚类方式,在cluster模块中可以找到KMeans类。通过指定中心数量可以令模型进行无监督聚类。
KMeans实例对象属性labels_保存了所有点的聚类标签,可以通过标签观察同一类的点。
当数据量很大时,KMeans计算很慢,这时可以使用Mini Batch KMeans来加速计算。
from sklearn.datasets import make_blobs
import matplotlib.pyplot as plt
import numpy as np
from sklearn.cluster import KMeans, MiniBatchKMeans

rgb=np.array(['r', 'g', 'b'])
blobs, classes = make_blobs(500, centers=3)
_, ax = plt.subplots(figsize=(8,8))
ax.scatter(blobs[:,0], blobs[:, 1], color=rgb[classes])

kmean = KMeans(n_clusters=3)
kmean.fit(blobs)
print(kmean.cluster_centers_)
#for kind in range(len(classes)):
#    print(blobs[kmean.labels_== kind])
ax.scatter(kmean.cluster_centers_[:,0], kmean.cluster_centers_[:,1], marker='*', color='black')


mb_kmean = MiniBatchKMeans(n_clusters=3, batch_size=100)
mb_kmean.fit(blobs, classes)
print(mb_kmean.cluster_centers_)
ax.scatter(mb_kmean.cluster_centers_[:,0], mb_kmean.cluster_centers_[:,1], marker='o', color='yellow')
[[ 2.62505603  4.87281732]
 [-4.10154624 -7.5409836 ]
 [-4.5489481   4.00556156]]
[[ 2.72677398  4.8618203 ]
 [-4.10933407 -7.50669163]
 [-4.56130824  4.04383432]]


<matplotlib.collections.PathCollection at 0x7fdc49868ba8>
3.2 优化聚类的数量
使用Silhouette距离的均值来衡量聚类结果的好坏,在metrics模块中可以找到silhouette_score方法来计算得分。
通过计算一系列的不同的聚类数量的得分,通常得分最高的位置附近是比较好的聚类数量取值。
from sklearn import metrics
from sklearn.datasets import make_blobs
import matplotlib.pyplot as plt
from sklearn.cluster import KMeans
blobs, classes = make_blobs(500, centers=3)
scores = []
for k in range(2, 30):
kmean = KMeans(n_clusters=k)
kmean.fit(blobs, classes)
scores.append(metrics.silhouette_score