对于使用 Visual Studio Code 的 Java 开发者来说,Language Support for Java(TM) by Red Hat 扩展提供了非常好的语言特性支持,比如智能感知和项目支持等。然而,我们也听到一些用户反馈需要调试 Java 程序。今天,我们万分激动地宣布,我们与 Red Hat 合作开发了能让开发者调试 Java 应用程序的轻量级扩展:Java Debugger for Visual Studio Code,它基于 Java Debug Server。

注意: Java Debugger for Visual Studio Code 和 Java Debug Server 都将在发布初始版后不久开放源码。
为了让 Java 开发者能尽快开始使用 VS Code,我们也创建了一个 Java 扩展包,它包含了 Language Support for Java(TM) by Red Hat 和 Java Debugger for Visual Studio Code 这两个扩展,这样你不需要单独去搜索安装这些扩展。这是刚刚开始创建的一个现代 Java 工作流程,将来我们会往 Java 扩展包中添加更多特性和扩展。

开始
从以下步骤开始:
-
在 Visual Studio Code 中打开扩展视图(Ctrl+Shift+X)。
-
输入“java”以过滤扩展列表。
-
找到并安装 Java Extension Pack (Java 扩展包),如果你已经安装了 Language Support for Java(TM) by Red Hat,也可以单独找到并安装 Java Debugger for Visual Studio Code 扩展。
你也可以直接从本文中安装 Java 扩展包:
安装 Java 扩展包 (安装了 VSCode 的情况下,点击上面的链接即可调用 VSCode 进行安装)
重启 VSCode,打开包含 Java 项目的代码,然后按下面的步骤进行:
-
准备项目。打开一个 .java 文件,Java 扩展会激活。Maven、Gradle 和 Eclipse 项目都能得到支持。这个扩展会自动构建项目,不需要手工触发构建。
-
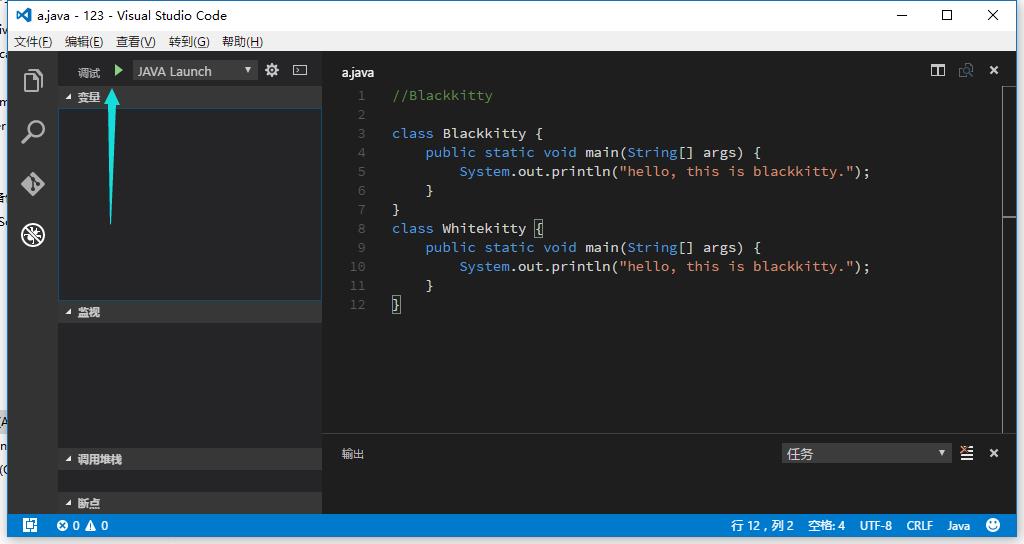
开始调试。切换到调试视图(Ctrl+Shift+D),打开 launch.json 并添加 Java 调试配置。
-
在 mainClass 中填入要启动的类,或者在 hostName 中填入要附加的主机名以及在 port 中填入端口。
-
设置断点并按 F5 开始调试。
-

-

支持的特性
在这个版本中,我们支持以下特性:
-
启动/附加 - 你可以在 VS Code 中启动一个 Java 项目,也可以附加到一个在本地或远程端以调试模式运行的 JVM 进程。
-
断点 - 支持表达式条件或命中条件断点,可以在内置的断点设置容器中轻松进行设置。因此你可以直接在源代码视图中插入断点,不需要弹出容器,非常方便。按异常中断也得到了支持。
-
控制流 - 包括 暂停、继续 F5、单步 F0、步进 F11、步出(跳出) Shift+F11。
-
数据审查 - 当程序停止在断点上的时候,调试器可以访问当前内存中的变量名和值。支持查看/监视/设置变量值。
-
诊断 - 调用栈 面板会显示程序的调用栈,你在这个面板中可以在捕获的调用路径中随意跳转。多线程调试也通过并行栈得到支持。
-
调试控制台 - 可以从调试控制台看到标准输出和错误输出信息。

The Java support in VS Code is provided through extensions and optimized for lightweight Java projects with a simple, modern workflow. Popular extensions in the Marketplace provide project support, code completion, linting, debugging, code formatting, snippets, and more.
Download VS Code - If you haven\'t downloaded VS Code yet, quickly install for your platform (Windows, Mac, Linux).
Install Java Extensions
VS Code is a fast editor and ships with only the basic features. Add Java language support to VS Code by installing the popular Java extensions.
- In Visual Studio Code, go to the Extensions view (Ctrl+Shift+X).
- Filter the extensions list by typing "java".
To help set up Java on VS Code, there is a Java Extension Pack which contains two popular extensions:
Install the Java Extension Pack
This document describes the features included in the Java Extension Pack.
Java Project Support
Maven, Eclipse and Gradle Java project are supported through Language Support for Java(TM) by Red Hat, by utilizing M2Eclipse which provides Maven support and Buildship which provides Gradle support through the Eclipse JDT Language Server.
Please note that Gradle-based Android projects are not supported.
Editing and Navigating Code

Linting
A linter is a tool that provides warnings for suspicious looking code. Language Support for Java(TM) by Red Hat provides this feature to report parsing and compilation errors as you type, so you can fix them inside VS Code.
Intellisense
VS Code also supports code completion and Intellisense for Java through Language Support for Java(TM) by Red Hat. Intellisense is a general term for a number of features, including intelligent code completion (in-context method and variable suggestions) across all your files and for built-in and thirty-party modules.
Search for symbols
You can search for symbols in the current file or workspace to navigate your code more quickly.
To search for a symbol in the current file, use Quick Open (Ctrl+P) then enter the \'@\' command, then enter the name of the symbol you\'re looking for. A list of potential matches will appear and be filtered as you type. Choose from the list of matches to navigate to its location.
To search for a symbol in the current workspace, start by pressing Ctrl+T, then enter the name of the symbol. A list of potential matches will appear as before. If you choose a match that was found in a file that\'s not already open, the file will be opened before navigating to the match\'s location. Alternatively, you can also use Quick Open (Ctrl+P) then enter the \'#\' command to search the current workspace.Ctrl+T is just the shortcut for the \'#\' commands, respectively, so everything works the same.
Peek Definition
You can take a quick look at how a symbol was defined by using the Peek Definition feature. This feature displays a few lines of code near the definition inside a peek window so you can take a look without navigating away from your current location.
To peek at a symbol\'s definition, place your cursor on the symbol anywhere it\'s used in your source code and then press Alt+F12. Alternatively, you can choose Peek Definition from the context menu (right-click, then choose Peek Definition).
Go to Definition
You can also quickly navigate to where a symbol is defined by using the Go to Definition feature.
To go to a symbol\'s definition, place your cursor on the symbol anywhere its used in your code and then press F12. Alternatively, you can choose Go to Definition from the context menu (right-click, then chooseGo to Definition). When there\'s only one definition of the symbol, you\'ll navigate directly to its location, otherwise the competing definitions are displayed in a peek window as described in the previous section and you have to choose the definition that you want to go to.
Other code editing features include:
- Code formatting
- Code snippets
- Code outline
- Code lens (references)
- Javadoc hovers
- Rename
- Highlights
Debugging
Java Debugger for Visual Studio Code is a lightweight Java Debugger based on Java Debug Server. It works with Language Support for Java by Red Hat to allow users debugging Java code using Visual Studio Code (VS Code).
The Java Debugger supports following features:
- Launch/Attach - You can either launch the Java project within VS Code or attach to any running JVM process in debug mode, locally or remotely.
- Breakpoints - Conditional breakpoints by Hit Count is supported and can easily be set using the inline breakpoint settings window. This allows you to conveniently add conditional breakpoints to your code, directly in the source viewer, without requiring a modal window. Break on exceptions is also supported.
- Control flow - Including Pause, Continue
F5, Step overF10, Step intoF11, Step outShift+F11 - Data inspection - When you\'re stopped at a breakpoint, the debugger has access to the variable names and values that are currently stored in memory. Inspect/Watch/Set Variables are supported.
- Diagnostics - The CALL STACK panel shows the call stack of your program and allows you to navigate through the call path of each captured allocation. Multi-threaded debugging is supported by parallel stacks.
- Debug Console - The Debug Console lets you see information from both stdout and stderr.

You can launch the debugger following steps below:
- Switch to the Debug view (Ctrl+Shift+D).
- Open
launch.jsonto add a debug configuration for Java - Fill in the
mainClassforLaunchsetting orhostNameandportforAttach. - Click Start button or press
F5to start debugging.

Next Steps
Read on to find out about:
- Basic Editing - Learn about the powerful VS Code editor.
- Code Navigation - Move quickly through your source code.
- Tasks - use tasks to build your project and more
- Debugging - find out how to use the debugger with your project
