曲线分类-特征提取
Posted wingooom
tags:
篇首语:本文由小常识网(cha138.com)小编为大家整理,主要介绍了曲线分类-特征提取相关的知识,希望对你有一定的参考价值。
时域特征
自相关系数与偏自相关系数
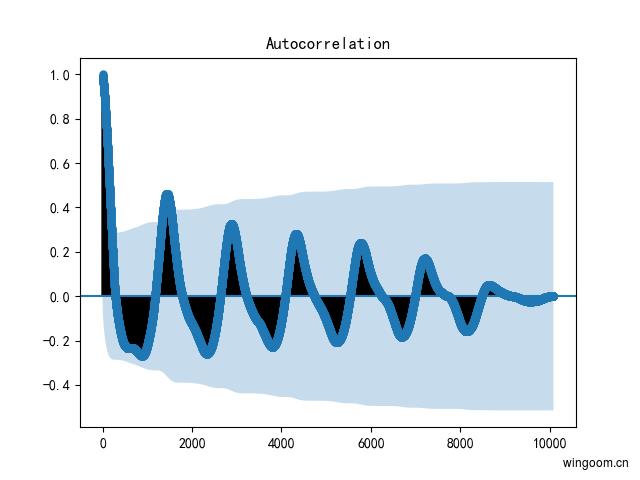
自相关(autocorrelation),指时序序列于其自身在不同时间点的互相关性.
离散数据的
l
l
阶自相关系数定义为
n
n
是时间序列的长度,
σ2
σ
2
为方差,
μ
μ
为均值

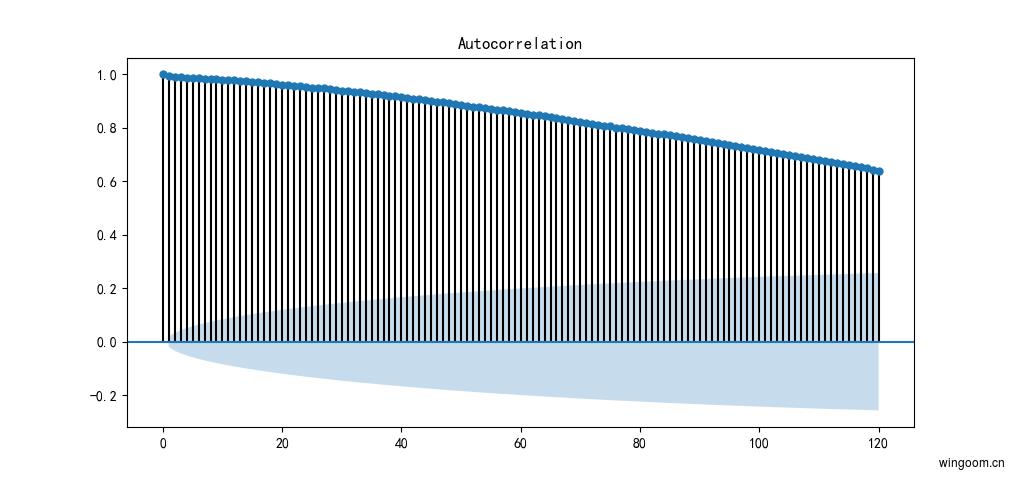
为了更清楚查看自相关系数,这里选择滞后阶数为120。
    from statsmodels.graphics.tsaplots import plot_acf
    plot_acf(df_data['value'],lags=120)
    plt.show()
偏自相关(partial_autocorrelation),滞后k阶偏自相关系数是指在给定中间k-1个随机变量
xt−1,xt−2...xt−k+1
x
t
−
1
,
x
t
−
2
.
.
.
x
t
−
k
+
1
的条件下,或者说在剔除了中间k-1个随机变量的干扰后,
xt−k对xt
x
t
−
k
对
x
t
影响的相关性度量
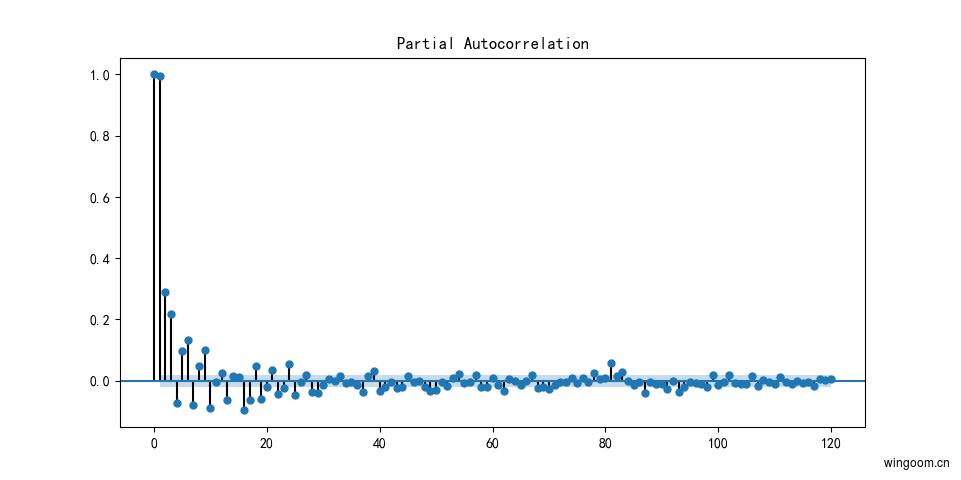
同样,选取滞后120阶偏自相关系数查看。
    from statsmodels.graphics.tsaplots import plot_pacf
    plot_pacf(df_data['value'],lags=120)
    plt.show()
自相关和偏自相关系数,可以取某一阶的值作为特征值。或者计算Box-Pierce统计值或 Ljung-Box Q*统计值。
Box-Pierce统计:
The Ljung-Box Q* 统计: