简单实用:css+html绘制常见图表
Posted 前端呆头鹅
tags:
篇首语:本文由小常识网(cha138.com)小编为大家整理,主要介绍了简单实用:css+html绘制常见图表相关的知识,希望对你有一定的参考价值。
提到绘制图表,大家可能想到ECharts,其实,一些简单的图表可以直接通过css+html实现,下面手把手带大家绘制,初学者也能轻松掌握。
1 css+html绘制柱形图
我们先写一个超简单的html文件。
<div class="bargraph">
    <div></div>
    <div></div>
    <div></div>
    <div></div>
    <div></div>
</div>
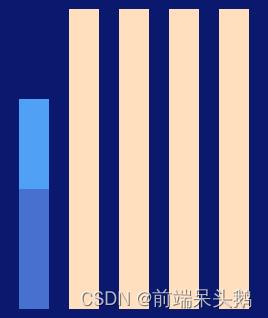
其中,最外层的div就是图表的背景板。内部的5个div是柱形图的5个柱形。
我们给最外层的div一个背景色和大小。
.bargraph
    background-color: #0f127c;
    width: 250px;
    height: 300px;
    padding: 10px;

另外,内部的div默认是纵向排列的,我们让它横向排列,肩并肩,并设立宽度和高度。
为了方便观察,这里先给它加一个背景色。
.bargraph
    display: flex;
    justify-content:space-around

.bargraph div
    background-color: bisque;

.bargraph div
    width: 30px;
    height: 100%;

这时候可以看到柱形图的轮廓了,接下来我们怎样设置柱形图百分比呢?
这里用到线性渐变。
.bargraph div:nth-child(1)
    background: linear-gradient(to bottom, transparent 30%, #62a8fb 30%, #62a8fb 60%, #5778d9 60%);
线性渐变linear-gradient内部第一个参数是方向,这里是从上到下。
后面的参数是颜色和颜色节点。
如果两个相邻的颜色节点之间,百分比相同,则颜色在该节点直接改变的,没有渐变效果。
如果两个相邻的颜色节点之间,百分比不同,则颜色在两个百分比节点之间渐变。
上面的代码对第一个内部div设置了渐变,从上到下,0%-30%透明,30%颜色变为#62a8fb,30%-60%颜色为#62a8fb,60%时颜色变为#5778d9。

使用线性渐变设置剩下的内部div。
.bargraph div:nth-child(2)
    background: linear-gradient(to bottom, transparent 74%, #62a8fb 74%, #62a8fb 89%, #5778d9 89%);

.bargraph div:nth-child(3)
    background: linear-gradient(to bottom, transparent 55%, #62a8fb 55%, #62a8fb 83%, #5778d9 83%);

.bargraph div:nth-child(4)
    background: linear-gradient(to bottom, transparent 65%, #62a8fb 65%, #62a8fb 83%, #5778d9 83%);

.bargraph div:nth-child(5)
    background: linear-gradient(to bottom, transparent 45%, #62a8fb 45%, #62a8fb 73%, #5778d9 73%);

2 css+html绘制饼图
绘制饼图就更加简单了。
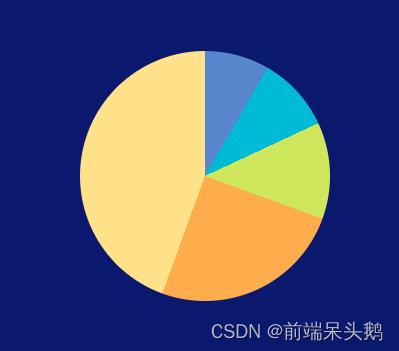
这里也是使用渐变实现,不过是圆锥渐变。
还是先写一个超简单的html文件,简单到只有一行代码。
<div class="piegraph"></div>
我们将这个div设置为圆形:给它一个宽和高度再设置圆角。
为了方便观察,这里也给它加一个背景色。
body
    background-color: #0f117c;

.piegraph
    width: 250px;
    height: 250px;
    border-radius: 50%;
    background-color: antiquewhite;

制作饼图用到圆锥渐变,我们前面讲到线性渐变,是向一个方向成直线渐变。
而圆锥渐变的起始点是图形中心,然后以顺时针方向绕中心实现渐变效果。
由于方向固定(顺时针方向),圆锥渐变省略了固定方向的参数。
圆锥渐变的参数组合和线性渐变类似,只是颜色后面不是百分比,而是角度。
代码如下:
.piegraph
    ...
    background: conic-gradient(#668fd5 30deg, #2dc2dc 30deg, #2dc2dc 65deg, #d4ec59 65deg, #d4ec59 110deg, #fcb74d 110deg, #fcb74d 200deg, #fde78d 200deg);

2 css+html绘制折现图
用 HTML 和 CSS 也可以实现折线图。
折线图的线由角度不同的线段拼接而成,我们可以通过高度很小的div元素来模拟线条。然后用 transform 改变角度和位置。
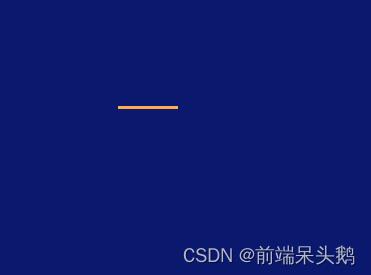
首先我们先画一条线段。
一个超简单的html。
<div class="bar">
    <div class="piegraph"></div>
</div>
定义这个线段的宽高和背景色。
body
    background-color: #0f117c;

.piegraph
    width: 60px;
    height: 3px;
    background-color: #fcb74d;

我们可以通过transform: rotate()调整线段的角度,通过position调整线段的位置。
让不同角度的线段拼接起来形成折线图。
我们修改html,添加多个线段。
<div class="bar">
    <div class="piegraph"></div>
    <div class="piegraph"></div>
    <div class="piegraph"></div>
    <div class="piegraph"></div>
    <div class="piegraph"></div>
</div>
修改多个线段的角度,长度和位置。
.piegraph:nth-child(1)
    transform: rotate(-60deg);

.piegraph:nth-child(2)
    transform: rotate(2deg);
    position: relative;
    top: -23px;
    left: -17px;
    width: 60px;

.piegraph:nth-child(3)
    transform: rotate(-60deg);
    position: relative;
    top: -46px;
    left: -34px;

.piegraph:nth-child(4)
    transform: rotate(39deg);
    position: relative;
    top: -42px;
    left: -59px;
    width: 100px;

.piegraph:nth-child(5)
    transform: rotate(2deg);
    position: relative;
    top: -10px;
    left: -71px;
    width: 80px;

.bar
    display: flex;
    margin: 200px;

</style>

以上是关于简单实用:css+html绘制常见图表的主要内容,如果未能解决你的问题,请参考以下文章