(十五)ArcGIS API For Javascript之地图输出
Posted GISer.Wang
tags:
篇首语:本文由小常识网(cha138.com)小编为大家整理,主要介绍了(十五)ArcGIS API For Javascript之地图输出相关的知识,希望对你有一定的参考价值。
文章目录
1.引言
在WebGIS中地图输出是一个比较常用的功能,当我们制图结束时,往往要将我们的地图打印成一张图片保存起来,在ArcGIS API要想实现地图打印,需要借助PrintingTools工具,此工具实质上是一个GP工具,因为是GP工具,所以地图的生成是在服务器端生成的,也可以叫做服务器端打印.
服务器端打印的执行对象是 PrintTask,打印的参数是 PrintParameters,通过设置打印模板对象PrintTemplate,可以对图片的大小,像素,格式等进行设置,
2.启用PrintingTools 工具
PrintingTools 和几何服务一样,默认情况下是关闭的,我们应当开启此工具
- 默认情况下关闭
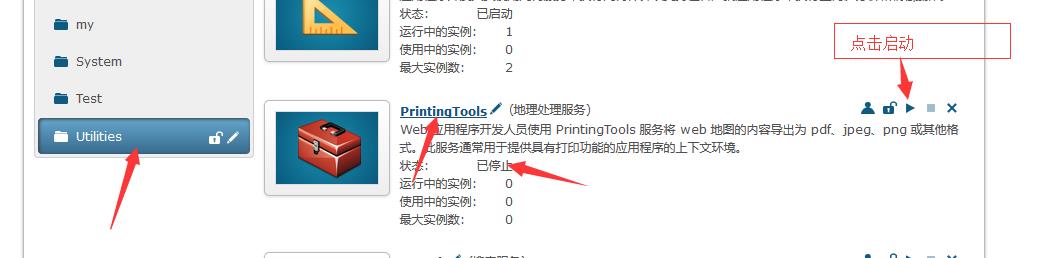
- 启动成功

- 要使用的URL
http://localhost:6080/arcgis/rest/services/Utilities/PrintingTools/GPServer/Export%20Web%20Map%20Task
3.使用PrintingTools 打印地图
3.1代码实现
- 加载地图(略)
- 添加两个按钮(一个按钮用于画polygon,一个按钮用于地图打印)
    <button class="pbtn" >画多边形</button>
    <input id="Btn" type="button" value="地图打印" />
- 创建相关对象(例如:绘图对象,符号对象)
				//创建绘图对象
                var toolBar = new Draw(map);
                //线符号
                lineSymbol = new SimpleLineSymbol(SimpleLineSymbol.STYLE_DASH, new Color([255, 0, 0]), 3);
                //面符号
                polygonSymbol = new SimpleFillSymbol(SimpleFillSymbol.STYLE_SOLID, lineSymbol, new Color([255, 0, 0, 0.25]));
- 给绘制多边形按钮绑定事件
				//给绘制polygon的按钮绑定事件
				query(".pbtn").on("click",function(event)
					//激活绘制多边形
					toolBar.activate(Draw.POLYGON,
                        showTooltips:true
                    )

				)
				//绘图结束绑定事件
				on(toolBar,"draw-end",function(result)
					//获得面形状
					var geometry=result.geometry;
					//创建Graphic
					var graphicpoint= new Graphic(geometry, polygonSymbol);
                    map.graphics.add(graphicpoint);
					//关闭绘图工具
                    toolBar.deactivate();
				)
- 给地图打印按钮绑定事件
				//给地图打印按钮绑定事件
                on(dom.byId("Btn"),"click",function()
					//创建地图打印对象
					var printMap = new PrintTask("http://localhost:6080/arcgis/rest/services/Utilities/PrintingTools/GPServer/Export%20Web%20Map%20Task");
					//创建地图打印模版
					var template = new PrintTemplate();
					//创建地图的打印参数,参数里面包括:模版和地图
					var params = new PrintParameters();
					//输出图片的空间参考
					printMap.outSpatialReference = map.SpatialReference
					//打印图片的各种参数
					template.exportOptions =
						width: 850,
						height: 650,
						dpi: 96
					;
					//打印输出的格式
					template.format = "PDF";
					//输出地图的布局
					template.layout = "MAP_ONLY";
					PrintTemplate
					//设置参数地图
					params.map = map;
					//设置参数模版
					params.template = template;
					//运行结果
					printMap.execute(params, function(result)
						if (result != null)
							//网页打开生成的地图
							window.open(result.url);

					)
				)
3.2运行结果
- 地图

- 打印结果

3.3全部代码
<!DOCTYPE html>
<html xmlns="http://www.w3.org/1999/xhtml">
<head>
<meta http-equiv="Content-Type" content="text/html; charset=utf-8"/>
    <title>地图打印</title>
    <link  rel="stylesheet"  type="text/css" href="http://localhost/arcgis_js_api/library/3.17/3.17/dijit/themes/tundra/tundra.css"/>
    <link  rel="stylesheet"  type="text/css" href="http://localhost/arcgis_js_api/library/3.17/3.17/esri/css/esri.css" />
    <script  type="text/javascript" src="http://localhost/arcgis_js_api/library/3.17/3.17/init.js"></script>
    <style type="text/css">
        .MapClass
            width:100%;
            height:500px;
            border:1px solid #000;

    </style>
    <script type="text/javascript">

        require(["esri/map",
			"dojo/dom","dojo/on","dojo/query",
            "esri/layers/ArcGISDynamicMapServiceLayer",
            "esri/symbols/SimpleMarkerSymbol",
            "esri/symbols/SimpleLineSymbol",
            "esri/symbols/SimpleFillSymbol",
            "esri/toolbars/draw",
            "esri/graphic",
            "esri/tasks/PrintTask",
			"esri/tasks/PrintTemplate",
			"esri/tasks/PrintParameters",
			"dojo/colors",
            "dojo/domReady!"],
            function (Map,dom,on,query,
                ArcGISDynamicMapServiceLayer,
                SimpleMarkerSymbol,
                SimpleLineSymbol,
                SimpleFillSymbol,
                Draw,
                Graphic,
                PrintTask,PrintTemplate,PrintParameters,
                Color)
                var map = new esri.Map("mapDiv");
                var layer = new esri.layers.ArcGISDynamicMapServiceLayer
                ("http://localhost:6080/arcgis/rest/services/Test/ft/MapServer");
                map.addLayer(layer);
				//创建绘图对象
                var toolBar = new Draw(map);
                //线符号
                lineSymbol = new SimpleLineSymbol(SimpleLineSymbol.STYLE_DASH, new Color([255, 0, 0]), 3);
                //面符号
                polygonSymbol = new SimpleFillSymbol(SimpleFillSymbol.STYLE_SOLID, lineSymbol, new Color([255, 0, 0, 0.25]));

				//给绘制polygon的按钮绑定事件
				query(".pbtn").on("click",function(event)
					//激活绘制多边形
					toolBar.activate(Draw.POLYGON,
                        showTooltips:true
                    )

				)
				//绘图结束绑定事件
				on(toolBar,"draw-end",function(result)
					//获得面形状
					var geometry=result.geometry;
					//创建Graphic
					var graphicpoint= new Graphic(geometry, polygonSymbol);
                    map.graphics.add(graphicpoint);
					//关闭绘图工具
                    toolBar.deactivate();
				)
				//给地图打印按钮绑定事件
                on(dom.byId("Btn"),"click",function()
					//创建地图打印对象
					var printMap = new PrintTask("http://localhost:6080/arcgis/rest/services/Utilities/PrintingTools/GPServer/Export%20Web%20Map%20Task");
					//创建地图打印模版
					var template = new PrintTemplate();
					//创建地图的打印参数,参数里面包括:模版和地图
					var params = new PrintParameters();
					//输出图片的空间参考
					printMap.outSpatialReference = map.SpatialReference
					//打印图片的各种参数
					template.exportOptions =
						width: 850,
						height: 650,
						dpi: 96
					;
					//打印输出的格式
					template.format = "PDF";
					//输出地图的布局
					template.layout = "MAP_ONLY";
					PrintTemplate
					//设置参数地图
					params.map = map;
					//设置参数模版
					params.template = template;
					//运行结果
					printMap.execute(params, function(result)
						if (result != null)
							//网页打开生成的地图
							window.open(result.url);

					)
				)

            );
    </script>
</head>
<body>
    <div id="mapDiv" class="MapClass"></div>
	<button class="pbtn" >画多边形</button>
    <input id="Btn" type="button" value="地图打印" />
</body>
</html>
4.代码下载地址
- GitHub的数据及代码下载地址为:GitHub的数据及代码下载链接(如果从GitHub下载代码,麻烦给小
Demo一个Star,您的支持是我最大的动力)
以上是关于(十五)ArcGIS API For Javascript之地图输出的主要内容,如果未能解决你的问题,请参考以下文章