MATLAB | MATLAB海洋气象数据colormap配色补充包(NCL color tables)
Posted slandarer
tags:
篇首语:本文由小常识网(cha138.com)小编为大家整理,主要介绍了MATLAB | MATLAB海洋气象数据colormap配色补充包(NCL color tables)相关的知识,希望对你有一定的参考价值。
众所周知,海洋、气象、水文等一系列学科绘制图像时,因很多时候涉及要将陆地海洋分开或者应对一些非常特殊的情况,因此有很多非常特别的colormap,我之前虽然做过一些常用colormap的补充包但是依旧是无法完全应对各种特殊的colormap,
而NCL(The NCAR Command Language)是一种专门为科学数据处理以及数据可视化设计的高级语言,很适合用在气象数据的处理和可视化上。该语言内置了一系列非常适合气象数据的colormap,于是我将其也做出了一个MATLAB colormap补充包!!


前言及所作工作
先说明如果不适用该补充包如何获取颜色数据,颜色数据是从官网:
- https://www.ncl.ucar.edu/Document/Graphics/color_tables.shtml
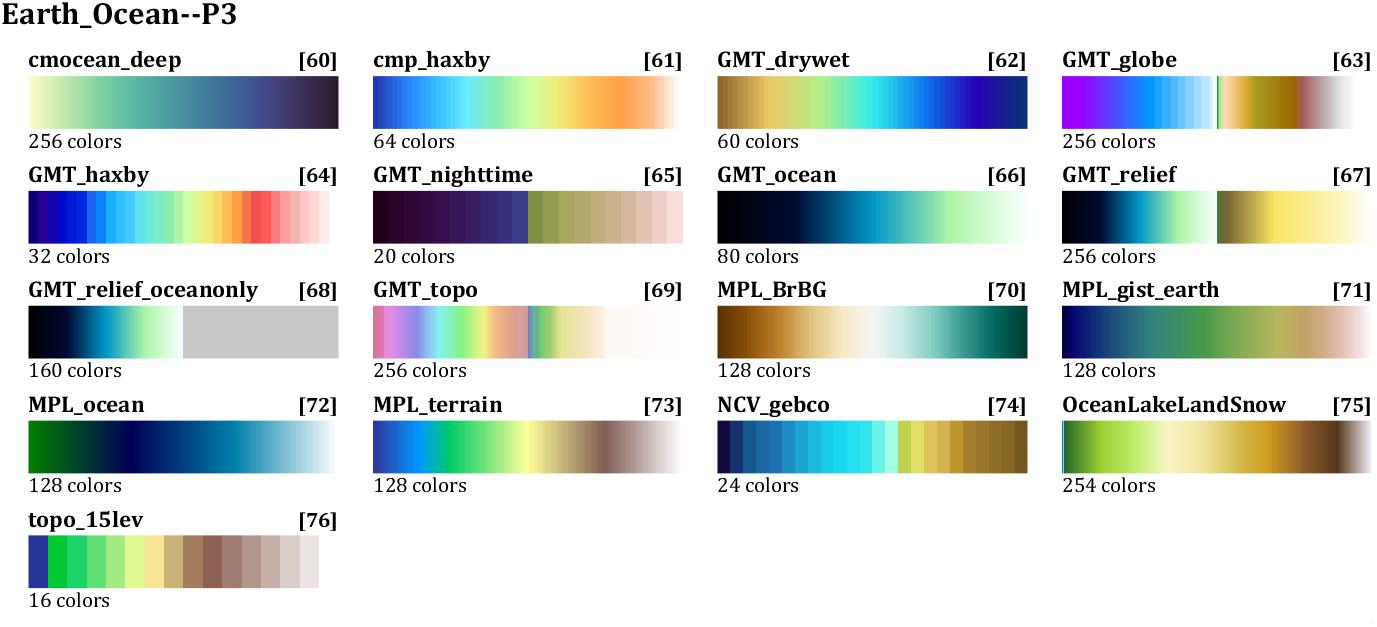
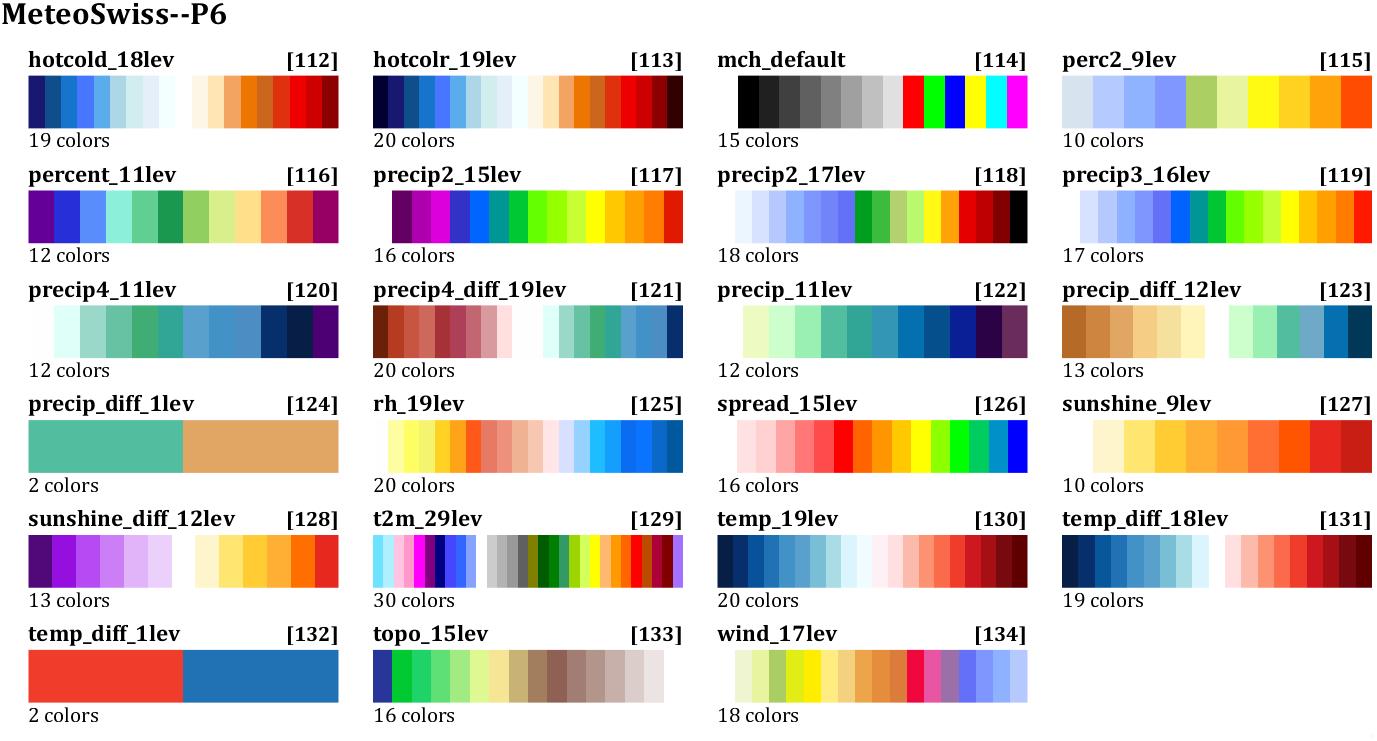
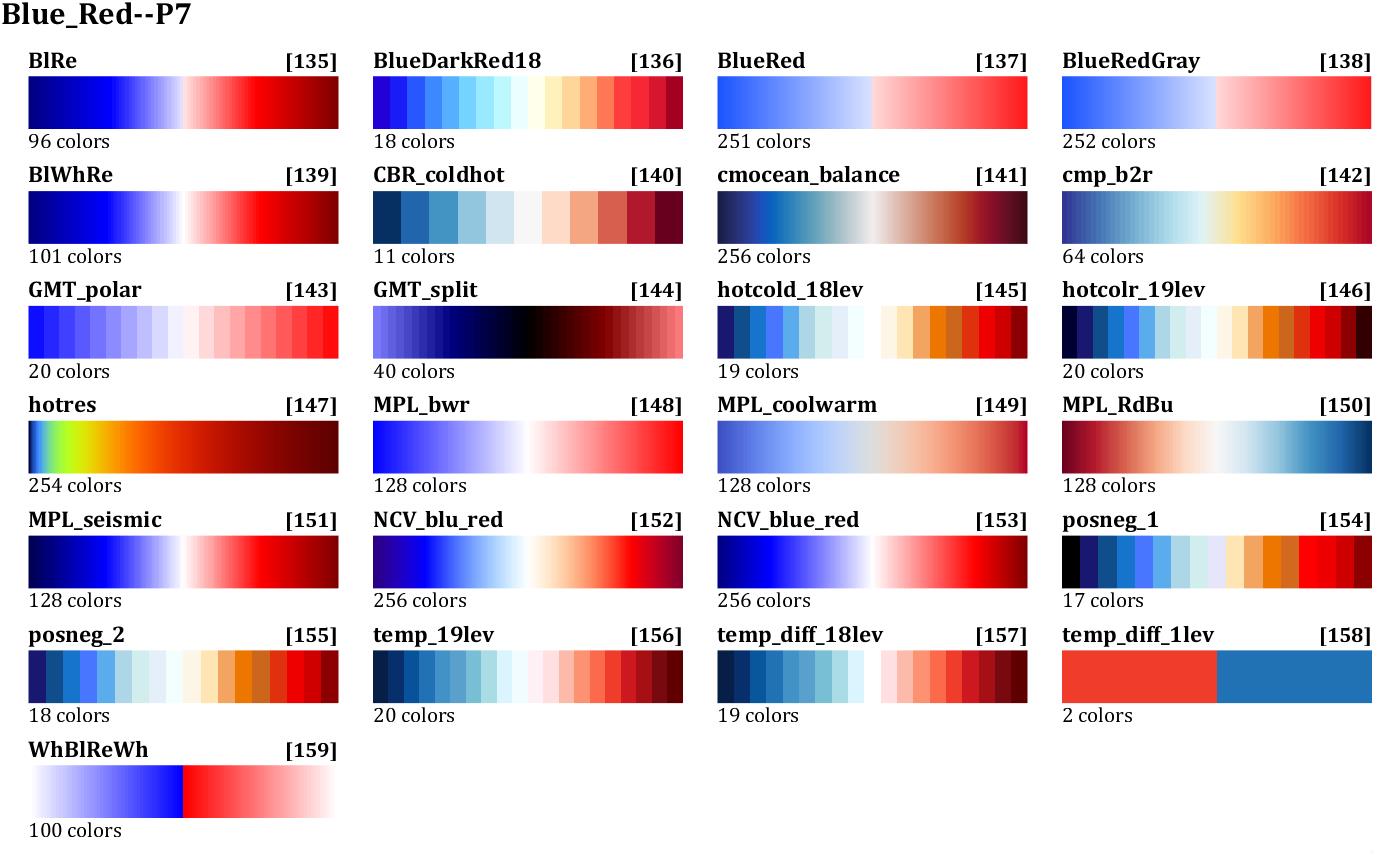
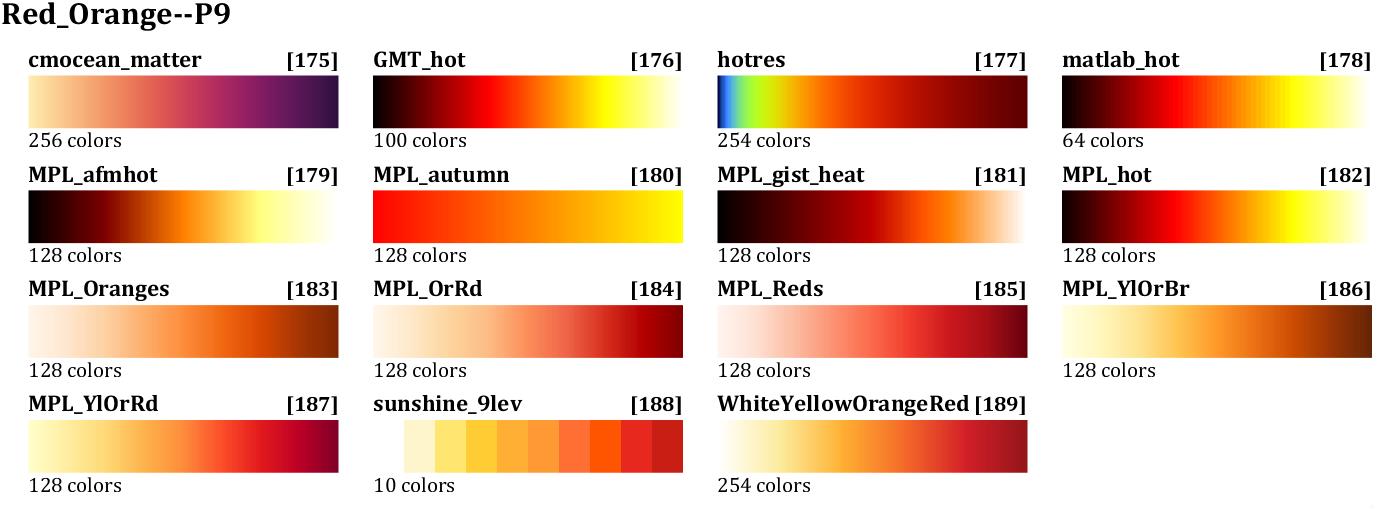
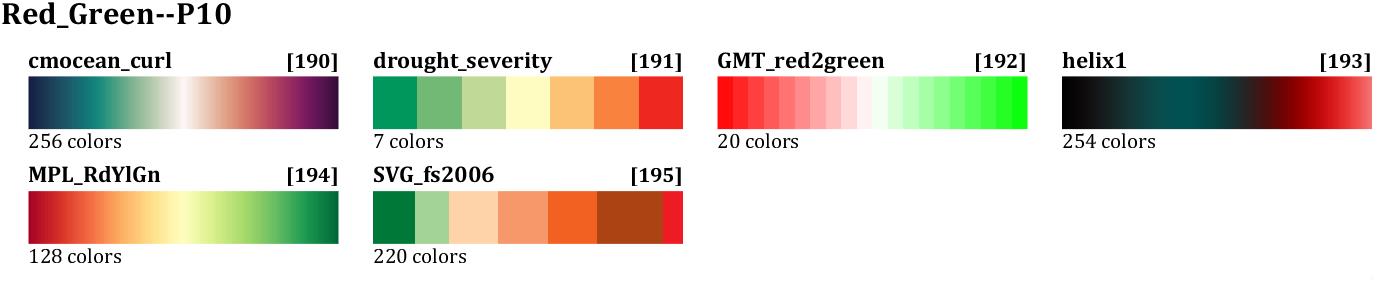
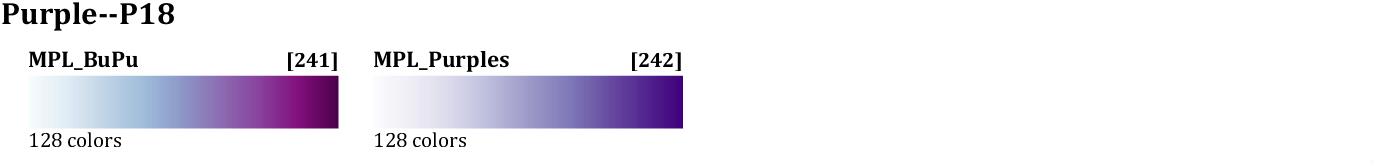
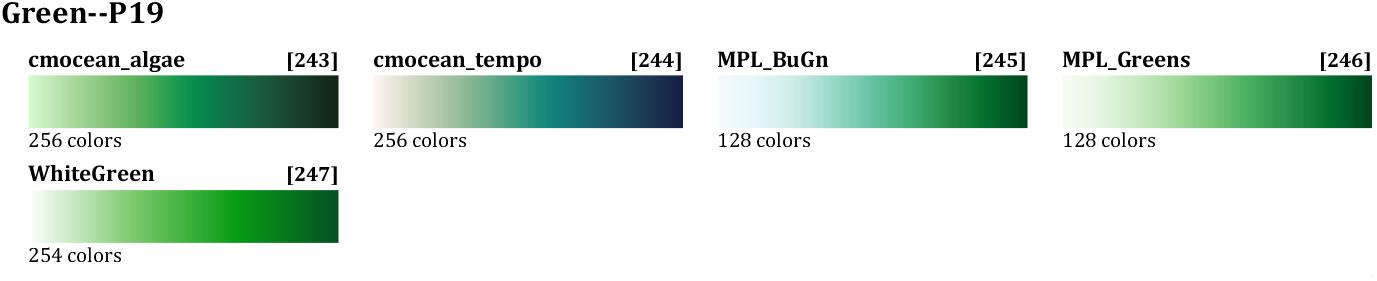
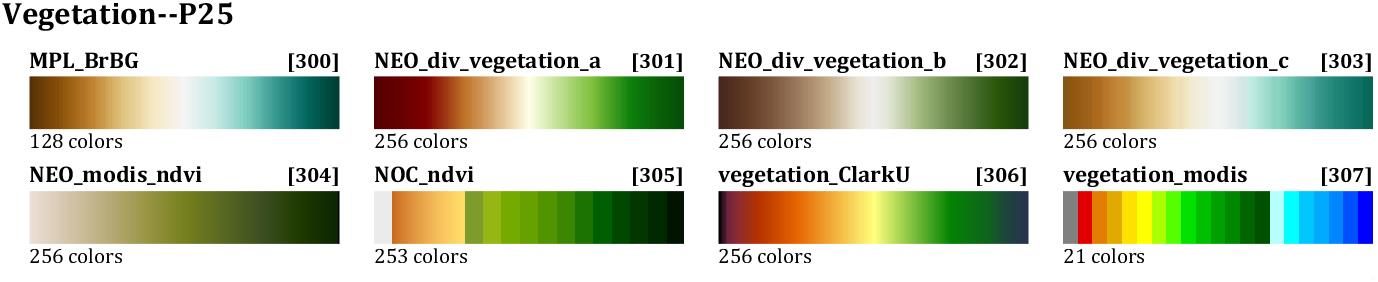
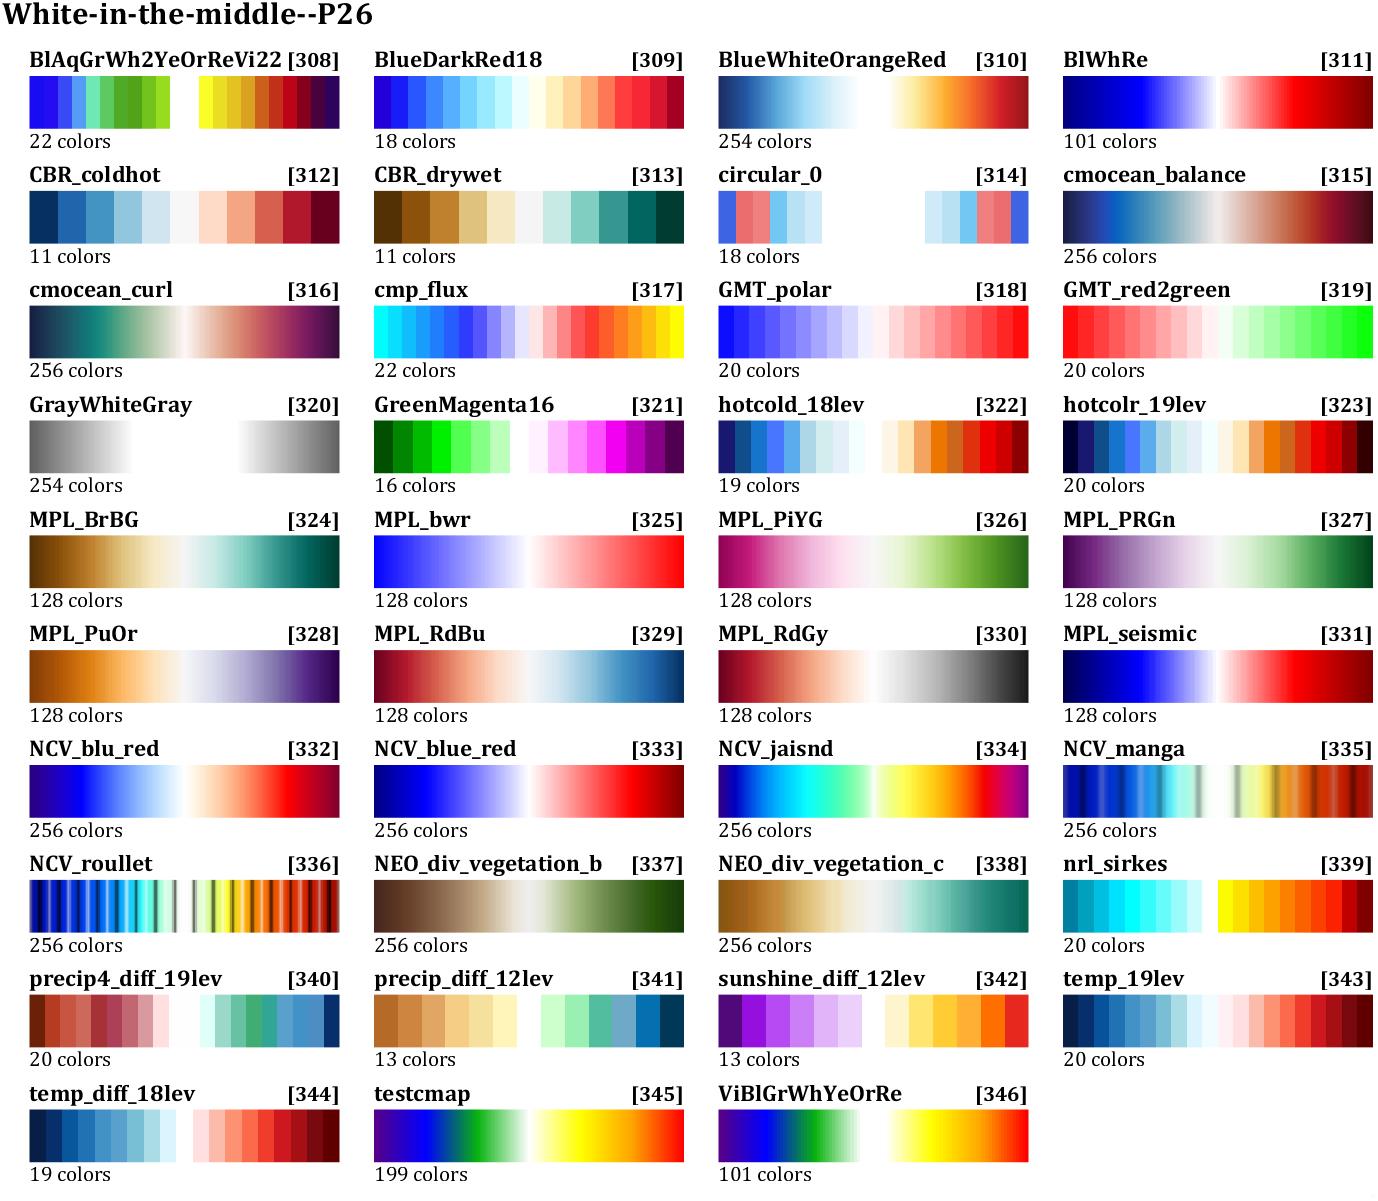
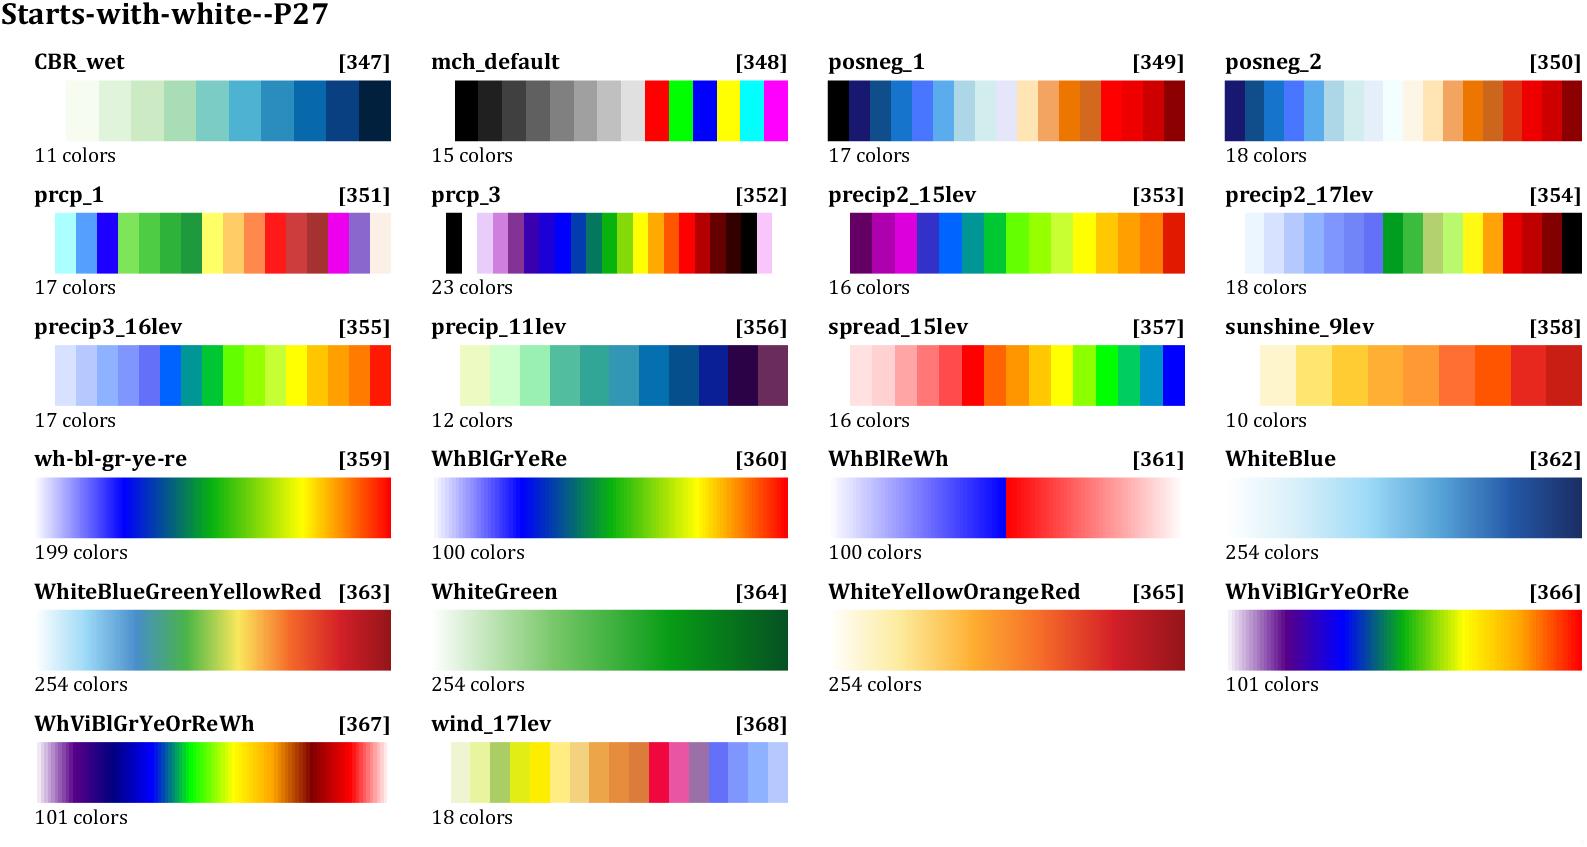
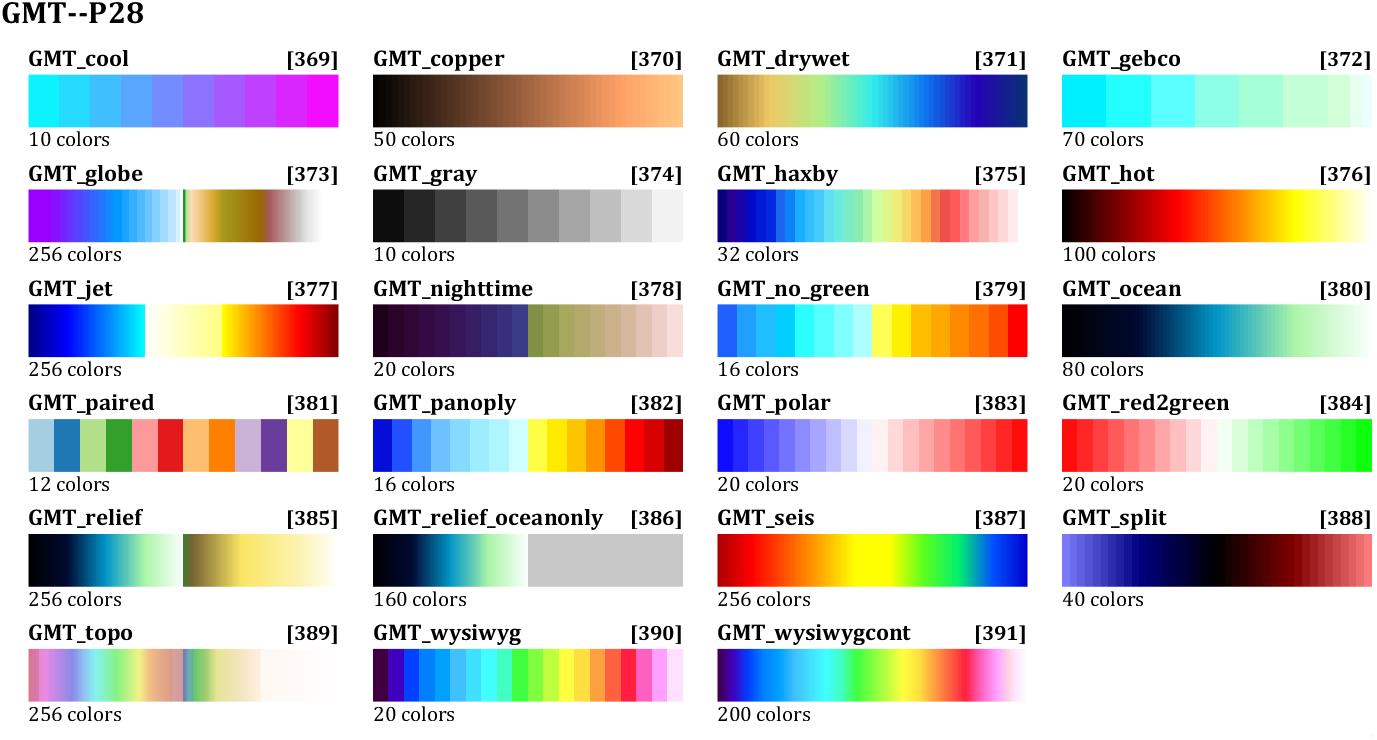
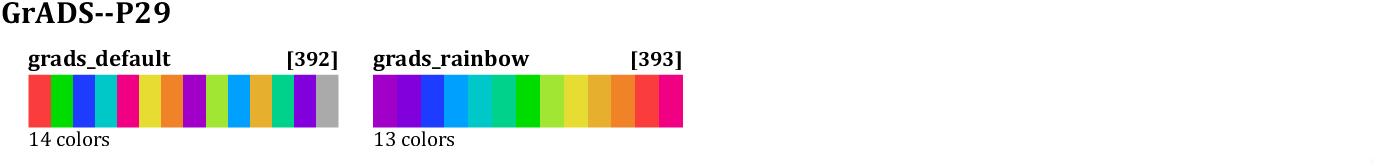
获取的,该网址将内置colormap按照颜色特点做出了33个分类(例如:左侧白色,彩虹色,海洋山脉色,偏蓝色,偏绿色):
若是随便点开一个颜色就能进入该颜色展示界面:

之后点击新界面的.rgb链接就可以下载文件:

文件是.rgb格式,其实可以直接改为.txt进行读取,但是下载的颜色数据非常乱,有的需要删掉注释,有的是0-255范围有的是0-1范围:
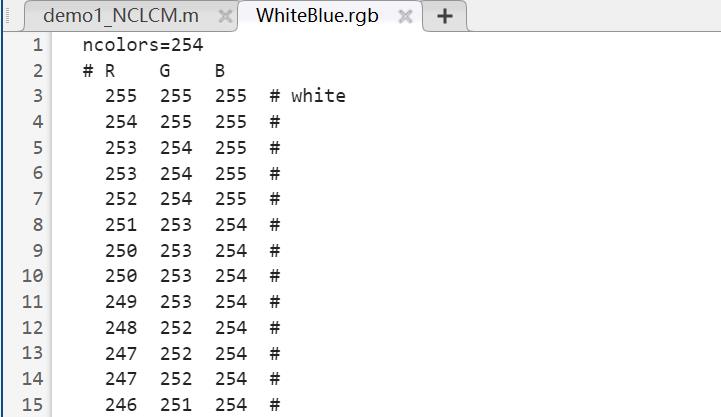
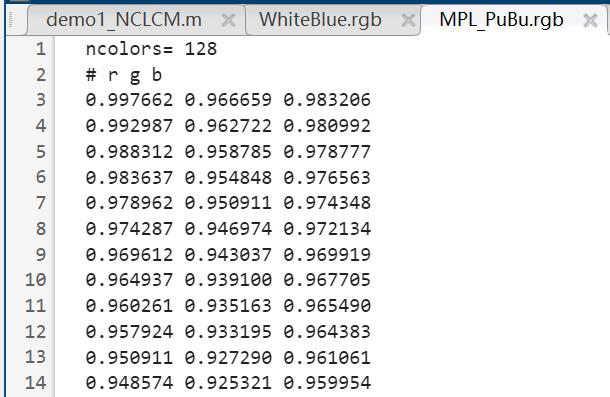
而且每次都要去下载太麻烦了,于是我直接用MATLAB写了个p虫,先把txt格式都pa了下来:
function getNCL
% @author: slandarer
main_forder_name='NCL_RGB';
main_website_path='https://www.ncl.ucar.edu/Document/Graphics/color_table_gallery.shtml#SVG';
if ~exist(main_forder_name,'dir')
   mkdir(main_forder_name);
end

% 获取每一个面板位置
main_content=webread(main_website_path);
class_sep=[regexpi(main_content,'<a name='),length(main_content)];

classNamelength(class_sep)-1='';
colorNamelength(class_sep)-1='';
for i=1:length(class_sep)-1
    class_content=main_content(class_sep(i):class_sep(i+1));

    % 获取各类名称
    class_begin=10;
    class_end=regexpi(class_content,'></a>');
    class_name=class_content(class_begin:class_end(1)-2);
    classNamei=class_name;
    class_forder_name=['NCL_RGB\\',class_name];
    if ~exist(class_forder_name,'dir')
        mkdir(class_forder_name);
    end

    % 获取每个示意图名称
    img_begin=regexpi(class_content,'Images/');
    img_end=regexpi(class_content,'_labelbar');

    % 循环获取颜色
    tColorNameCell=;
    disp(' ')
    for j=1:length(img_begin)
        color_name=class_content(img_begin(j)+7:img_end(j)-1);
        tColorNameCellj=color_name;
        color_website_path=['https://www.ncl.ucar.edu/Document/Graphics/ColorTables/Files/',color_name,'.rgb'];
        disp(['正在获取','Class(',num2str(i),')[',class_name,']->Color(',num2str(j),')[',color_name,']'])
        websave([class_forder_name,'\\',color_name,'.txt'],color_website_path);
    end
    colorNamei=tColorNameCell;
end
% save nclCM_Name.mat className colorName
end
之后经过一系列整合,终于有了此补充包。
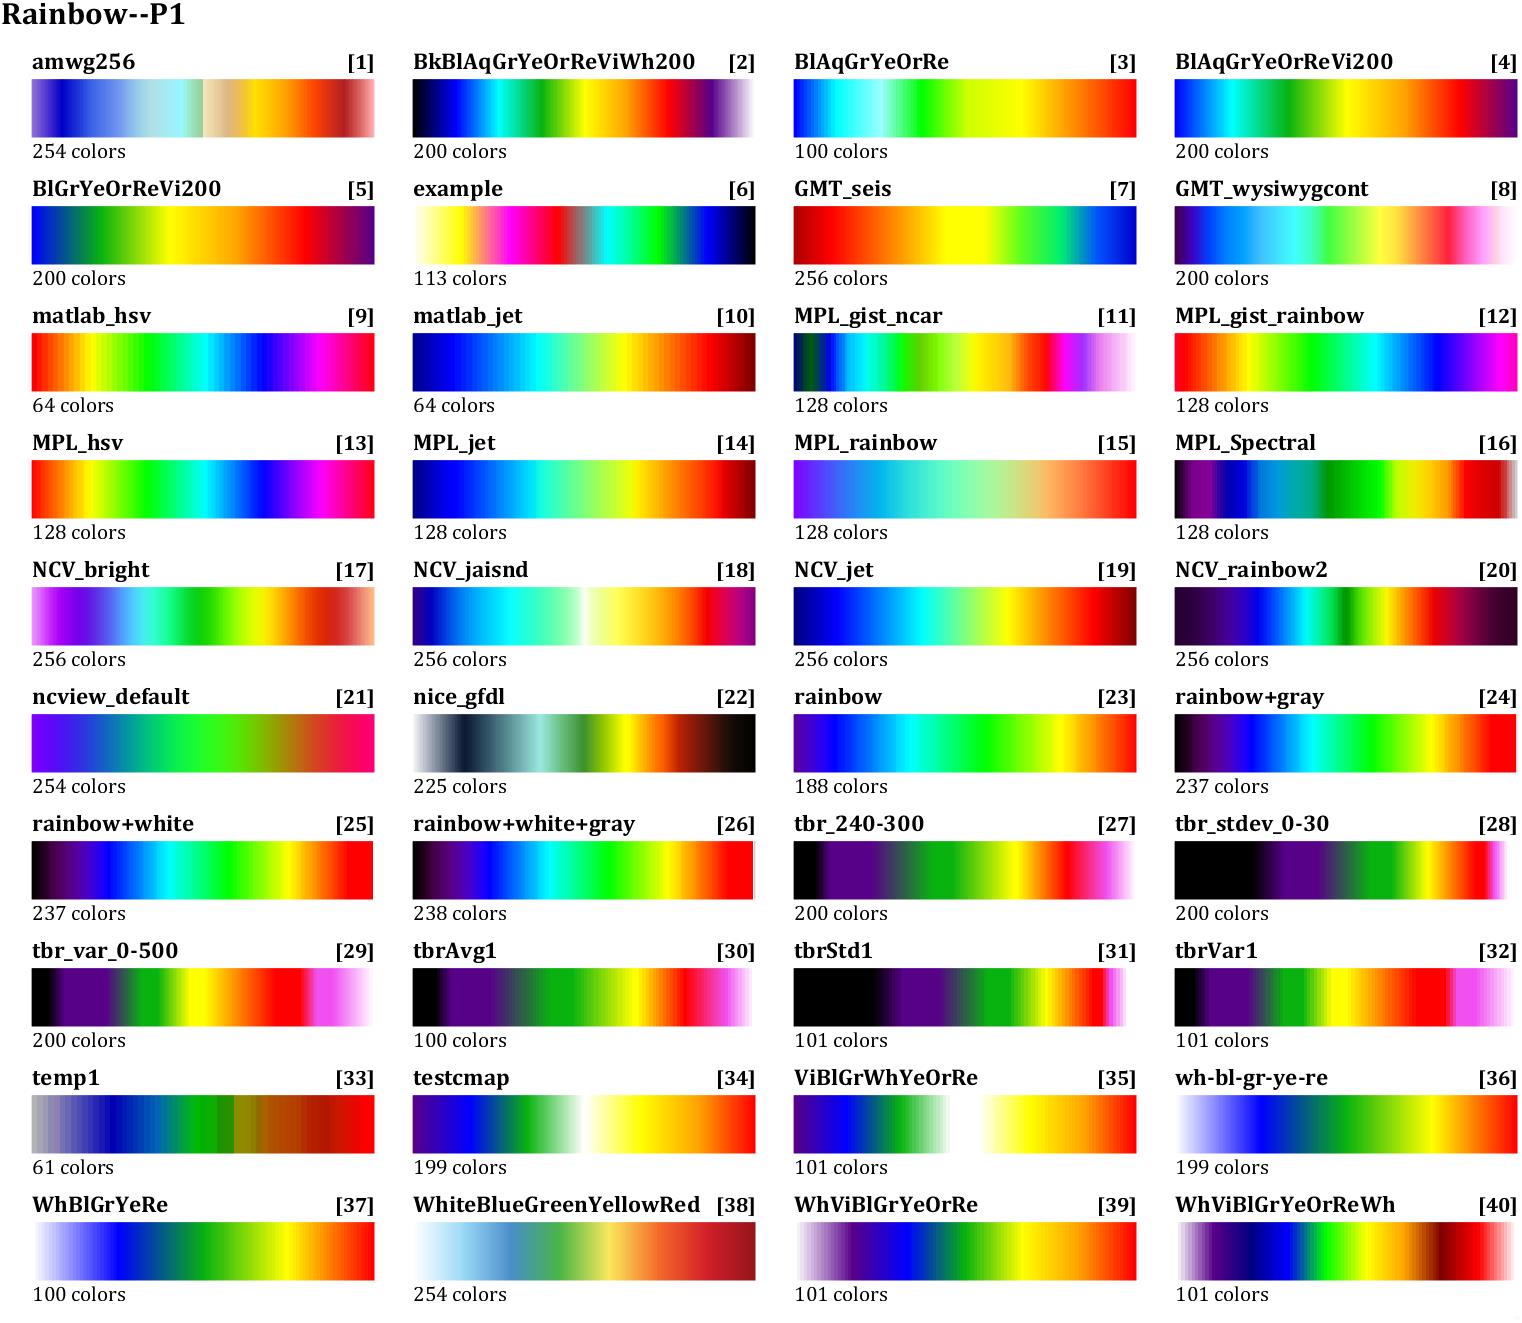
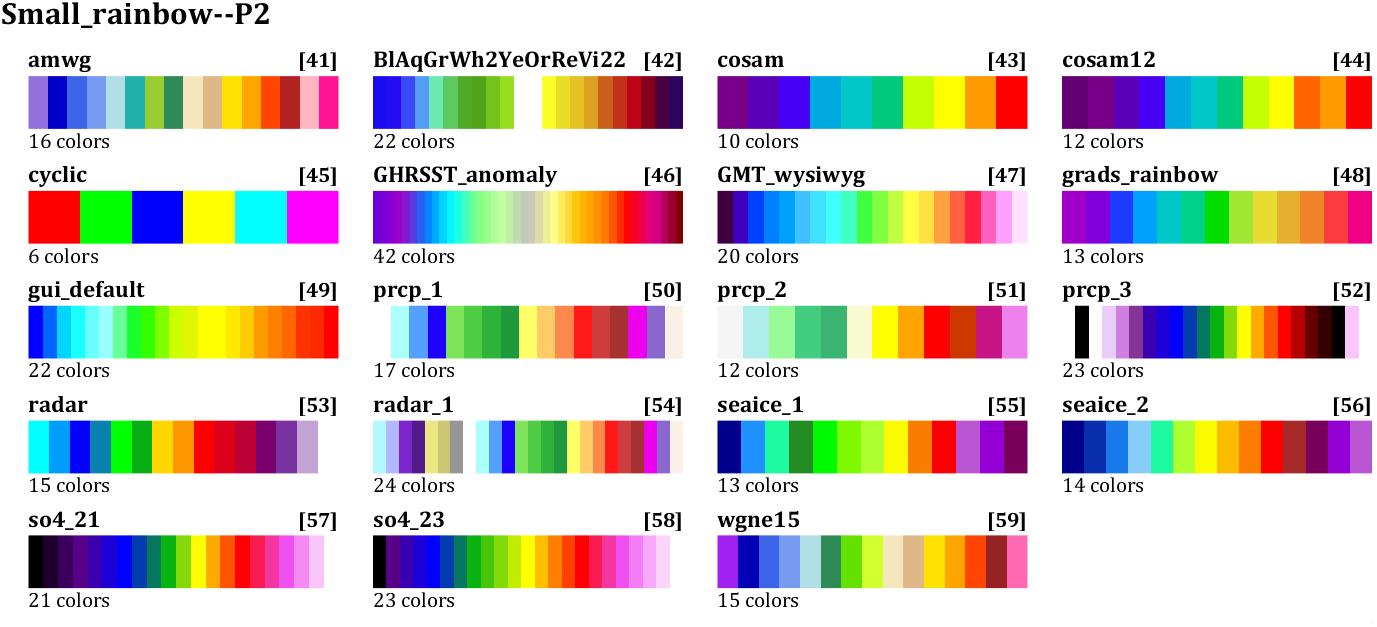
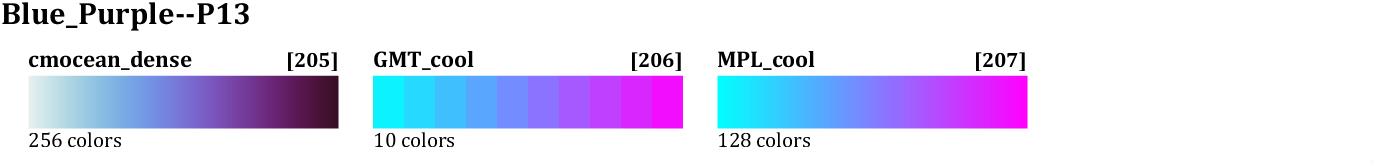
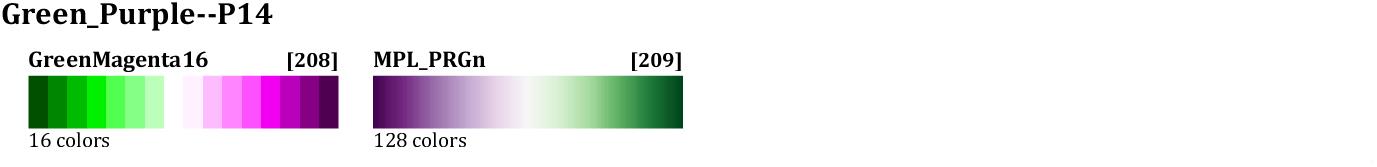
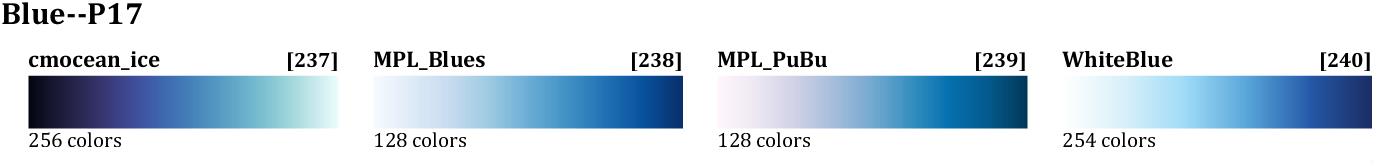
颜色展示


使用方法
不指定获取颜色个数会默认返回长度为图示每个colormap左下角颜色数的颜色,每种colormap和一个右上角序号相对应。
举例获取[190]号cmocean_curl颜色,只输入一个参数返回的颜色长度就为256,以下两种写法等价:
- nclCM(‘cmocean_curl’)
- nclCM(190)
第二个参数可以指定获取颜色数量,例如获取30个颜色:
- nclCM(‘cmocean_curl’,30)
- nclCM(190,30)
将获取的颜色放入colormap函数或者某些图像的CData即可,例如:
- colormap(nclCM(‘cmocean_curl’))
需要注意的是,为了更好的分类,有一两个颜色在不同类别多次出现,因此更推荐使用序号调用。
使用实例
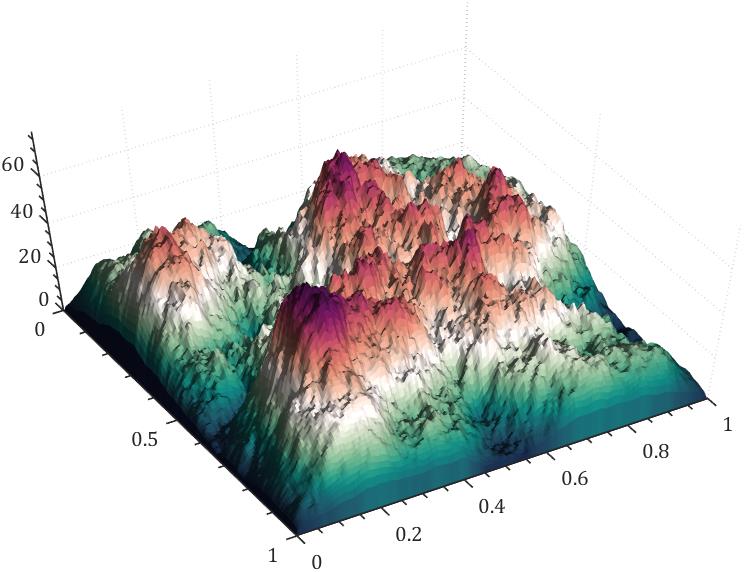
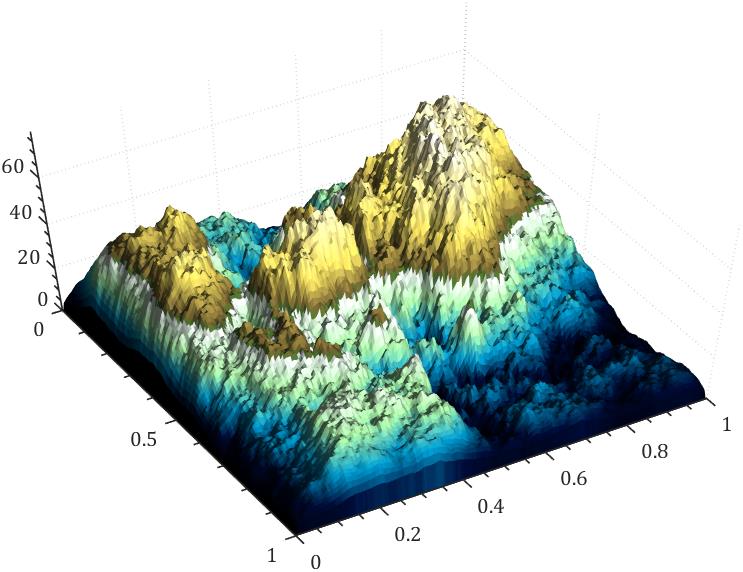
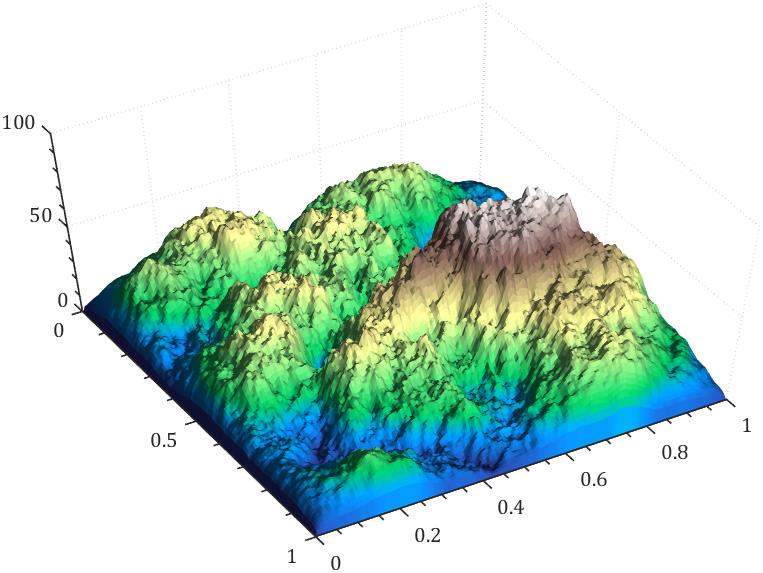
demo1 随机生成曲面
使用cmocean_curl配色,200个颜色:
% demo1
X=linspace(0,1,200)';
CL=(-cos(X*2*pi)+1).^.2;
r=(X-.5)'.^2+(X-.5).^2;
surf(X,X',abs(ifftn(exp(7i*rand(200))./r.^.9)).*(CL*CL')*30,'EdgeColor','none')

% 67 458 190
colormap(nclCM('cmocean_curl',200))
light
material dull
view(59.1823,56.1559)

% 修饰一下
ax=gca;
ax.Projection='perspective';
ax.LineWidth=.8;
ax.XMinorTick='on';
ax.YMinorTick='on';
ax.ZMinorTick='on';
ax.GridLineStyle=':';
ax.FontName='Cambria';
当然第一个参数也可以换成序号190或者其他序号:

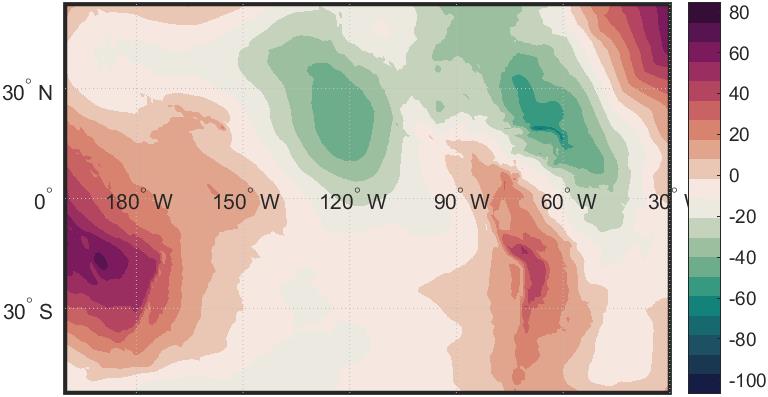
demo2 大地水准面高度
此demo需要mapping toolbox,不过在这只是为了展示换colormap,其他工具箱例如m_map也差不多类似的操作:
% demo2
% 需要mapping toolbox
% 大地水准面高度数导入
load geoid60c.mat

% 创建某经纬度范围世界地图坐标区域
latlim=[-50 50];
lonlim=[160 -30];
ax=worldmap(latlim,lonlim);


geoshow(ax,geoid60c,geoid60cR,'DisplayType','surface')
% 205 190 215
colormap(nclCM(215,20))
% colormap(nclCM(335,100))
colorbar


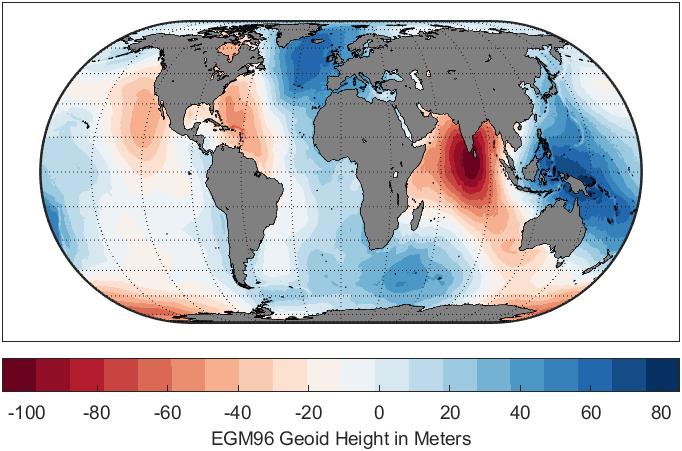
demo3 全球大地水准面高度
% demo3
% 需要mapping toolbox
[N,R] = egm96geoid;
axesm eckert4
Z=zeros(R.RasterSize);
geoshow(N,R,'DisplayType','surface','CData',N,'ZData',Z)
framem;gridm

% 215 190 150
% colormap(nclCM(215,20))
colormap(nclCM(150,20))
cb=colorbar('southoutside');
cb.Label.String = 'EGM96 Geoid Height in Meters';
geoshow('landareas.shp','FaceColor',[.5,.5,.5])


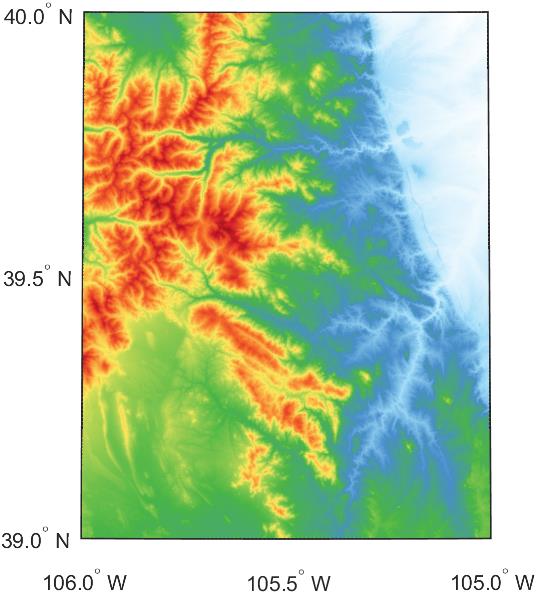
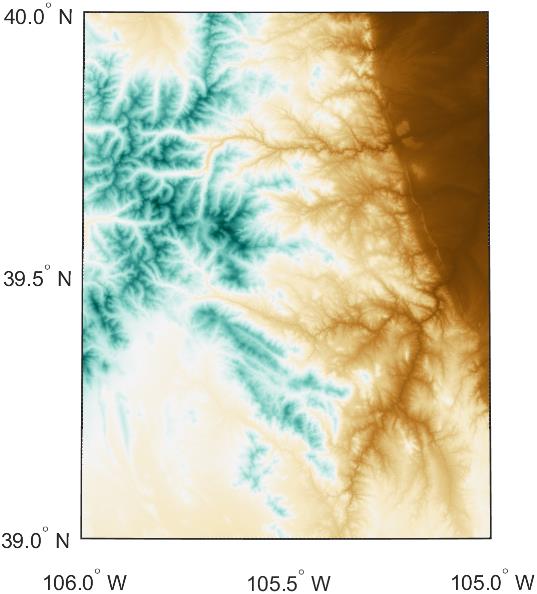
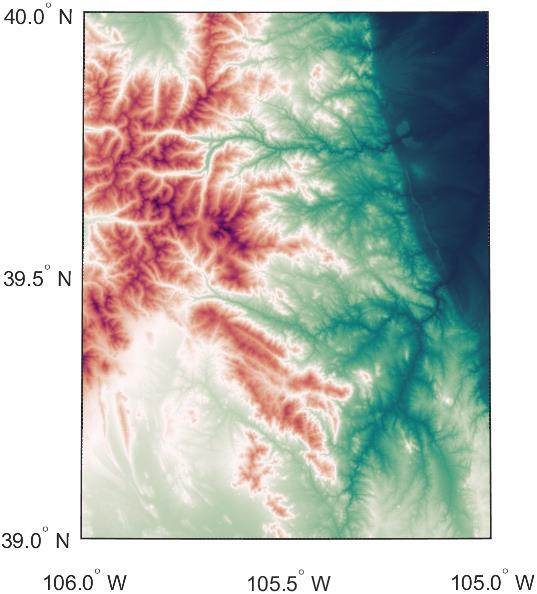
demo4 高程数据
% demo4
% 需要mapping toolbox
[Z,R]=readgeoraster('n39_w106_3arc_v2.dt1','OutputType','double');

key.GTModelTypeGeoKey  = 2;
key.GTRasterTypeGeoKey = 2;
key.GeographicTypeGeoKey = 4326;

filename='southboulder.tif';
geotiffwrite(filename,Z,R,'GeoKeyDirectoryTag',key)

usamap([39 40],[-106 -105])
g=geoshow(filename,'DisplayType','mesh');

% 190 300 363
colormap(nclCM(15,200))

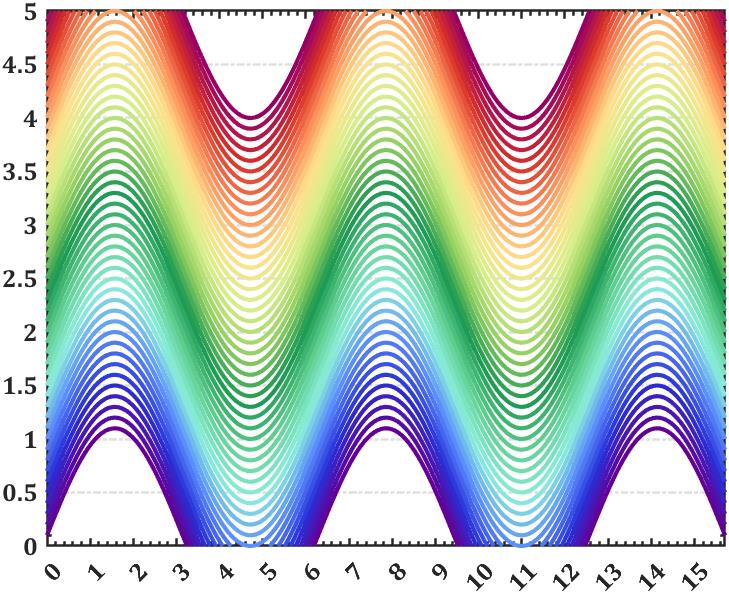
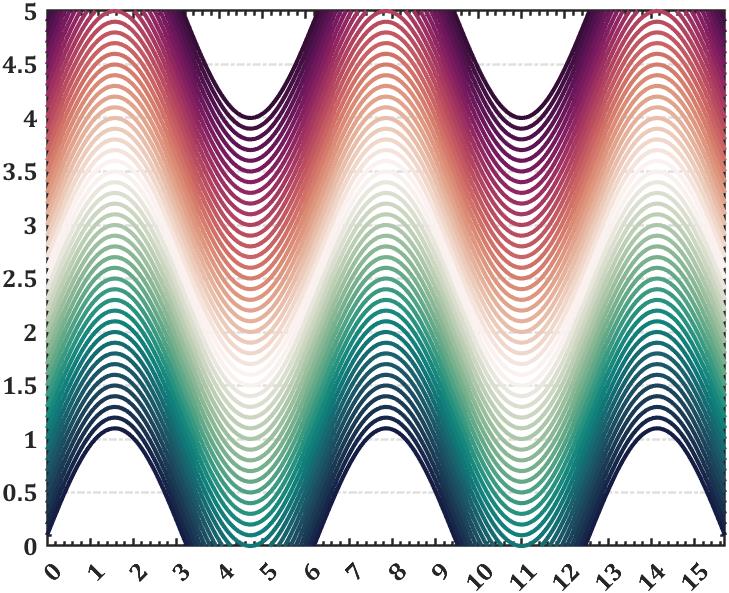
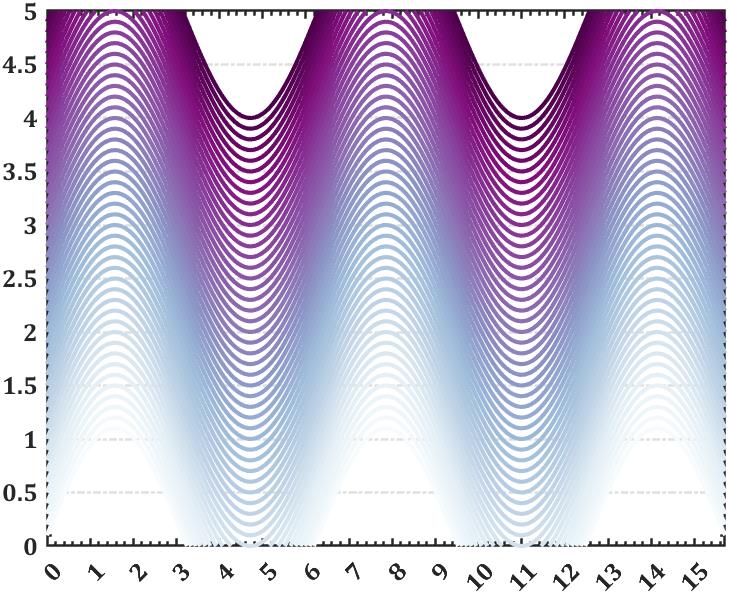
demo5 曲线赋色
% demo5
t=linspace(0,5*pi,200);

% 116 190 402 162
C=nclCM(15,50);
ax=gca;hold on
for i=1:50
    plot(t,sin(t)+i.*.1,'Color',C(i,:),'LineWidth',2);
end

% 坐标区域修饰
ax.YLim=[0,5];
ax.XLim=[0,5*pi];
ax.YTick=0:.5:5;
ax.XTick=0:1:15;
% ax.XGrid='on';
ax.YGrid='on';
ax.GridLineStyle='-.';
ax.LineWidth=1.2;
ax.XMinorTick='on';
ax.YMinorTick='on';
ax.Box='on';
ax.FontName='Cambria';
ax.FontWeight='bold';
ax.FontSize=12;

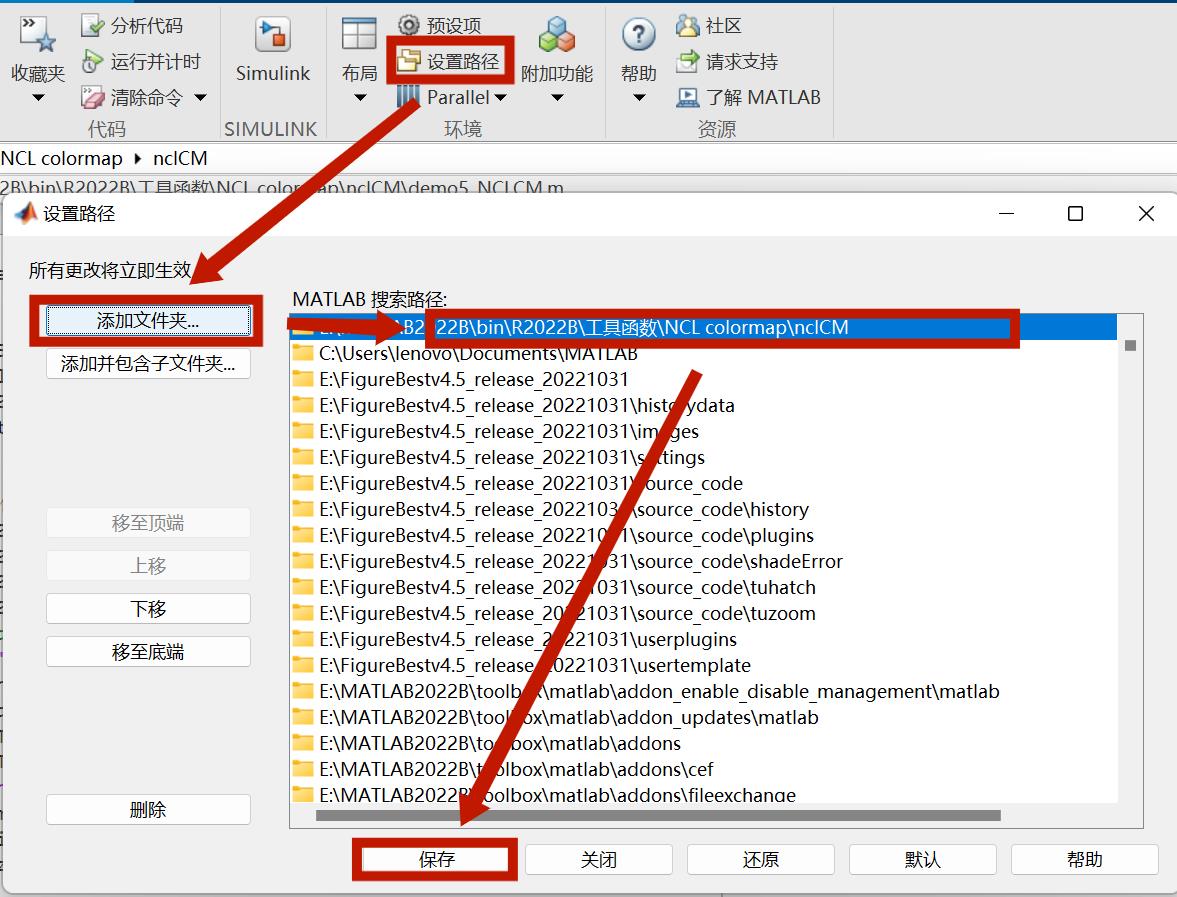
另
可将该文件夹添加到搜索路径,这样任何地方都可以调用此函数:
完
接近五百组数据整理起来真真真真的巨累,希望大家该点赞的点赞,该在看的在看!!
未经允许本代码请勿作商业用途,引用的话可以引用我file exchange上的链接,可使用如下格式:
Zhaoxu Liu / slandarer (2022). ncl colormaps (https://www.mathworks.com/matlabcentral/fileexchange/120848-ncl-colormaps), MATLAB Central File Exchange. 检索来源 2022/11/19.
若转载请保留以上file exchange链接及本文链接!!!!!
完整数据及实例
【nclCM 487 colormaps】
更新时会跟进更新以下连接:
【链接】:https://pan.baidu.com/s/1s7WTRsQfUahufk6hVUuFRA?pwd=slan
【提取码】:slan
以上是关于MATLAB | MATLAB海洋气象数据colormap配色补充包(NCL color tables)的主要内容,如果未能解决你的问题,请参考以下文章