Prometheus的使用总结
Posted 流子
tags:
篇首语:本文由小常识网(cha138.com)小编为大家整理,主要介绍了Prometheus的使用总结相关的知识,希望对你有一定的参考价值。
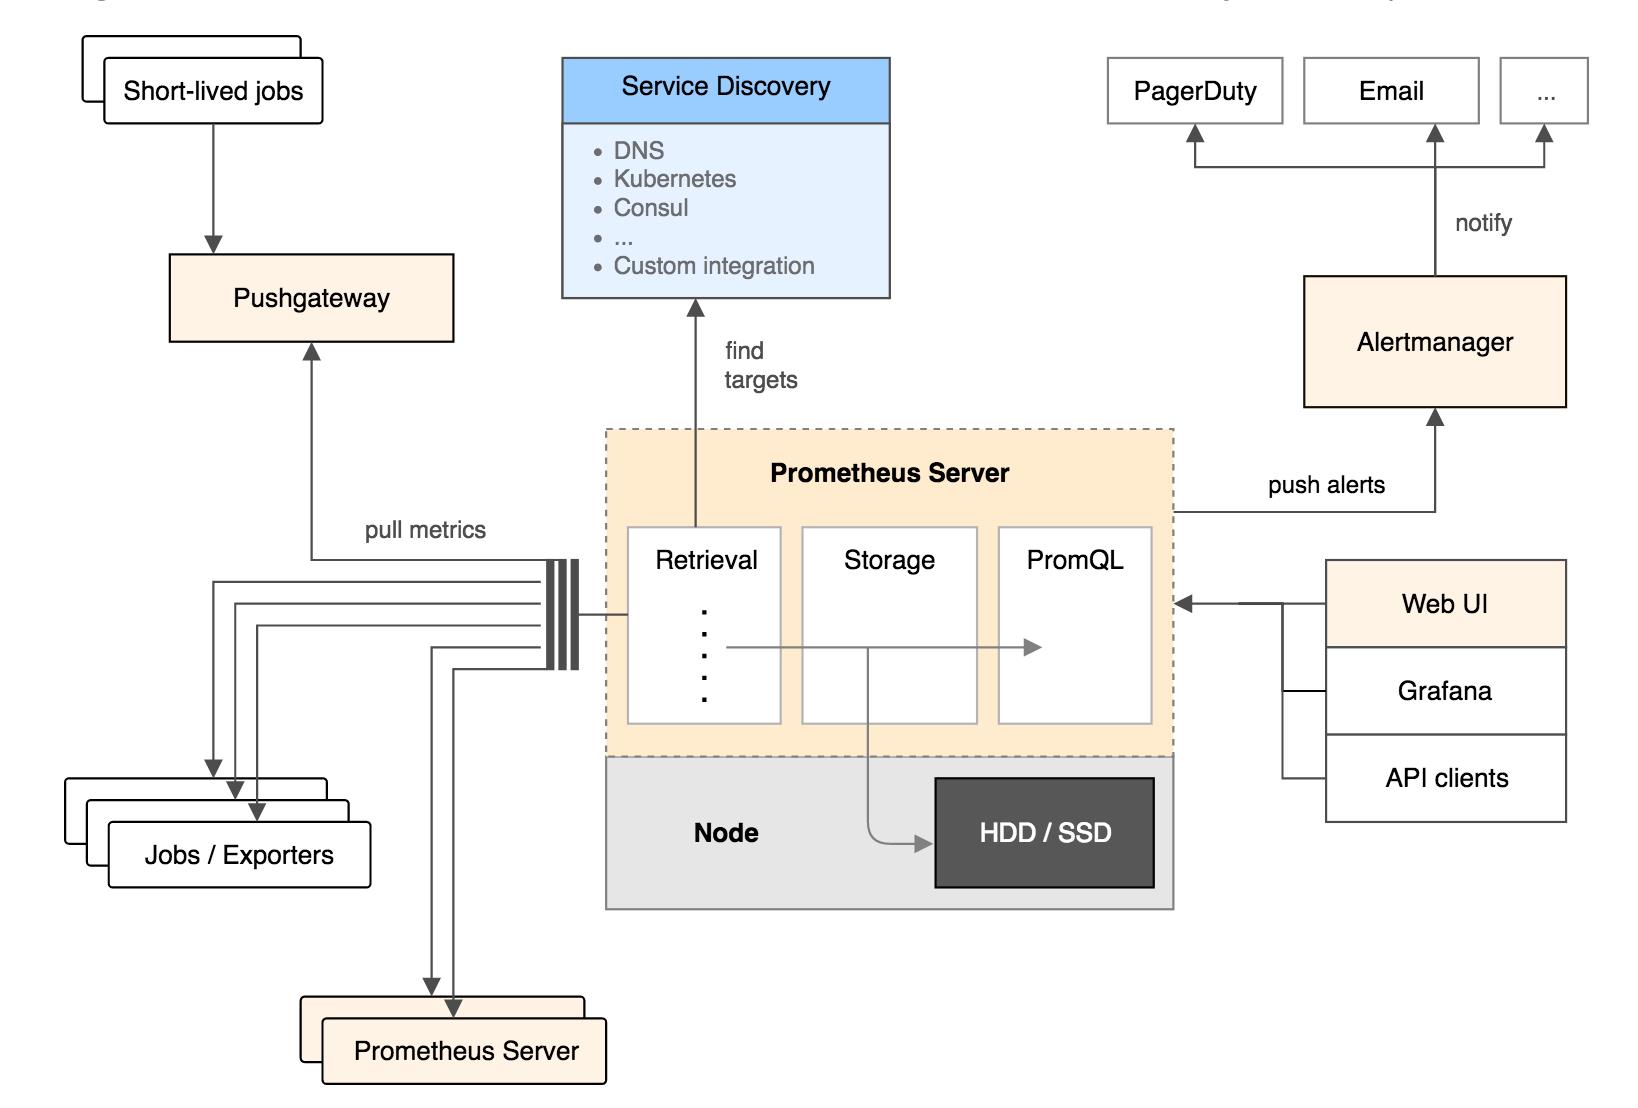
一、Prometheus是什么?
Prometheus 是一套开源的系统监控报警框架。它受启发于 Google 的 Brogmon 监控系统,由工作在 SoundCloud 的前 google 员工在 2012 年创建,作为社区开源项目进行开发,并于 2015 年正式发布。
2016 年,Prometheus 正式加入 Cloud Native Computing Foundation(CNCF)基金会的项目,成为受欢迎度仅次于 Kubernetes 的项目。2017 年底发布了基于全新存储层的 2.0 版本,能更好地与容器平台、云平台配合。
Prometheus 作为新一代的云原生监控系统,目前已经有超过 650+位贡献者参与到 Prometheus 的研发工作上,并且超过 120+项的第三方集成。
腾讯云云原生监控服务(Tencent Prometheus Service,TPS)是针对云原生服务场景进行优化的监控和报警解决方案,全面支持开源 Prometheus 的监控能力,为用户提供轻量、稳定、高可用的云原生 Prometheus 监控服务。借助 TPS,您无需自行搭建 Prometheus 监控系统,也无需关心数据存储、数据展示、系统运维等问题,只需简单配置即可享受支持多集群的高性能云原生监控服务
Prometheus 监控服务(Managed Service for Prometheus TMP)在继承开源 Prometheus 监控能力的同时 ,还提供高可用的 Prometheus 服务、开源可视化的 Grafana和云监控告警,为您减少用户的开发及运维成本。

二、使用步骤
1.操作步骤
容器服务–> 云原生监控–> 新建采集配置

设置好后,等15秒,就能采集到数据了,通过在数据采集配置中能否看到targets 是否能看到 up
如果是自行搭建的Prometheus,则需要在/usr/local/Prometheus/prometheus.yml上修改,可以通过static_configs参数静态配置目标,也可以使用受支持的服务发现机制之一动态发现目标.
# my global config
global:
  scrape_interval:     15s # Set the scrape interval to every 15 seconds. Default is every 1 minute.
  evaluation_interval: 15s # Evaluate rules every 15 seconds. The default is every 1 minute.
  # scrape_timeout is set to the global default (10s).

# Alertmanager configuration
alerting:
  alertmanagers:
  - static_configs:
    - targets:
      # - alertmanager:9093

# Load rules once and periodically evaluate them according to the global 'evaluation_interval'.
rule_files:
  # - "first_rules.yml"
  # - "second_rules.yml"

# A scrape configuration containing exactly one endpoint to scrape:
# Here it's Prometheus itself.
scrape_configs:
  # The job name is added as a label `job=<job_name>` to any timeseries scraped from this config.
  - job_name: 'game'

    # metrics_path defaults to '/metrics'
    # scheme defaults to 'http'.

    static_configs:
    - targets: ['10.10.20.89:8088']
      labels:
          instance: 'Allen大区'
    - targets: ['10.10.20.18:8088']
      labels:
          instance: '黄豆本地服'
启动prometheus
在prometheus配置文件中添加配置
scrape_configs:
  - job_name: 'java'
    static_configs:
    - targets: ['<host>:<port>']
重启prometheus
nohup ./prometheus > prometheus.log 2>&1 &
下载并导入dashboards
https://grafana.com/grafana/dashboards/7727
https://grafana.com/grafana/dashboards/8563
注:8563模板对7727有依赖,所以需全部安装,否则不能正常使用
/usr/local/Prometheus/prometheus --config.file=/usr/local/Prometheus/prometheus.yml &
服务发现类型有如下几种可以选择:
# 配置抓取请求的TLS设置
tls_config:
  [ <tls_config> ]
# 可选的代理URL
[ proxy_url: <string> ]
# Consul服务发现配置列表
consul_sd_configs:
  [ - <consul_sd_config> ... ]
# DNS服务发现配置列表
dns_sd_configs:
  [ - <dns_sd_config> ... ]
# 亚马逊EC2服务发现的配置列表
ec2_sd_configs:
  [ - <ec2_sd_config> ... ]
# 文件服务发现配置列表
file_sd_configs:
  [ - <file_sd_config> ... ]
# google GCE服务发现配置列表
gce_sd_configs:
  [ - <gce_sd_config> ... ]
# Kubernetes服务发现配置列表
kubernetes_sd_configs:
  [ - <kubernetes_sd_config> ... ]
# Zookeeper服务发现配置列表
serverset_sd_configs:
  [ - <serverset_sd_config> ... ]
# 静态配置目标列表
static_configs:
  [ - <static_config> ... ]
自定义监控
node-explore 是在物理节点上开的端口9092
http://172.17.0.10:9092/metrics
1.引入库
    api group: 'io.prometheus', name: 'simpleclient', version: '0.12.0';
    api group: 'io.prometheus', name: 'simpleclient_hotspot', version: '0.12.0';
    api group: 'io.prometheus', name: 'simpleclient_httpserver', version: '0.12.0';
    api group: 'io.prometheus', name: 'simpleclient_pushgateway', version: '0.12.0';
2.读入数据
启动参数:
java -server -Dfile.encoding=UTF-8 -Xms3072m -Xmx3072m -Xmn1024m -javaagent:/cnc/run/common/jmx_prometheus_javaagent-0.13.0.jar=8088:/cnc/run/common/prometheus-jmx-config.yaml -XX:+UseG1GC -XX:-OmitStackTraceInFastThrow -XX:+PrintGCDetails -XX:+PrintGCDateStamps -XX:+PrintGCApplicationStoppedTime -XX:+HeapDumpOnOutOfMemoryError -XX:HeapDumpPath=../log/game_dump_202109261447.dat -Xloggc:../log/1.1.2.1/gc_202109261447.log -jar /cnc/run/gamesvr/gamioo-game.jar
如何使用Prometheus的API
一、Prometheus自定义指标类型
共4种指标类型:Counter、Gauge、Histogram、Summary
1.1 Counter(计数器)
1):只增不减的单变量
2):调用inc(),计数器+1
3):应用场景:请求总量、错误总量,微服务在线时间、CPU使用时间等
1.2 Gauge(仪表盘)
1):值可增可减的单变量,反应指标的当前状态
2):调用inc(),+1;dec(),-1
3):应用场景:当前正在处理的Http请求数量、温度、CPU使用率、内存使用率等
1.3 Histogram(直方图)
多桶统计的多变量,指定分布范围内(buckets)记录大小或者事件发生的次数(数据分布情况)
1):默认的buckets范围为:.005, .01, .025, .05, .075, .1, .25, .5, .75, 1, 2.5, 5, 7.5, 10
2):自动创建3个指标:
事件发生总次数:XX_count,如:请求总数
所有事件产生值的总和: XX_sum,如:请求总数的响应时间总和
事件产生值分布在bucket中的次数:XX_bucket,如:在1s-2s响应时间的次数
3):应用场景:请求响应时间分布等
1.4 Summary(摘要)
聚合统计的多变量,自定义分布范围的数据分布情况,类似Histogram
1):自定义分布范围quantile(与Histogram区别,可自定义)
2):自动创建3个指标:
事件发生总次数:XX_count,如:请求总数
所有事件产生值的总和: XX_sum,如:请求总数的响应时间总和
事件产生值分布在quantile中的次数:XXquantile=“XXX”,如:在分位数XXX响应时间的次数
3):应用场景:请求响应时间分布等
二、PromQL语句
参考资料:https://www.bookstack.cn/read/prometheus_practice/promql-summary.md
2.1 查询结果类型(3种)
瞬时数据(Instant vector):一个时序只有一个点,例如:http_requests_total
区间数据(Range vector):一个时序有多个点,例如:http_requests_total[5m]
纯量数据(Scalar):纯量只有一个数字,没有时序,例如:count(http_requests_total)
2.2 查询语句
1):条件查询:=、!=、=、!,如:http_requests_totalcode=~"2…":表示查询 code 为 “2xx” 的数据
2):算数运算符:+、-、*、/、%、^, 如: http_requests_totalcode=~“2…” * 2
3):比较运算符:==、!=、>、<、>=、<=, 如:http_requests_totalcode=~“5…” > 50
4):逻辑运算符:and、or、unless, 如:http_requests_totalcode=~“5…” or http_requests_totalcode=~“4…”
5):聚合运算符:sum、min、max、avg、count、topk,如:sum(http_requests_totalcode=~“2…”)
6):内置函数:rate、floor…,如:rate(http_requests_totalcode=~“2…”[2m]):表示在2分钟内状态为2XX每秒请求数量,即:2min内请求增加量除以120s
代码如下(示例):
程序埋点,这里的name一定要以total结尾,才能和采样的值保持一致
    private Counter metrics = Counter.build().name("game_command_total").help("game command statistics").labelNames("userId", "msgName").register();

//埋点
public void incr(String userId, String msgName)
  metrics.labels(userId, msgName).inc();
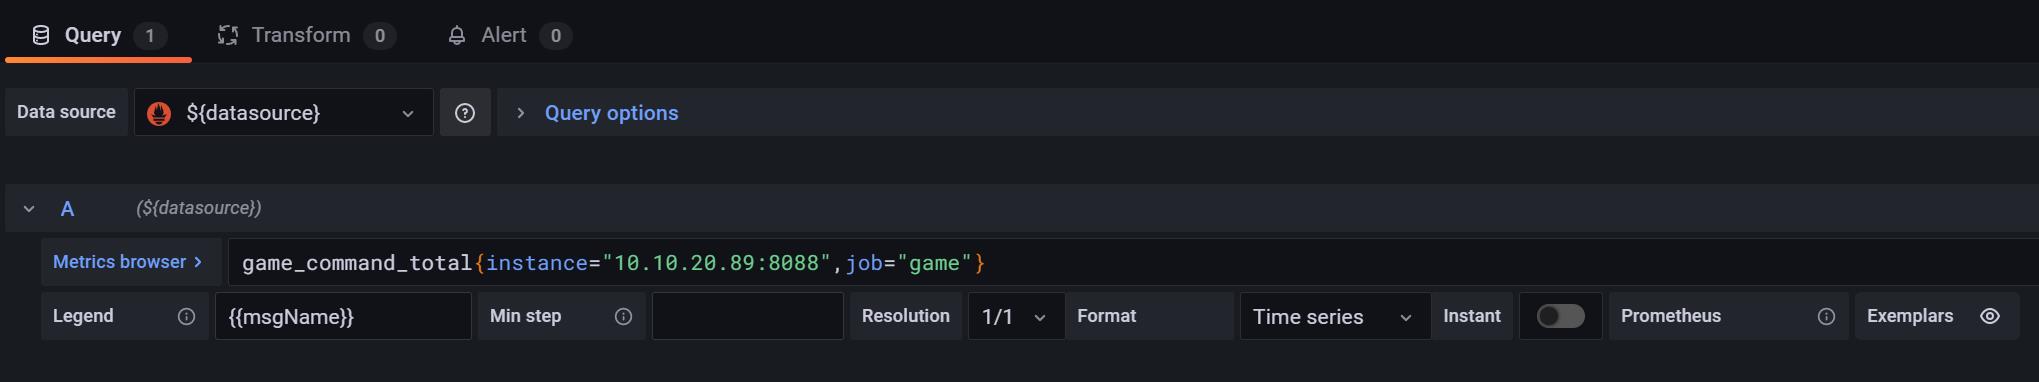
grafana 提取数据
data source:
game_command_totalinstance="10.10.20.89:8088",job="game"

如何提取增量数据,比如1分钟内的上下行指令数量:
increase(game_command_all_totaljob="$job",instance=~"$instance"[$__interval])

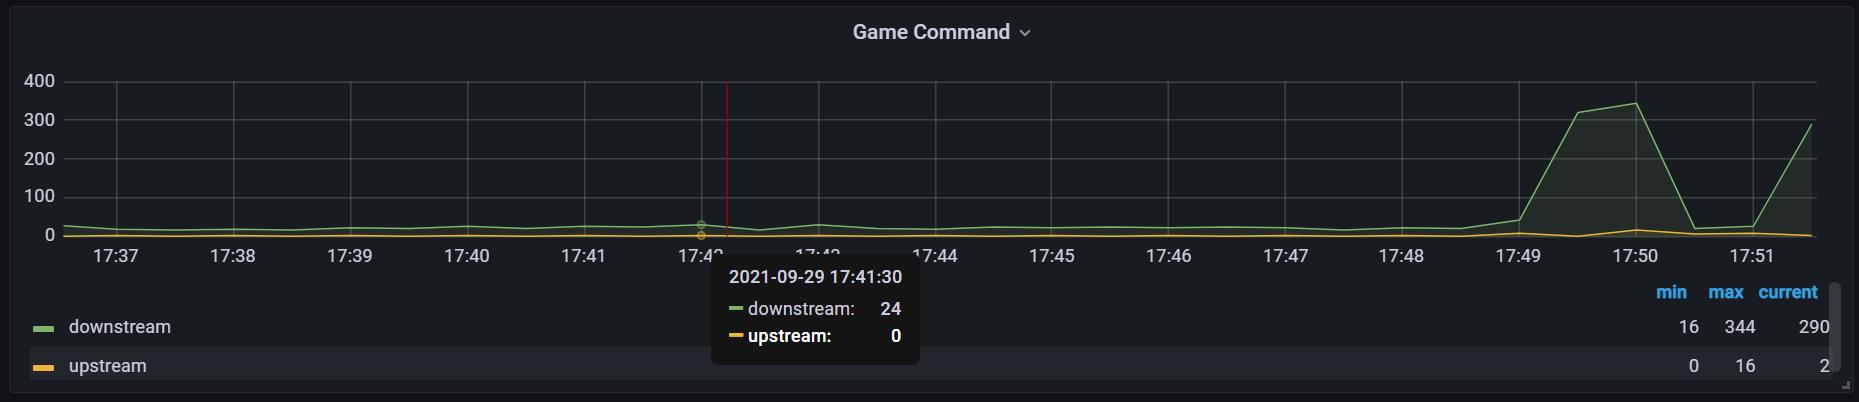
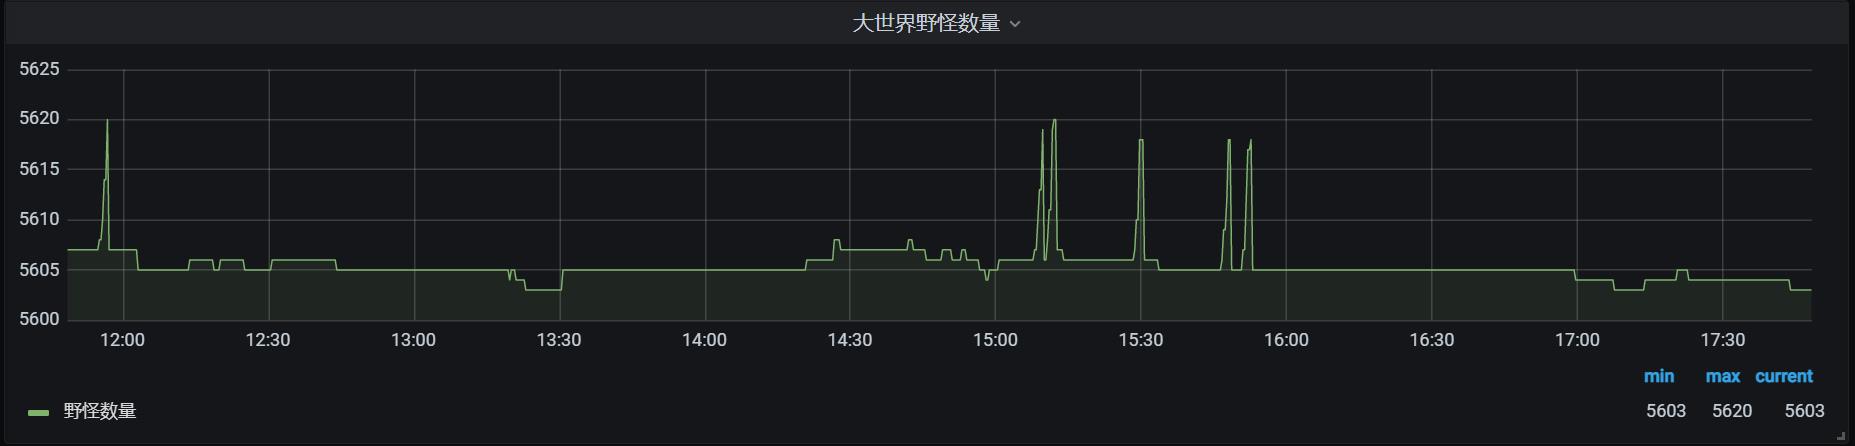
如何让显示的纵坐标更加精细化,Axes:Left Y->Unit:none
data = pd.read_csv(
    'https://labfile.oss.aliyuncs.com/courses/1283/adult.data.csv')
print(data.head())
该处使用的url网络请求的数据。
总结
提示:这里对文章进行总结:
例如:以上就是今天要讲的内容,本文仅仅简单介绍了pandas的使用,而pandas提供了大量能使我们快速便捷地处理数据的函数和方法。
prometheus-接入方式simple-client&pushgateway&客户端源码解析
Prometheus + Grafana微服务监控<四>:Prometheus自定义埋点
https://github.com/prometheus/client_java
Prometheus Metrics 设计的最佳实践和应用实例,看这篇够了!
Promethues 之服务发现(node-exporter)
参考:
cAdvisor+Prometheus+Grafana 组合
一个常用的组合方案是cAdvisor+Prometheus+Grafana,如图所示,通过Node exporter 抓取物理主机(或者说云主机)的运行状态,容器则通过cAdvisor对Docker引擎抓取容器的运行状态,然后汇总到Prometheus,再通过AlertManager实现告警,形成完整的解决方案。
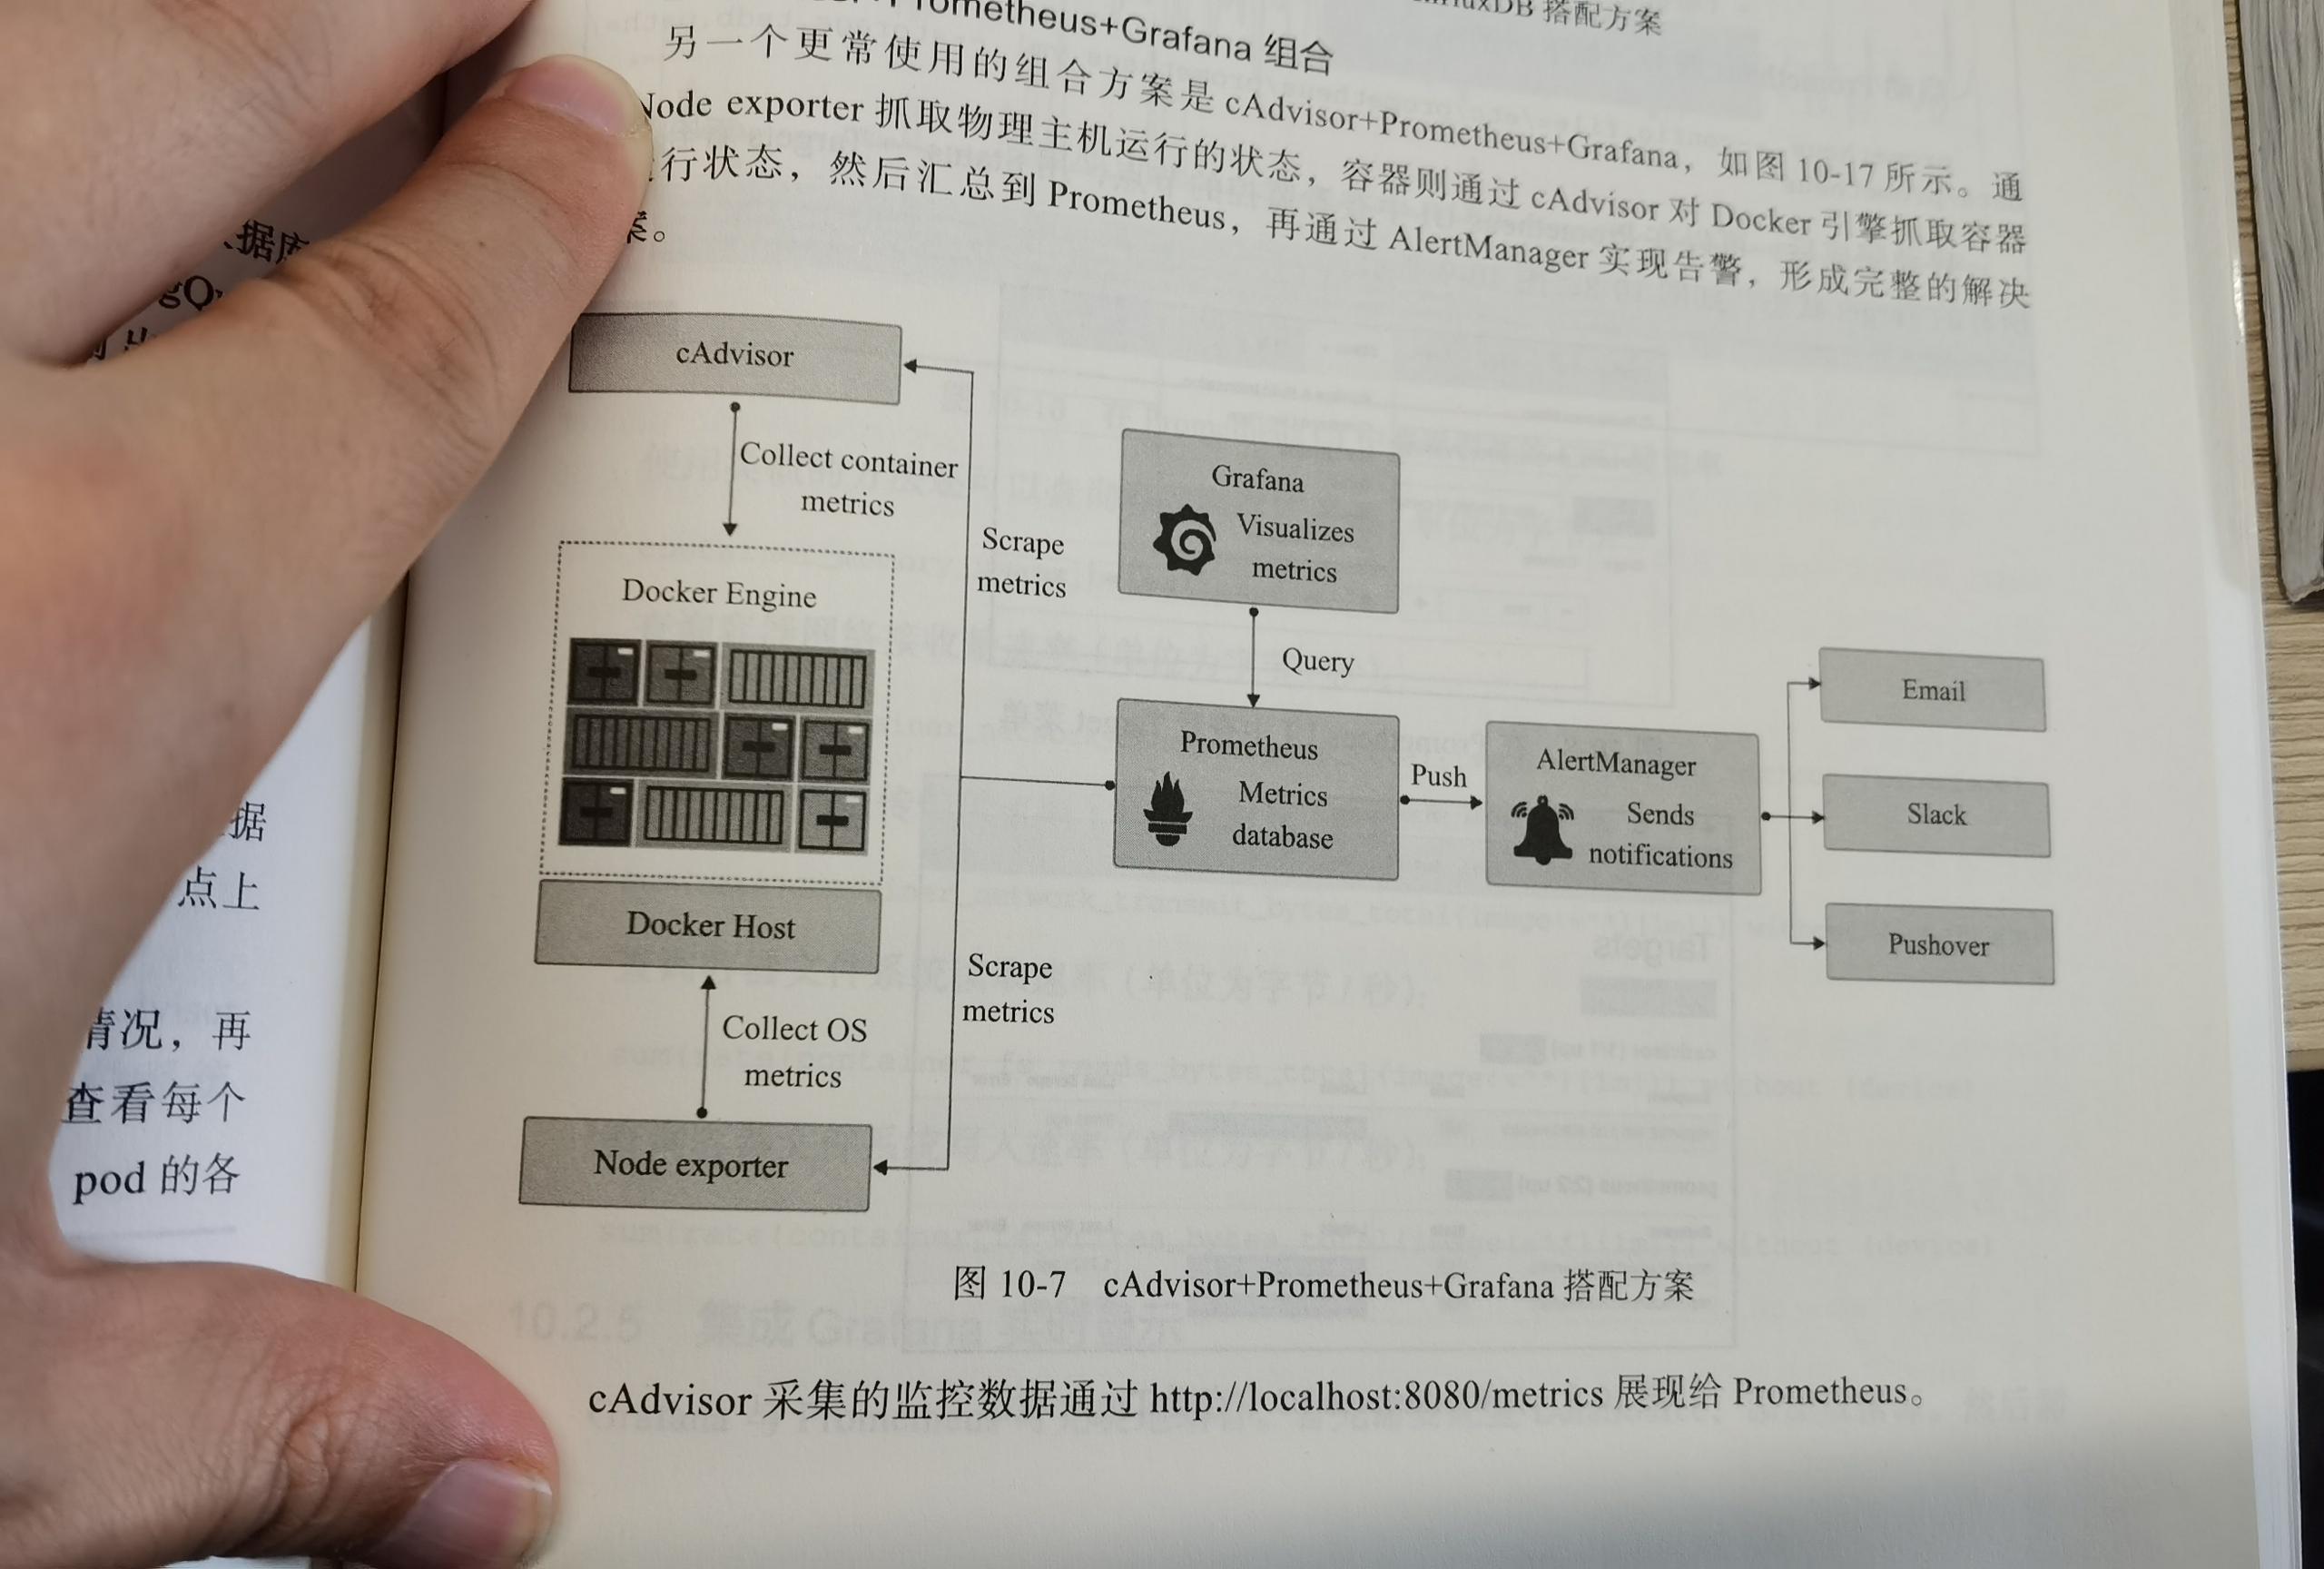
Push系统和Pull系统的核心差异。相较于Push模式,Pull模式的优点可以简单总结为以下几点:
只要Exporter在运行,你可以在任何地方(比如在本地),搭建你的监控系统;
你可以更容易的查看监控目标实例的健康状态,并且可以快速定位故障;
更利于构建DevOps文化的团队;
松耦合的架构模式更适合于云原生的部署环境。
node-exporter
用于采集服务器层面的运行指标,包括机器的loadavg、filesystem、meminfo等基础监控,类似于传统主机监控维度的zabbix-agent
metric-server(或heapster)
是从api-server中获取cpu、内存使用率这种监控指标
kube-state-metrics
关注于获取k8s各种资源的最新状态,如deployment或者daemonset
云原生监控里要使得同一域名下某个标签内的服务都能自动发现,需要做如下的数据采集配置:
Servce Monitor(Service监控)
apiVersion: monitoring.coreos.com/v1
kind: ServiceMonitor
metadata:
  name: game-statics
  namespace: gamioo-demo
spec:
  endpoints:
  - interval: 30s
    # 填写service yaml中Prometheus Exporter对应的Port的Name
    port: jmx-metrics
    # 填写Prometheus Exporter对应的Path的值,不填默认/metrics
    path: /metrics
    relabelings:
    # ** 必须要有一个 label 为 application,这里假设 k8s 有一个 label 为 app,
    # 我们通过 relabel 的 replace 动作把它替换成了 application
    - action: replace
      sourceLabels:  [__meta_kubernetes_pod_label_app]
      targetLabel: application
  # 选择要监控service所在的namespace
  namespaceSelector:
    matchNames:
    - gamioo-demo
  # 填写要监控service的Label值,以定位目标service
  selector:
    matchLabels:
      app: cnc
但坏处是要走公网的负载均衡,改成pod monitor(工作负载监控),如下设置,
apiVersion: monitoring.coreos.com/v1
kind: PodMonitor
metadata:
  name: game-pod-statics
  namespace: gamioo-demo
spec:
  podMetricsEndpoints:
  - interval: 30s
    port: jmx-metrics  # 填写pod yaml中Prometheus Exporter对应的Port的Name
    path: /metrics  # 填写Prometheus Exporter对应的Path的值,不填默认/metrics
    relabelings:
    - action: replace
      sourceLabels:
      - __meta_kubernetes_pod_node_name
      targetLabel: instance
  namespaceSelector:   # 选择要监控pod所在的namespace
    matchNames:
    - gamioo-demo
  selector:    # 填写要监控pod的Label值,以定位目标pod
    matchExpressions:
    - key: app.kubernetes.io/name
      operator: In
      values:
      - cnc-gamesvr
      - cnc-dirsvr
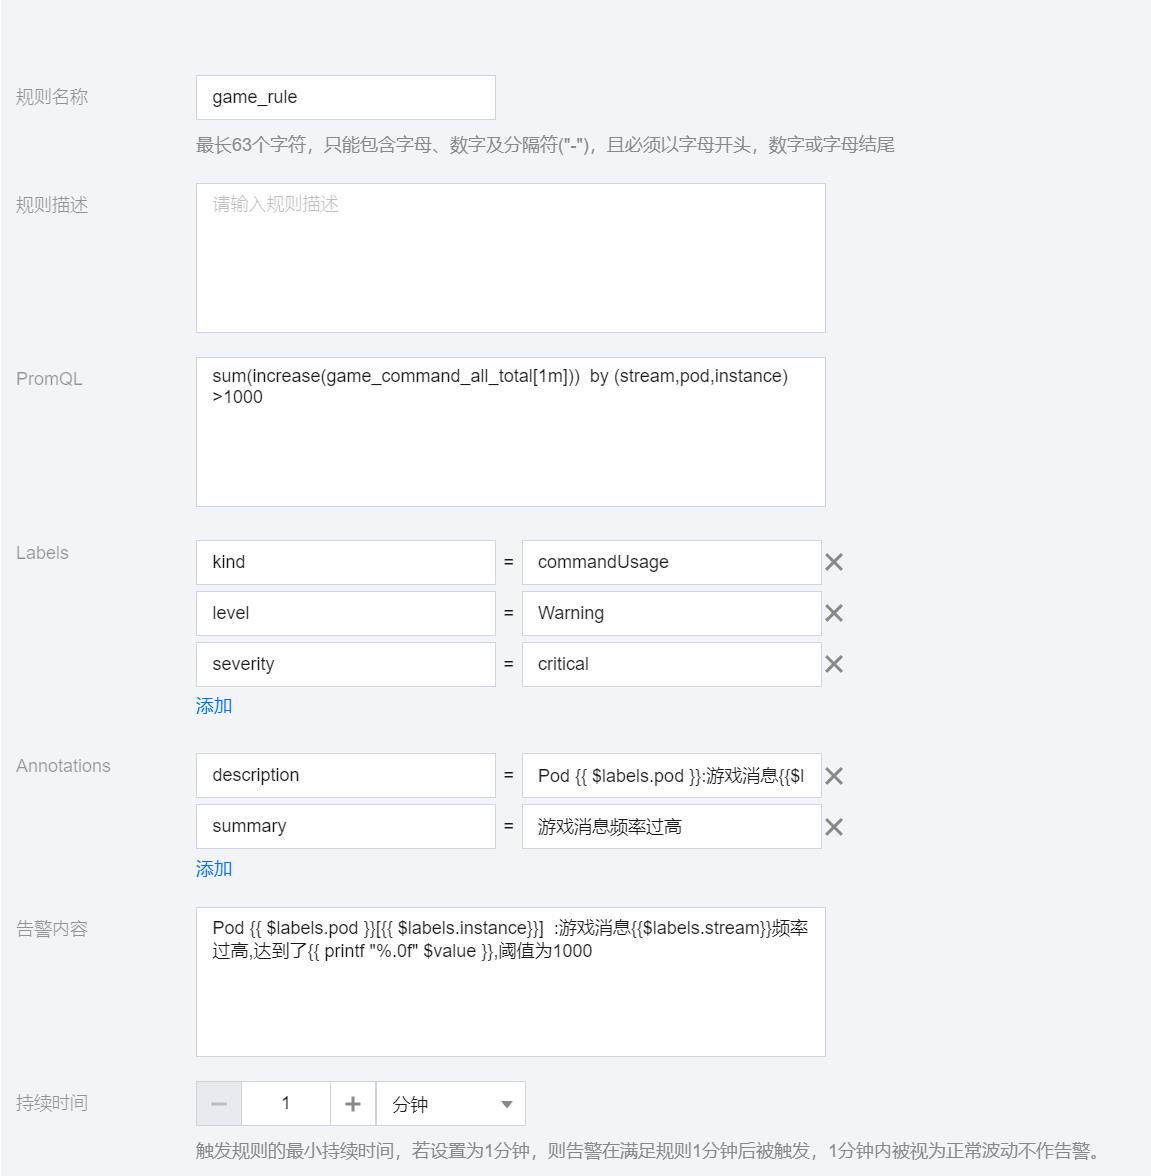
告警策略
PromQL:
PromQL :sum(increase(game_command_all_total[1m]))  by (stream,pod,instance) >1000
告警内容:Pod  $labels.pod [ $labels.instance]  :游戏消息$labels.stream频率过高,达到了 printf "%.0f" $value ,阈值为1000

告警内容变量
| 名称 | 变量 | 例子 |
|---|---|---|
| 集群 | labels.cluster | cls-rb6r9heb |
| Pod | labels.pod | cnc-gamesvr-1-1-0 |
| 名字空间 | labels.namespace | gamioo-demo |
| 任务 | labels.job | yorha-demo/game-pod-statics |
| 实例 | labels.instance | 172.17.0.10 |
在Prometheus AlertManager里设置告警模板,参考 Prometheus Alertmanager告警模板
 $var := .externalURL range $k,$v:=.alerts
if eq $v.status "resolved"
[恢复信息]()
>告警标题: $v.annotations.summary
>告警级别: $v.labels.level
开始时间: GetCSTtime $v.startsAt
结束时间: GetCSTtime $v.endsAt
故障主机IP: $v.labels.instance
**$v.annotations.description**
else
[告警信息]()
>告警标题: $v.annotations.summary
>告警级别: $v.labels.level
开始时间:GetCSTtime $v.startsAt
故障主机IP: $v.labels.instance
**$v.annotations.description**
end
 end
一个pod下可以n个容器,但一般情况下,我们只会在一个pod下放1个初始化容器和一个正式跑的容器
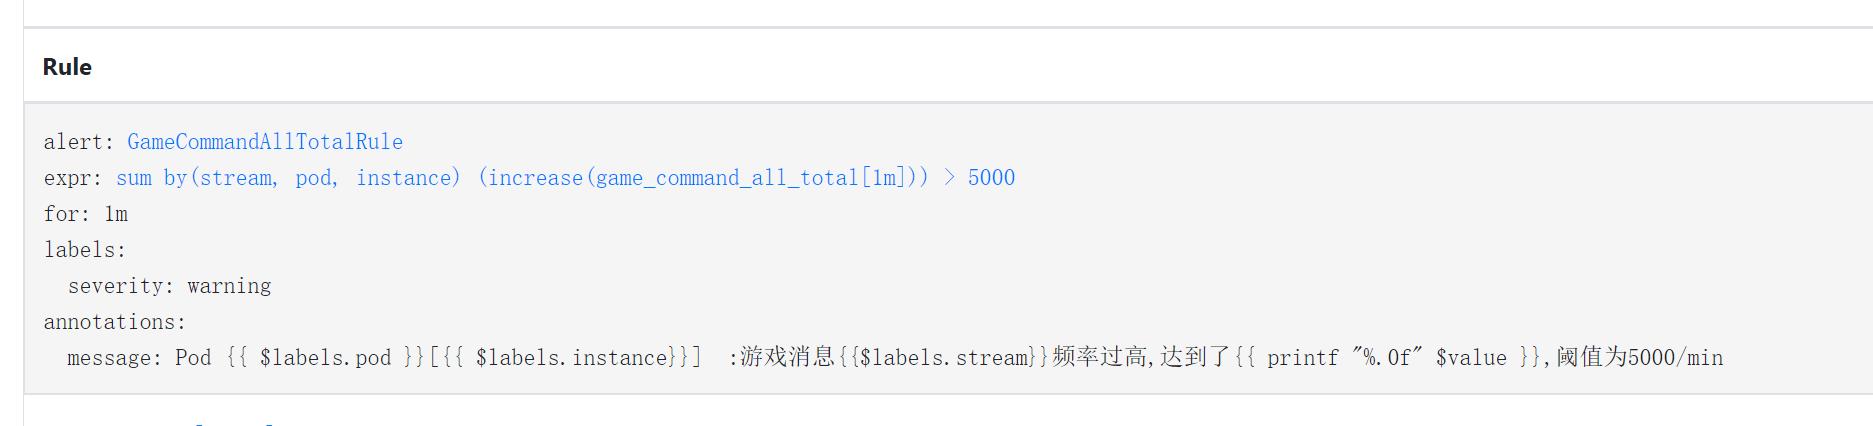
Rule如果要自己加在Prometheus上,则必须先在界面上测试下语句:
sum by(stream, pod, instance) (increase(game_command_all_total[1m]))

测试通过后就可以了,然后在rule界面能看到
以上是关于Prometheus的使用总结的主要内容,如果未能解决你的问题,请参考以下文章