使用Python爬取信息403解决,并统计汇总绘制直方图,柱状图,折线图
Posted 程序媛一枚~
tags:
篇首语:本文由小常识网(cha138.com)小编为大家整理,主要介绍了使用Python爬取信息403解决,并统计汇总绘制直方图,柱状图,折线图相关的知识,希望对你有一定的参考价值。
使用Python爬取信息403解决,并统计汇总绘制直方图,柱状图,折线图
写这篇博客源于博友的提问:

1. 效果图
拟录取专业-人数分布直方图效果图如下:
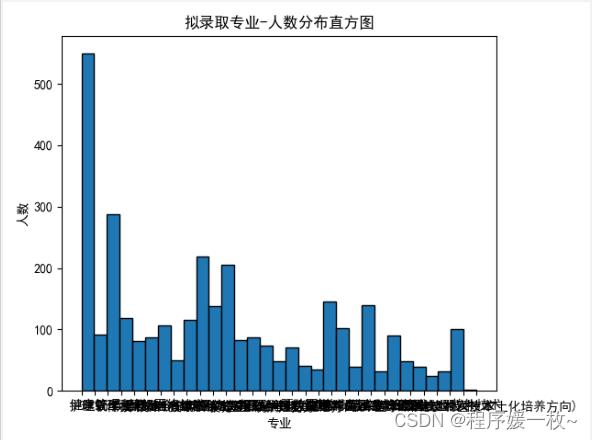
拟录取专业-人数效果图如下:
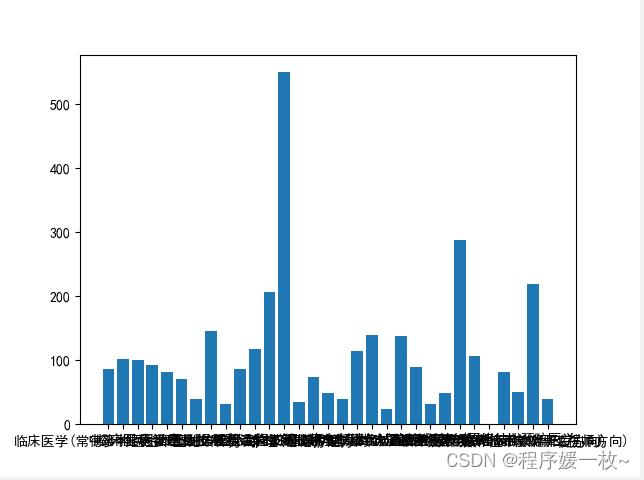
拟录取专业-人数柱状图效果图如下:
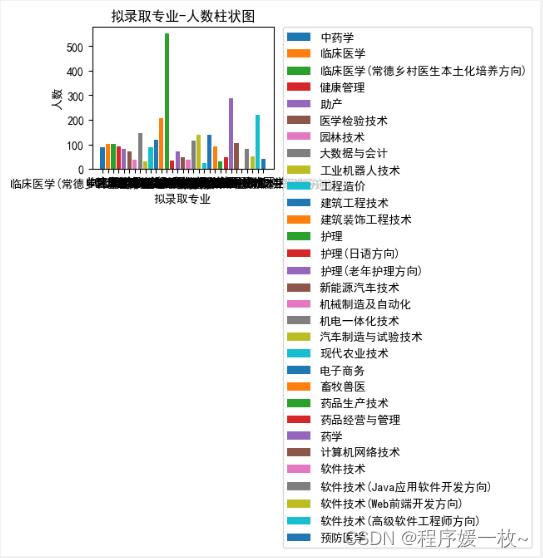
拟录取专业-人数折线图效果图如下:
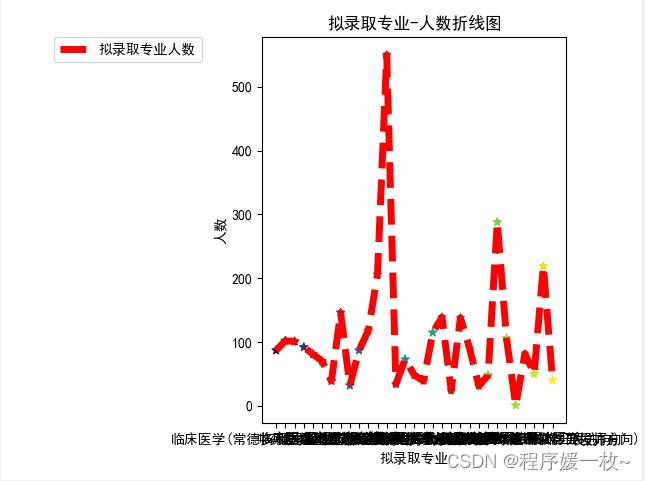
2. 原理
- 爬取403,可以在请求request里加入header,cookie;
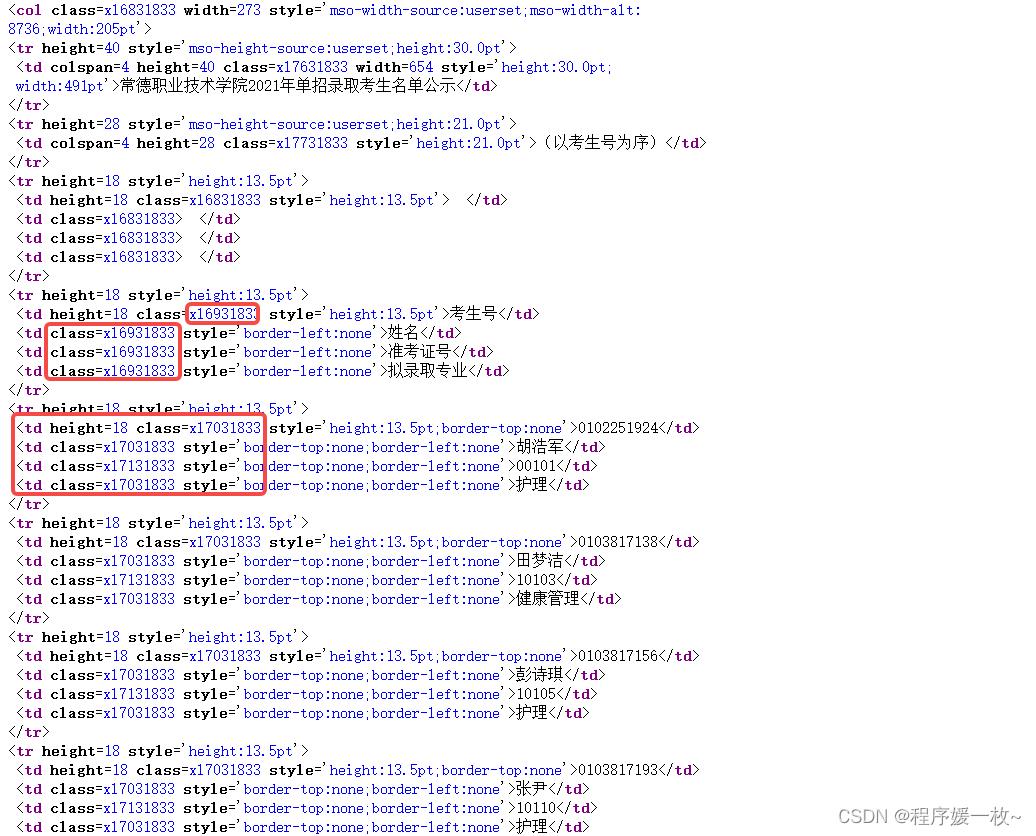
- 观察结果值为html以及td,class不太一样,介于标题和值不一样,最终决定找所有td进行处理
- matplotlib图例超出范围,设置plt.tight_layout(),不太管用,fig.savefig(‘tight.png’, bbox_inches=‘tight’)查看保存后的图ok。
直接savefig时显示不全
fig.savefig(‘withoutTight.png’)
savefig时加上 bbox_inches=‘tight’ 后,可以解决
fig.savefig(‘tight.png’, bbox_inches=‘tight’)
3. 源码
# 1. 爬取数据:http://www.cdzy.cn/zsb/html/2021lq4.htm
# 2. 考生号,姓名,准考证号,拟录取专业保存到new_data.xls
# 3. 按"拟录取专业"统计各专业录取人数
# 4. 绘制“拟录取专业-录取人数”,直方图,柱状图,折线图
# -*- coding:utf-8 -*-
# USAGE
# python ask_pa_plot.py

import matplotlib.pyplot as plt
import numpy as np
import pandas as pd
import requests
from lxml import html

# 正确显示中文和负号

plt.rcParams["font.sans-serif"] = ["SimHei"]
plt.rcParams["axes.unicode_minus"] = False


def getData(url):
    print(url)
    # # 设置请求超时(20s) 报错403
    # r = requests.get(url, timeout=1)
    # print(r)
    # # 报错403
    # headers =
    #     'User-Agent': 'Mozilla/5.0 (Macintosh; Intel Mac OS X 10_11_5) AppleWebKit/537.36 (KHTML, like Gecko) Chrome/50.0.2661.102 Safari/537.36'
    # r = requests.get(url=url, headers=headers)
    # print('addHeader: ', r)
    headers =
        'User-Agent': 'Mozilla/5.0 (Macintosh; Intel Mac OS X 10_13_3) AppleWebKit/537.36 (KHTML, like Gecko) Chrome/63.0.3239.132 Safari/537.36',
        'Cookie': 'cf_clearance=1159d2ca806b3ebf2a85a8706f4b8c90ff6abc01-1517488982-1800'


    r = requests.get(url, headers=headers)
    if r.status_code == requests.codes.ok:
        print('=== status_code === ', r.status_code)  # 响应码
        print('=== headers === ', r.headers)  # 响应头
        print('=== Content-Type === ', r.headers.get('Content-Type'))  # 获取响应头中的Content-Type字段

        # 解析数据
        r.encoding = 'utf-8'
        # print('content: ', type(r.text))
        # print(r.content)
        f = open("out.txt", "w", encoding='utf-8')
        f.write(r.text)
        f.close()

        tree = html.parse(url)
        d =

        all_td_val = tree.xpath('//td')
        print('all: ', len(all_td_val))
        # 跳过前6行无效行
        all_td_val = all_td_val[6:]

        # 获取标题列
        # th_td_val = tree.xpath('//td[@class="xl6931833"]')
        th_td_val = all_td_val[:4]
        header = []
        for i in th_td_val:
            hd = i.xpath('./text()')[0]
            header.append(hd)
            d.setdefault(str(hd), [])

        # 获取值,跳过标头4列
        all_td_val = all_td_val[4:]
        for i in range(len(all_td_val) // 4):
            for j in range(4):
                if (i * 4 + j >= len(all_td_val)): break
                val = all_td_val[i * 4 + j].xpath('./text()')
                if (len(val) == 0): continue
                val = all_td_val[i * 4 + j].xpath('./text()')[0]
                d[header.__getitem__(j)].append(val)

        print(d.keys())
        return d


# 直方图绘制
def plot_hist(pd):
    # print(np.unique(pd.values))
    # print(len(pd.values), len(np.unique(pd.values)))
    # edgecolor加分割线
    plt.hist(pd.values, bins=len(np.unique(pd.values)), edgecolor='black')
    labels = [i for i in pd.index]
    print(labels)
    # 设置图片标题
    plt.title("拟录取专业-人数分布直方图")
    plt.xlabel('专业')
    plt.ylabel('人数')
    plt.tight_layout()
    plt.show()


# 柱状图绘制
def plot_bar(pd):
    # 画图,plt.bar()可以画柱状图
    print(type(pd.keys), type(pd.values), type(pd.index))
    print(pd.keys)
    print(pd.values)
    print(pd.index[0])
    labels = [i for i in pd.index]
    bar = plt.bar(pd.keys(), pd.values, label=labels)
    # # 添加图例名称到图标
    # plt.legend(handles=bar.legend_elements()[0],
    #            labels=pd.keys(),
    #            title="拟录取专业", loc="upper right")
    plt.show()

    fig = plt.figure()
    for i, (x, y) in enumerate(pd.items()):
        print(i, x, y)
        plt.bar(x, y, label=x)
    # 设置图片标题
    plt.title("拟录取专业-人数柱状图")
    # 设置x轴标签名
    plt.xlabel("拟录取专业")
    # 设置y轴标签名
    plt.ylabel("人数")
    plt.legend(bbox_to_anchor=(1.05, 1), loc='upper left', borderaxespad=0.)
    plt.tight_layout()
    # 显示
    plt.show()

    # 直接savefig时显示不全
    fig.savefig('withoutTight.png')
    # savefig时加上 bbox_inches='tight' 后,可以解决
    fig.savefig('tight.png', bbox_inches='tight')


# 折线图绘制
def plot_line(pd):
    fig = plt.figure()
    label = np.arange(len(pd.values))
    scatter = plt.scatter(pd.keys(), pd.values, c=label, marker="*")
    labels = [i for i in pd.index]
    plt.plot(pd.keys(), pd.values, label='拟录取专业人数', c='red', lw=5.0, ls="--")
    # 添加图例名称到图标
    plt.legend(handles=scatter.legend_elements()[0],
               labels=labels,
               title="拟录取专业", bbox_to_anchor=(-0.2, 1))
    # plt.legend(bbox_to_anchor=(-0.2, 1), loc='upper right', borderaxespad=0.)
    # 设置图片标题
    plt.title("拟录取专业-人数折线图")
    # 设置x轴标签名
    plt.xlabel("拟录取专业")
    # 设置y轴标签名
    plt.ylabel("人数")
    plt.tight_layout()
    # 显示
    plt.show()

    # 直接savefig时显示不全
    fig.savefig('withoutTight_z.png')
    # savefig时加上 bbox_inches='tight' 后,可以解决
    fig.savefig('tight_z.png', bbox_inches='tight')


url = 'http://www.cdzy.cn/zsb/HTML/2021lq4.htm'
dict = getData(url)
# print(dict)
pd = pd.DataFrame(dict)

pd_x = pd.groupby('拟录取专业')['姓名'].count()
print(pd_x)
# pd_arr = np.array(pd_x)
# for i, j in enumerate(pd_arr):
#     print(i, j)

plot_hist(pd['拟录取专业'])
plot_bar(pd_x)
plot_line(pd_x)
参考
以上是关于使用Python爬取信息403解决,并统计汇总绘制直方图,柱状图,折线图的主要内容,如果未能解决你的问题,请参考以下文章