MNE学习笔记:Evoked数据结构
Posted Dodo·D·Caster
tags:
篇首语:本文由小常识网(cha138.com)小编为大家整理,主要介绍了MNE学习笔记:Evoked数据结构相关的知识,希望对你有一定的参考价值。
MNE学习笔记(四):Evoked数据结构
参考文章:
https://mp.weixin.qq.com/s/Udr0qBvspyKVjASdgL-QxQ
https://mne.tools/stable/auto_tutorials/index.html 【官方教程】
https://baike.baidu.com/item/%E8%AF%B1%E5%8F%91%E7%94%B5%E4%BD%8D/8378650?fr=aladdin
概念
Evoked potential(EP)
- 机体的自发电活动可以为直接的或外界的确定性刺激(电、光、声等刺激)所影响,产生另一种局部化的电位变化称为诱发电位。又称诱发反应、事件相关电位。
诱发电位(Evoked)结构
-
主要用于存储实验期间的平均数据,在MNE中,创建Evoked对象通常使用
mne.Epochs.average()来平均epochs数据来实现。 -
Evoked对象通常存储一个已经被多个epochs平均(
averaged)后的EEG或者MEG信号,它是用来评估被刺激诱发的活动(stimulus-evoked activity)的一个常用技术。 -
用array存储(
n_channels, n_times)对比Epochs对象,存储属性:
n_epochs,n_channels,n_times
创建
Evoked数据结构的创建主要有两种方式
- 从Epochs对象中创建Evoked对象
- 从头创建Evoked对象
从Epochs对象中创建Evoked对象
采用read_evokeds方法来进行创建
代码:
# 从fif文件中读取诱发数据集
data_path = "D:\\Data\\MNE-sample-data"
fname = op.join(data_path, 'MEG', 'sample', 'sample_audvis-ave.fif')
evokeds = mne.read_evokeds(fname, baseline=(None, 0), proj=True)
print(evokeds)
# 只读取左听觉的电位数据
evoked = mne.read_evokeds(fname, condition='Left Auditory')
evoked.apply_baseline((None, 0)).apply_proj()
print(evoked)
结果:

从头创建Evoked对象
步骤:
- 构建数据
- 创建evoked对象
代码:
import mne
import numpy as np
import matplotlib.pyplot as plt

"""
第一步:构建数据
构建一个大小为10x5x200的三维数组,数组中数据是随机数;
第一维数据表示:10 epochs
第二维数据表示:5 channels
第三维数据表示:2 seconds per epoch
"""
# 采样频率
sfreq = 100
data = np.random.randn(10, 5, sfreq * 2)

# 创建一个info结构
info = mne.create_info(
    ch_names=['MEG1', 'MEG2', 'EEG1', 'EEG2', 'EOG'],
    ch_types=['grad', 'grad', 'eeg', 'eeg', 'eog'],
    sfreq=sfreq
)

"""
第二步:创建evoked对象
利用mne.EvokedArray创建Evoked对象
"""
# tmin:event开始前的时间,如果未指定,则默认为0,这里设为-0.1s
tmin = -0.1

# 对数据求平均
data_evoked = data.mean(0)

# epochs的数量
nave = data.shape[0]

# 给evoked起一个名称
comment = "Smiley faces"

# 利用mne.EvokedArray创建Evoked对象
evoked_array = mne.EvokedArray(data_evoked, info, tmin,
                               comment=comment, nave=nave)
print(evoked_array)
_ = evoked_array.plot(time_unit='s')
plt.show()
结果:

查看
查看的方式和之前的Epochs是类似的
代码:
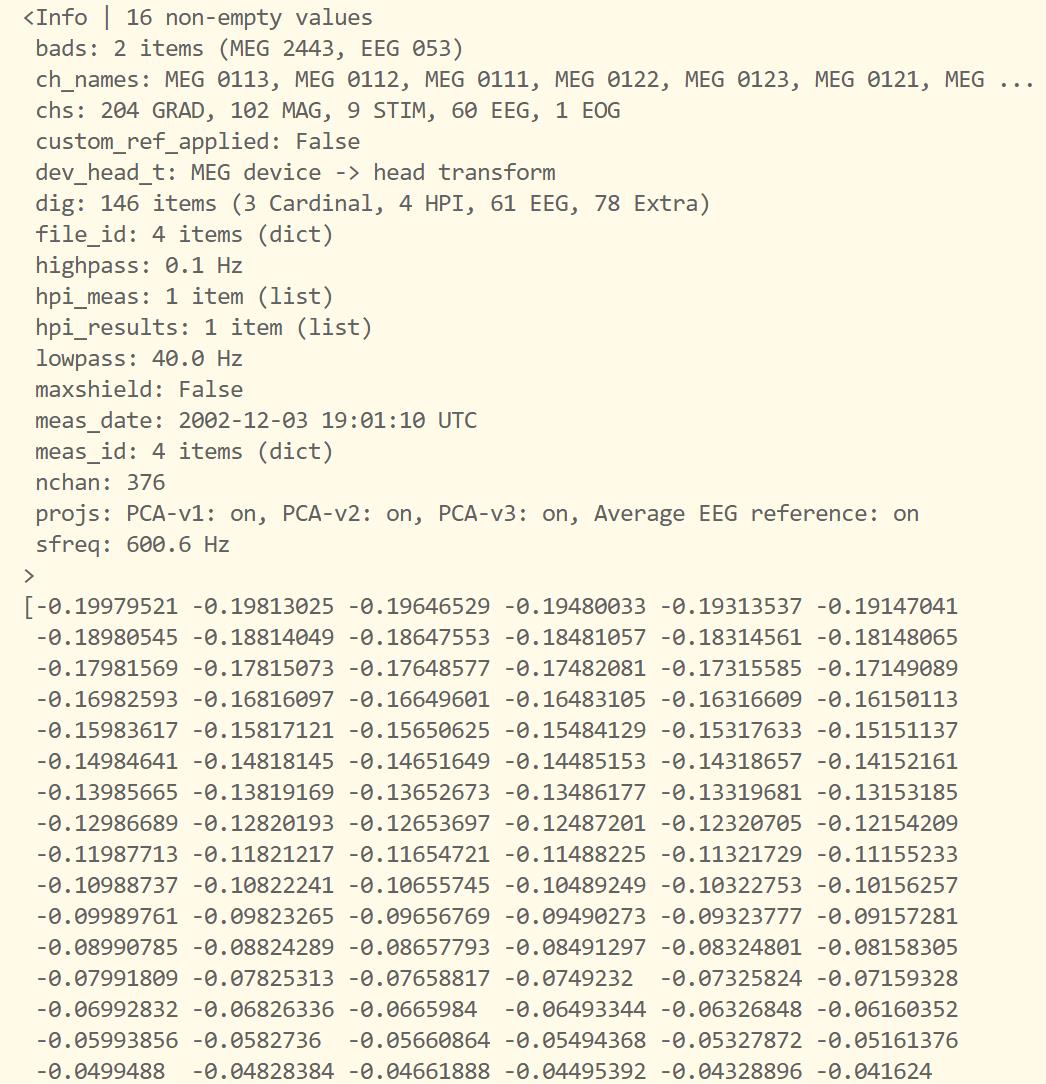
# 打印evoked的信息,这个信息和Raw对象以及Epochs对象中的info很相似
print(evoked.info)
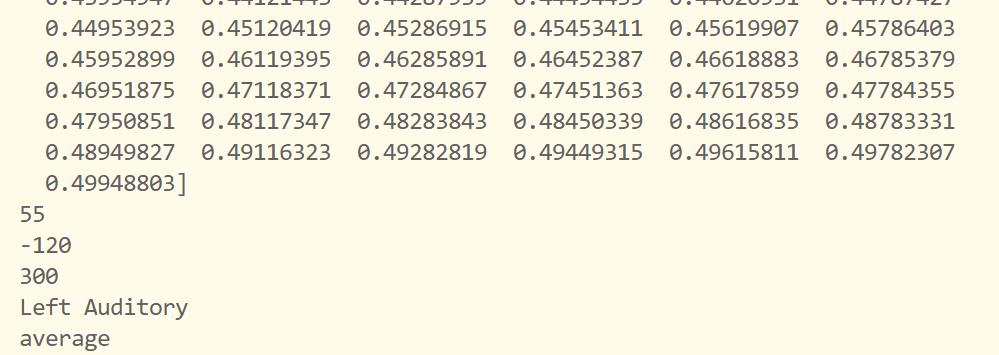
print(evoked.times)

# 查看evoked结构其他属性
print(evoked.nave)  # Number of averaged epochs.
print(evoked.first)  # First time sample.
print(evoked.last)  # Last time sample.
print(evoked.comment)  # Comment on dataset. Usually the condition.
print(evoked.kind)  # Type of data, either average or standard_error.
结果:
由于数据很长,这里只截取部分
可视化
看注释。PS:之后有时间可能会整理可视化的方法。
代码:
"""
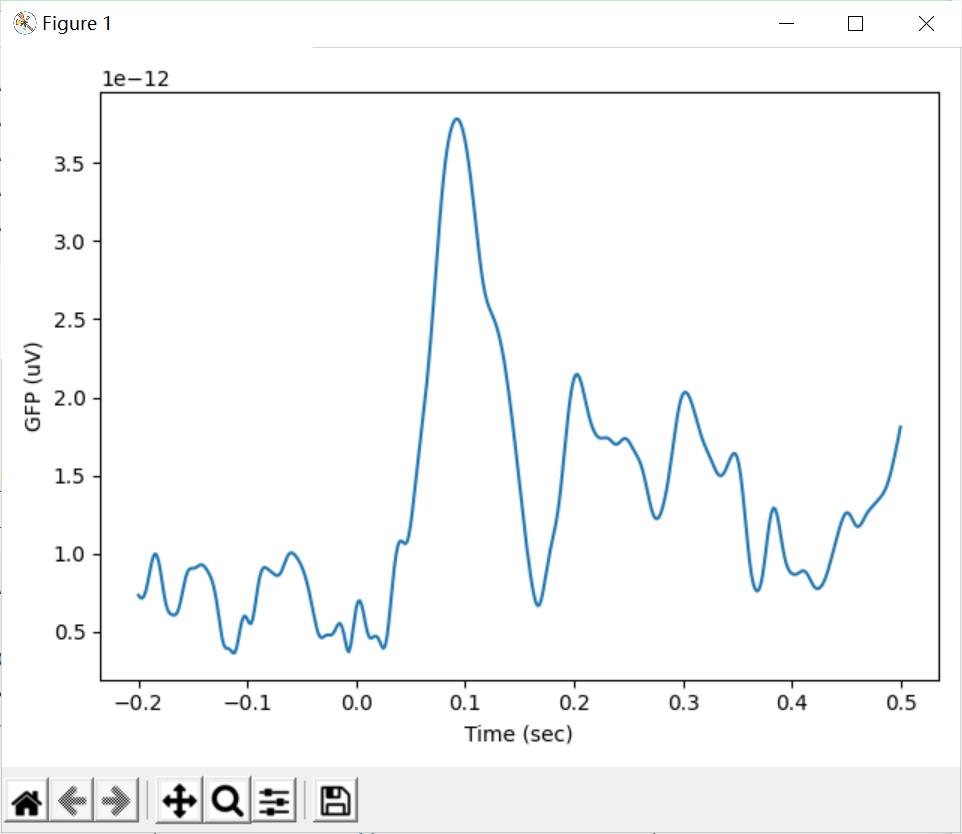
可视化1
快速提取并绘制全局能量谱(Global Field Power, GFP)作为跨通道的标准偏差
这里仅显示EEG
"""
gfp = evoked.copy().pick_types(eeg=True, meg=False).data.std(axis=0)
fig, ax = plt.subplots(1)
ax.plot(evoked.times, gfp / 1e6)  # scale to uV
ax.set(xlabel='Time (sec)', ylabel='GFP (uV)')
fig.tight_layout()
plt.show()

"""
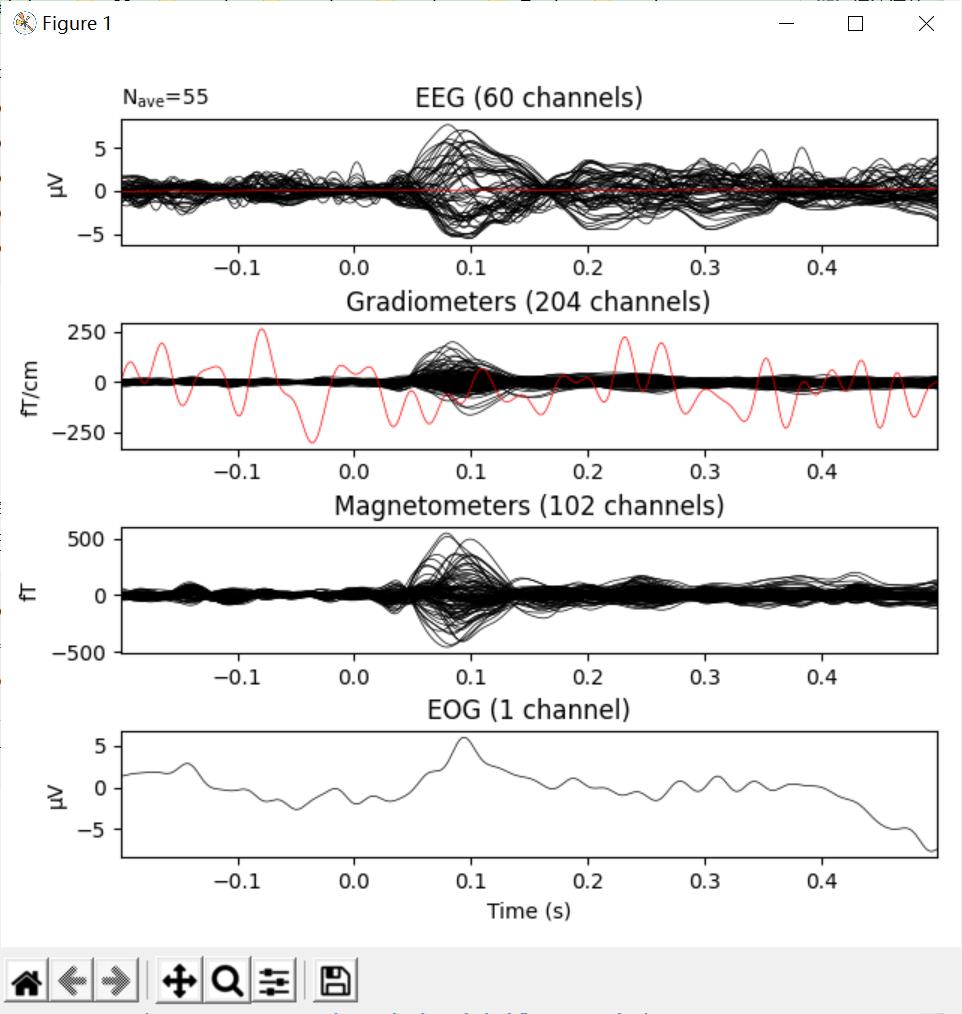
可视化2
将结果显示为蝶形图
exclude=[]:不排除不良信道(用红色显示)
"""
evoked.plot(exclude=[], time_unit='s')
plt.show()

"""
可视化3
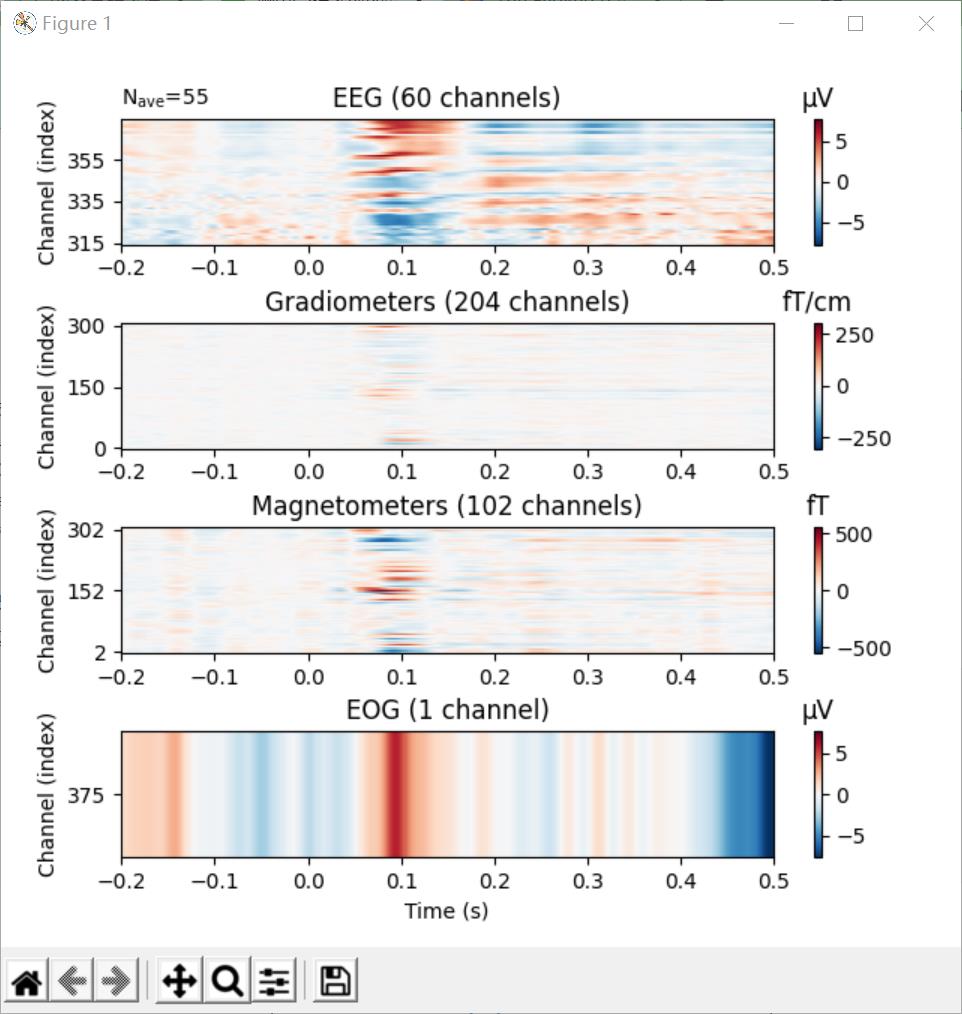
将结果以二维图片的形式显示 (x: time, y: channels, color: amplitude)
"""
evoked.plot_image(exclude=[], time_unit='s')
plt.show()
结果:
可视化1:
可视化2:
可视化3:
附录:完整代码
这里是从Epochs对象中创建Evoked对象的方式的完整代码:
import os.path as op
import matplotlib.pyplot as plt
import mne

# 从fif文件中读取诱发数据集
data_path = "D:\\Data\\MNE-sample-data"
fname = op.join(data_path, 'MEG', 'sample', 'sample_audvis-ave.fif')
evokeds = mne.read_evokeds(fname, baseline=(None, 0), proj=True)
print(evokeds)
# 只读取左听觉的电位数据
evoked = mne.read_evokeds(fname, condition='Left Auditory')
evoked.apply_baseline((None, 0)).apply_proj()
print(evoked)

# 打印evoked的信息,这个信息和Raw对象以及Epochs对象中的info很相似
print(evoked.info)
print(evoked.times)

# 查看evoked结构其他属性
print(evoked.nave)  # Number of averaged epochs.
print(evoked.first)  # First time sample.
print(evoked.last)  # Last time sample.
print(evoked.comment)  # Comment on dataset. Usually the condition.
print(evoked.kind)  # Type of data, either average or standard_error.

"""
可视化1
快速提取并绘制全局能量谱(Global Field Power, GFP)作为跨通道的标准偏差
这里仅显示EEF
"""
gfp = evoked.copy().pick_types(eeg=True, meg=False).data.std(axis=0)
fig, ax = plt.subplots(1)
ax.plot(evoked.times, gfp / 1e6)  # scale to uV
ax.set(xlabel='Time (sec)', ylabel='GFP (uV)')
fig.tight_layout()
plt.show()

"""
可视化2
将结果显示为蝶形图
exclude=[]:不排除不良信道(用红色显示)
"""
evoked.plot(exclude=[], time_unit='s')
plt.show()

"""
可视化3
将结果以二维图片的形式显示 (x: time, y: channels, color: amplitude)
"""
evoked.plot_image(exclude=[], time_unit='s')
plt.show()
以上是关于MNE学习笔记:Evoked数据结构的主要内容,如果未能解决你的问题,请参考以下文章