vue2+echarts:使用后台传输的json数据去动态渲染echarts图表
Posted 364.99°
tags:
篇首语:本文由小常识网(cha138.com)小编为大家整理,主要介绍了vue2+echarts:使用后台传输的json数据去动态渲染echarts图表相关的知识,希望对你有一定的参考价值。
1.源码
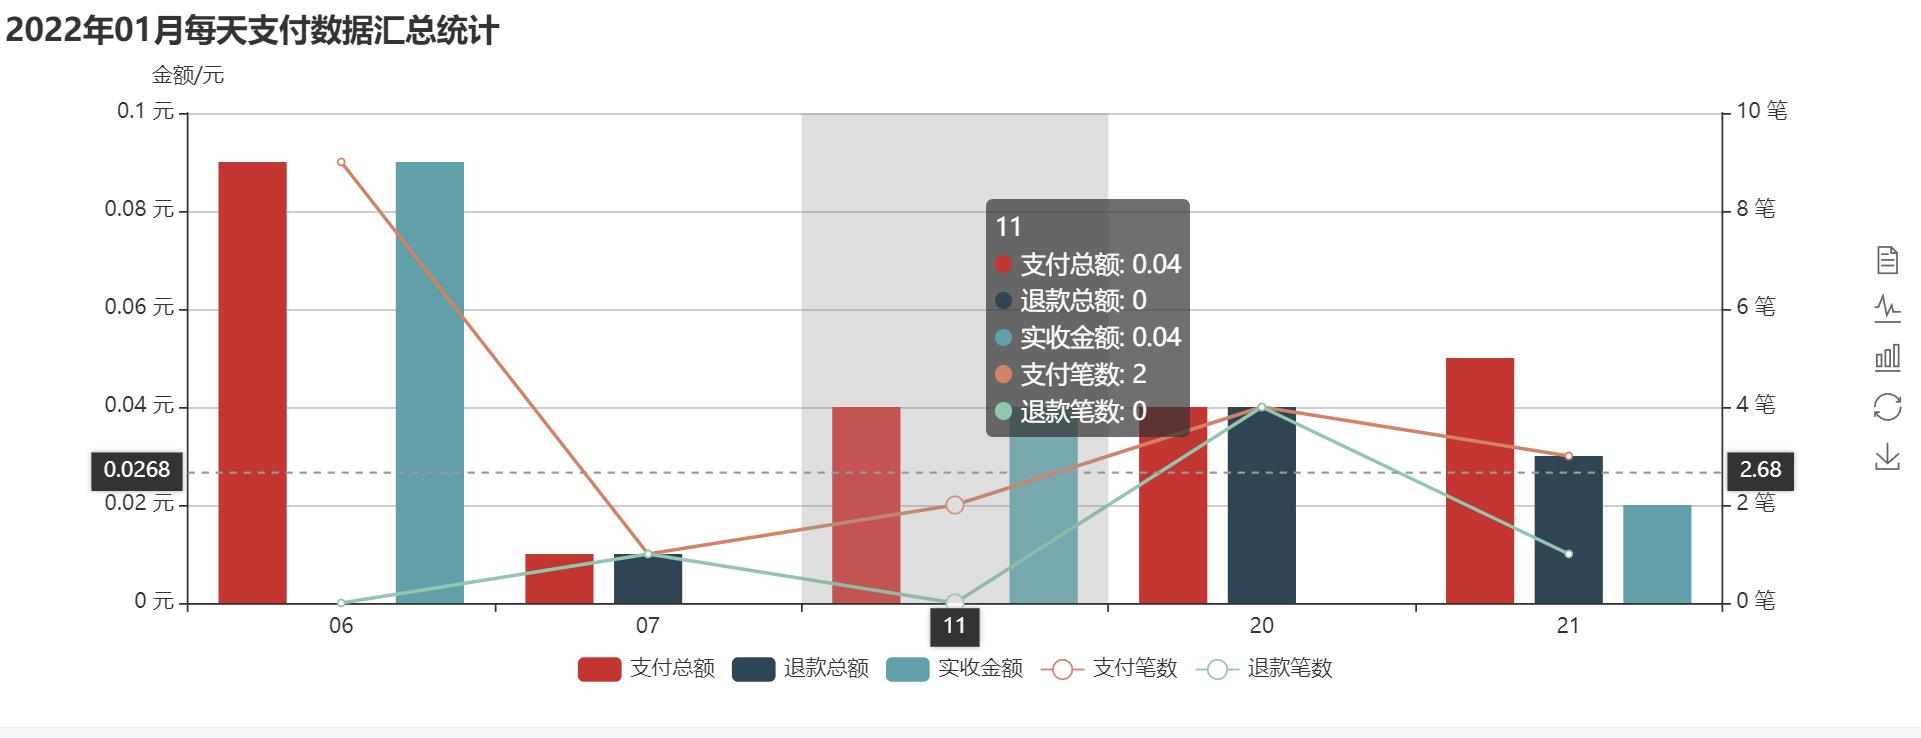
1.说明
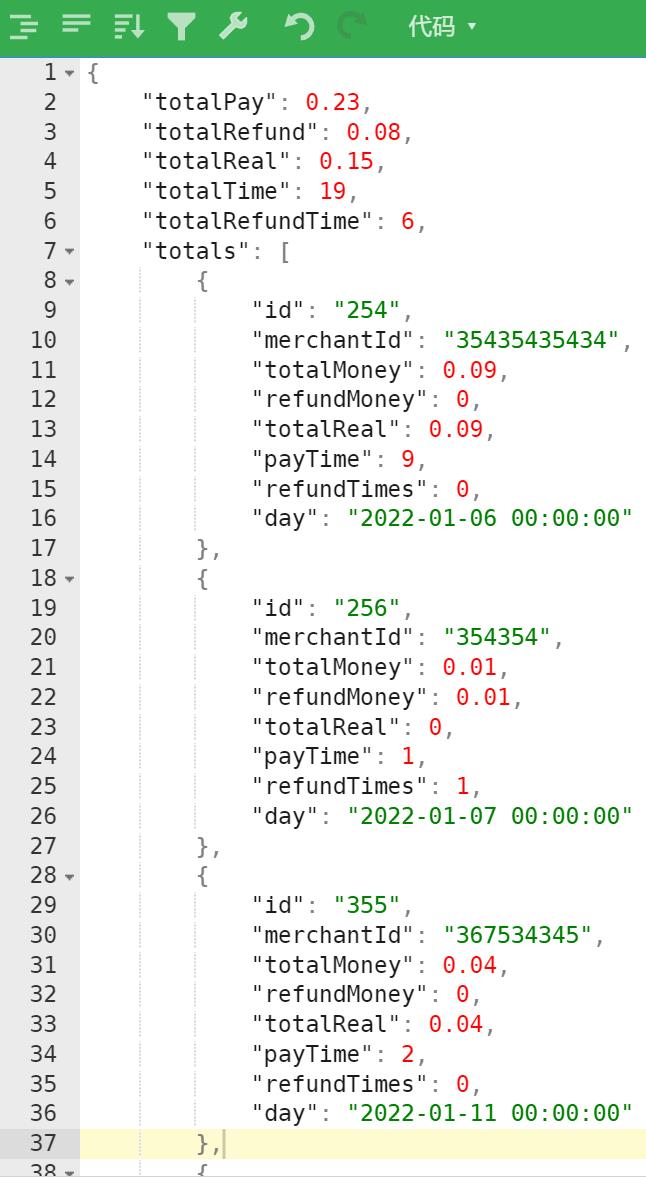
- 只提供子组件代码,totalData 是从父组件传输过来的数据,其数据格式如下:
父组件的代码就不提供了
2.代码
main.js 引入echarts
import * as echarts from 'echarts'// 在import的后面,echarts的前面加一个 * as
Vue.prototype.$echarts = echarts
vue子组件代码:
-
<div id="totalCharts" style="width: 100%;height:300px;"></div>
<div id="timesCharts" style="width: 100%;height:300px;">123</div>

<div id="totalDataCharts" style="width: 100%;height:400px;" />
-
js代码
<script>
	export default
	  name: 'totalPie',
	  props: ['totalData'],
	  data ()
	    return
	      totalPayOption:
	        title:
	          text: '总支付金额数据[单位:元]',
	          left: 'center',
	        ,
	        tooltip:
	          trigger: 'item',
	          formatter: 'a <br/>b: c (d%)',
	        ,
	        legend:
	          orient: 'vertical',
	          left: 10,
	          data: ['总支付金额', '总退款金额', '总实收金额'],
	        ,
	        series: [

	            name: '总支付金额',
	            type: 'pie',
	            radius: [0, '40%'],
	            label:
	              show: true,
	              position: 'inner',
	            ,
	            labelLine:
	              show: false,
	            ,
	            data: [],
	            emphasis:
	              itemStyle:
	                shadowBlur: 10,
	                shadowOffsetX: 0,
	                shadowColor: 'rgba(0, 0, 0, 0.5)',
	              ,
	            ,
	          ,

	            name: '总支付金额',
	            type: 'pie',
	            radius: ['55%', '70%'],
	            label:
	              show: false,
	              position: 'inner',
	            ,
	            labelLine:
	              show: false,
	            ,
	            data: [],

	        ],
	      ,
	      totalTimesOption:
	        title:
	          text: '总支付笔数数据',
	          left: 'center',
	        ,
	        tooltip:
	          trigger: 'item',
	          formatter: 'a <br/>b: c (d%)',
	        ,
	        legend:
	          orient: 'vertical',
	          left: 10,
	          data: ['总支付笔数', '总退款笔数'],
	        ,
	        series: [

	            name: '支付笔数',
	            type: 'pie',
	            radius: '70%',
	            label:
	              position: 'inner',
	            ,
	            labelLine:
	              show: false,
	            ,
	            data: [],
	            emphasis:
	              itemStyle:
	                shadowBlur: 10,
	                shadowOffsetX: 0,
	                shadowColor: 'rgba(0, 0, 0, 0.5)',
	              ,
	            ,

	        ],
	      ,
	      totalOption:
	        tooltip:
	          trigger: 'axis',
	          axisPointer:
	            type: 'cross',
	            crossStyle:
	              color: '#999',
	            ,
	          ,
	        ,
	        title:
	          text: '每天支付数据汇总统计',
	        ,
	        legend:
	          bottom: 10,
	          data: ['支付总额', '退款总额', '实收金额', '支付笔数', '退款笔数'],
	        ,
	        toolbox:
	          show: true,
	          orient: 'vertical',
	          left: 'right',
	          top: 'center',
	          feature:
	            dataView:  show: true, readOnly: false, ,
	            magicType:  show: true, type: ['line', 'bar'], ,
	            restore:  show: true, ,
	            saveAsImage:  show: true, ,
	          ,
	        ,
	        xAxis: [

	            type: 'category',
	            data: [],
	            axisPointer:
	              type: 'shadow',
	            ,

	        ],
	        yAxis: [

	            type: 'value',
	            name: '金额/元',
	            axisLabel:
	              formatter: 'value 元',
	            ,
	          ,

	            type: 'value',
	            minInterval: 1,
	            axisLabel:
	              formatter: 'value 笔',
	            ,

	        ],
	        series: [

	            emphasis:
	              itemStyle:
	                shadowBlur: 10,
	                shadowOffsetX: 0,
	                shadowColor: 'rgba(0, 0, 0, 0.5)',
	              ,
	            ,

	        ],
	      ,

	  ,
	  /* 监听数据变化,实时渲染图表 */
	  watch:
	    /* totalData (newValue, oldValue)
	      this.setTotalCharts(newValue)
	    , */
	    totalData:
	      handler (newValue, oldValue)
	        this.setTotalCharts(newValue)
	      ,
	      immediate: true,
	    ,
	  ,
	  mounted ()
	    this.showTotalPayCharts()
	    this.showTotalTimesCharts()
	    this.showTotalCharts()
	  ,
	  methods:
	    showTotalPayCharts ()
	      // 基于准备好的dom,初始化echarts实例
	      const payCharts = this.$echarts.init(document.getElementById('totalCharts'))// 也可以通过$refs.newCharts的方式去获取到dom实例。

	      payCharts.setOption(this.totalPayOption,true)
	    ,
	    showTotalTimesCharts ()
	      const timesChart = this.$echarts.init(document.getElementById('timesCharts'))
	      timesChart.setOption(this.totalTimesOption,true)
	    ,
	    showTotalCharts ()
	      const totalDataCharts = this.$echarts.init(document.querySelector('#totalDataCharts'))
	      totalDataCharts.setOption(this.totalOption,true)
	    ,

	    /*
	      注意:echarts不会自动帮你渲染数据的,需要手动再次调用setOption函数
	        所以每次都要重新init(),然后再次调用setOption()
	    */
	    setTotalCharts (totalData)
	      /* 饼图数组 */
	      const innerPayData = []
	      const outterPayData = []
	      const timesData = []

	      /* 柱状图数据 */
	      const series = []
	      const x = []

	      if (totalData.totals.length > 0)
	        // region 给饼图和柱状图的option赋值
	        /* 总支付金额数据饼图 */
	        /* 将饼图数据赋值给数组 */
	        for (let i = 0; i < this.totalPayOption.legend.data.length; i++)
	          const pieInnerData =
	          const pieOutterData =

	          if (this.totalPayOption.legend.data[i] === '总支付金额')
	            pieInnerData.value = this.totalData.totalPay
	            pieInnerData.name = '总支付金额'

	          if (this.totalPayOption.legend.data[i] === '总退款金额')
	            pieOutterData.value = this.totalData.totalRefund
	            pieOutterData.name = '总退款金额'

	          if (this.totalPayOption.legend.data[i] === '总实收金额')
	            pieOutterData.value = this.totalData.totalReal
	            pieOutterData.name = '总实收金额'


	          innerPayData.push(pieInnerData)
	          outterPayData.push(pieOutterData)

	        /* 将饼图数据数组中的值赋值给饼图的data */
	        this.totalPayOption.series[0].data = innerPayData
	        this.totalPayOption.series[1].data = outterPayData

	        /* 总支付笔数数据饼图 */
	        /* 将饼图数据赋值给数组 */
	        for (let i = 0; i < this.totalTimesOption.legend.data.length; i++)
	          const pieData =
	          if (this.totalTimesOption.legend.data[i] === '总支付笔数')
	            pieData.value = this.totalData.totalTime
	            pieData.name = '总支付笔数'

	          if (this.totalTimesOption.legend.data[i] === '总退款笔数')
	            pieData.value = this.totalData.totalRefundTime
	            pieData.name = '总退款笔数'

	          timesData.push(pieData)

	        this.totalTimesOption.series[0].data = timesData

	        /* 给柱状图赋值 */
	        for (let i = 0; i < totalData.totals.length; i++)
	          x.push(totalData.totals[i].day.substring(totalData.totals[i].day.length - 11, totalData.totals[i].day.length - 9))

	        /* 将数组暂存于数组中 */
	        for (let i = 0; i < this.totalOption.legend.data.length; i++)
	          const serie =
	          if (this.totalOption.legend.data[i] === '支付笔数' || this.totalOption.legend.data[i] === '退款笔数')
	            serie.name = this.totalOption.legend.data[i]
	            serie.type = 'line'
	            serie.yAxisIndex = 1
	           else
	            serie.name = this.totalOption.legend.data[i]
	            serie.type = 'bar'

	          const data = []
	          for (let j = 0; j < totalData.totals.length; j++)
	            if (this.totalOption.legend.data[i] === '支付笔数')
	              data.push(totalData.totals[j].payTime)
	             else if (this.totalOption.legend.data[i] === '支付总额')
	              data.push(totalData.totals[j].totalMoney)
	             else if (this.totalOption.legend.data[i] === '退款总额')
	              data.push(totalData.totals[j].refundMoney)
	             else if (this.totalOption.legend.data[i] === '实收金额')
	              data.push(totalData.totals[j].totalReal)
	             else if (this.totalOption.legend.data[i] === '退款笔数')
	              data.push(totalData.totals[j].refundTimes)


	          serie.data = data
	          series.push(serie)

	        this.totalOption.title.text = `$totalData.totals[0].day.substr(0, 4)年$totalData.totals[0].day.substr(5, 2)月每天支付数据汇总统计`
	        this.totalOption.series = series
	        this.totalOption.xAxis[0].data = x
	        // endregion

	        // region 数据渲染
	        this.showTotalPayCharts()
	        this.showTotalTimesCharts()
	        this.showTotalCharts()
	        // endregion
	       else
	        // region 数据置空
	        /* 传输的数据为空的时候一定要置空,以清除内存中的数据 */
	        this.totalPayOption.series[0].data = [...[]]
	        this.totalPayOption.series[1].data = [...以上是关于vue2+echarts:使用后台传输的json数据去动态渲染echarts图表的主要内容,如果未能解决你的问题,请参考以下文章