基于出行住宿评论数据的情感分析研究(民宿篇,含python代码)
Posted 99.99%
tags:
篇首语:本文由小常识网(cha138.com)小编为大家整理,主要介绍了基于出行住宿评论数据的情感分析研究(民宿篇,含python代码)相关的知识,希望对你有一定的参考价值。
本次用到的是爱彼迎民宿评论数据:
链接:https://pan.baidu.com/s/1fIhjn1DrPV8wxqnJ0DdumA
提取码:lpy3
停用词汇总:
链接:https://pan.baidu.com/s/1mEyql8pqz8XeVU_xBYkKfQ
提取码:02eb
情感分析用词:
链接:https://pan.baidu.com/s/1TKR8xBFMhUH7AZPePqBGJQ
提取码:7wwz
文章目录
研究背景
随着国内互联网产业的发展,社会中涌现出携程、爱彼迎等一批基于互联网的出行服务平台,人们在生活中也习惯于使用这些平台作为出行指导,而出行最重要的版块之一就是住宿。特别是在中途长途行程中,住宿是人们必须考虑的一项。
近年来我国大力发展服务业,住宿版块作为服务业的支柱之一,其行业的发展关系到整个服务业链条的发展,住宿版块当前主要有两种形式,一是传统的酒店行业,另一种是近些年新兴的短期民宿行业,民宿相比于酒店往往性价比更高,拥有更大和更多功能的空间,而酒店的服务和饮食往往优于民宿,两者各有利弊。2022年5月24日,民宿的龙头平台爱彼迎宣布将在2022年7月30日起暂停在中国大陆的服务,外界普遍猜测爱彼迎暂停服务是由于疫情管控导致民宿市场冷清。疫情给住宿服务业带来的冲击是有目共睹的,疫情对民宿与酒店行业都造成了影响,但是爱彼迎作为民宿平台选择退出大陆市场,而携程和美团等平台上的酒店预订业务仍旧平稳运营,这背后除了有疫情因素作为催化剂,是否还存在着其他因素的影响。
研究意义
本文通过对民宿与酒店的相关用户评论数据进行情感分析,获取民宿与酒店带给用户体验的异同点,从而更好地分析出民宿与酒店各自的优势和劣势所在,找出在疫情背景下,影响酒店与民宿平台发展的因素,从而找到近年来住宿行业发展的问题与矛盾的所在。
一、数据集介绍
链接:https://pan.baidu.com/s/1fIhjn1DrPV8wxqnJ0DdumA
提取码:lpy3
数据集来源于和鲸社区的爱彼迎评论数据集,数据集中包含爱彼迎用户的评论数据,根据民宿所在地分为北京、上海、重庆、成都、广州、杭州、南京、苏州、西安共9个地区,每个地区的评论数据以txt文本的格式存储。


二、数据预处理
1.引入库
import os
import jieba
import re
from collections import Counter
import pandas as pd
import numpy as np
from gensim.models import word2vec
import gensim
import logging
import os
import pyLDAvis
import pyLDAvis.sklearn
from sklearn.feature_extraction.text import CountVectorizer
from sklearn.decomposition import LatentDirichletAllocation
from pyecharts.charts import Bar
from wordcloud import WordCloud
import matplotlib.pyplot as plt
import warnings
warnings.filterwarnings("ignore")
2. 合并生成总数据
为了对总体数据进行分析,我将9个地区的txt合并为总数据.txt文件:
allfile=[ '北京.txt','上海.txt', '重庆.txt','广州.txt', '杭州.txt', '南京.txt', '西安.txt', '成都.txt',  '苏州.txt']
def hecheng(file_name,File_name='总数据.txt'):
    with open(file_name,encoding='utf-8',mode='r',errors='ignore') as f1,open(File_name,encoding='utf-8',mode='a+',errors='ignore') as F:
        for line in f1:
            F.seek(0,2)
            F.write(line)


for i in allfile:
    if str(i).endswith('.txt'):
        hecheng('./爱彼迎民宿/'+i)
导入总数据并且转化为dataframe:
import pandas as pd
from wordcloud import WordCloud
import jieba
import matplotlib.pyplot as plt
import PIL
import numpy as np
path = '总数据.txt'
f = open(path,"r",encoding='utf-8')

data=[]
for line in f.readlines():
            line=line.strip().split("\\t")
            data.append(line)

f.close()

minsu=pd.DataFrame(data).dropna(axis=0)
minsu.columns=['comment']
3. 剔除无价值数据
共剔除以下几类数据:
1)英文数据,由于北京、上海、重庆等城市都是国际化都市,所以数据集中包含了部分英文数据,我在预处理时首先就将数据中的英文评论和评论文本中的空白行去除,具体方法就是将空白行标记为缺失值,再将包含英文字母的评论换为缺失值,然后进行再删去文本中所有缺失值。
2)重复词,例如:爱彼迎、民宿、北京、上海、重庆、广州、杭州、南京、成都、苏州、西安,这些词虽然频繁出现,但对于分析评论特点没有帮助,数字也是如此。
3)短评论,例如:挺不错、真的好、特别喜欢,这种只有一个或是几个字的评论,这种没有实际意义的文本数据对于数据分析没有任何帮助,所以我对少于5个字的短文本进行了清除。
import re
# 去除数字、爱彼迎等词语
strinfo = re.compile('[0-9]|爱彼迎|民宿|北京|上海|重庆|广州|杭州|南京|成都|苏州|西安')
minsu['comment'] =  minsu['comment'].apply(lambda x: strinfo.sub('',x))

#第一步 将空字符的行替换为nan,方便进行删除
minsu.replace(to_replace=r'^\\s*$', value=np.nan, regex=True, inplace=True)
minsu.replace(to_replace=r'[a-zA-Z]', value=np.nan, regex=True, inplace=True)

#第二步 删除所有值为nan的行
minsu.dropna(axis=0, how='any', inplace=True)

#去除短评论
minsu = minsu[minsu['comment'].apply(len)>=4]
三、爱彼迎民宿数据的数据分析
1. 爱彼迎数据分析具体步骤
首先使用SnowNLP进行初步分析,为数据添加level列,即好评或差评,之后使用LinerSVC模型进行好差评的预测,然后为了进一步准确提取正负向评论中的关键词并进行主题分类,我使用基于词典匹配的情感倾向分析模型对评论数据的情感进一步准确化并提取其中的关键词,最终进行LDA主题分类分别对积极评论以及消极评论进行主题划分。
1.1 分词并用SnowNLP进行初步分析
通过SnowNLP给每条评论一个情感评分,虽然不完全准确,但可以作为参考。
停用词汇总文件:
链接:https://pan.baidu.com/s/1mEyql8pqz8XeVU_xBYkKfQ
提取码:02eb
添加一列emotion列,存储情感评分 :
from snownlp import SnowNLP
minsu['emotion'] = minsu['comment'].apply(lambda x:SnowNLP(x).sentiments)

from wordcloud import WordCloud
import jieba
import matplotlib.pyplot as plt
import PIL

text = ''
for s in minsu['comment']:
    text += s
data_cut = ' '.join(jieba.lcut(text))


path = '停用词汇总.txt'
f = open(path,"r",encoding='utf-8').read()


word_cloud = WordCloud(font_path="simsun.ttc",
                       background_color="white",
                       stopwords=f
                       )


word_cloud.generate(data_cut)
plt.subplots(figsize=(15,8))
plt.imshow(word_cloud)
plt.axis("off")
plt.show()
添加评论情绪列(好评or差评):
def pingjia(emotion):
    if emotion >= 0.4:
        return '好评'

    else:
        return '差评'

minsu['level'] = minsu['emotion'].map(lambda x: pingjia(x))
minsu
1.2 词性标注
为了方便模型筛选有实际意义的评论,我将评论数据进行分词操作,主要是为了方便情感倾向分析模型关于含有名词评论的筛选,我还在分词的同时,给每个词加上了词性,例如:n名词、v动词、x标点符号等。此处以爱彼迎北京地区的评论数据作为例子,展示分词结果:

有时因为设备性能和jupiternotebook软件限制,数据量大时运行会极为缓慢,将数据拆成9份来运行会更快,如果代码跑不动就拆分成几份然后合并。
seg_word = minsu['comment'].apply(fenci)

n_word = seg_word.apply(lambda x: len(x))
n_content = [[x+1]*y for x,y in zip(list(seg_word.index), list(n_word))]
index_content = sum(n_content, [])
seg_word = sum(seg_word, [])
word = [x[0] for x in seg_word]
cixing = [x[1] for x in seg_word]
level = [[x]*y for x,y in zip(list(minsu1['level']), list(n_word))]
level = sum(level, [])
result = pd.DataFrame( "index_content":index_content,"word":word,
                       "cixing":cixing,
                       "level":level)

result = result[result['cixing'] != 'x']
#删除停用词
path = '停用词汇总.txt'
f = open(path,"r",encoding='utf-8')
stop = f.readlines()
stop = [x.replace('\\n', '') for x in stop]
word = list(set(word) - set(stop))
result = result[result['word'].isin(word)]
词性标注并且去除停用词之后的数据长这样:

给数据标个号,方便之后的情感分析预测。
四、情感数据分析和预测
1. LinearSVC模型预测情感
因为我在实验中深感标注情感信息的不易,所以我想用一个模型实现对评论数据情感的精准预测。这里我使用的是分类问题中比较常用的线性支持向量分类模型,将总数据集随机划分为训练集和验证集,训练集占70%的数据量,验证集占30%的数据量,其中train_X是经过TF_IDF算法向量化之后的特征词矩阵。
在实验中我使用的是默认参数的LinearSVC模型,利用模型的fit函数来对数据集做训练,最终打印模型在验证集数据上的准确率。模型最初的准确率为0.8752187189076063,但是此时数据集中评论标签是不平衡数据,即负向评论少,正向评论多,所以我接下来采用向下采样的方法,正负向评论各采集12842条,然后再用模型进行训练,发现准确率降低为0.7200882429275889,虽然准确率降低了,但我认为这才是模型真正的准确率,显然这个模型还有继续优化的空间,我后续也会继续进行研究。
第一步:切分训练集测试集;
import copy
minsu666=copy.deepcopy(minsu)
minsu['level'] = minsu['level'].map(lambda x:1.0 if x == '好评' else 0.0)

from sklearn.feature_extraction.text import TfidfVectorizer as TFIDF  # 原始文本转化为tf-idf的特征矩阵
from sklearn.svm import LinearSVC
from sklearn.calibration import CalibratedClassifierCV
from sklearn.model_selection import train_test_split

train_X,valid_X,train_y,valid_y = train_test_split(minsu['comment'],minsu['level'],test_size=0.3,random_state=24)

model_tfidf = TFIDF(min_df=5, max_features=5000, ngram_range=(1,3), use_idf=1, smooth_idf=1)
model_tfidf.fit(train_X)
train_vec = model_tfidf.transform(train_X)
第二步:训练模型;
model_tfidf = TFIDF(min_df=5, max_features=5000, ngram_range=(1,3), use_idf=1, smooth_idf=1)
model_tfidf.fit(train_X)
train_vec = model_tfidf.transform(train_X)
第三步:验证并统计结果;
# 把文档转换成矩阵
valid_vec = model_tfidf.transform(valid_X)
# 验证
pre_valid = clf.predict_proba(valid_vec)
pre_valid = clf.predict(valid_vec)
print('正例:',sum(pre_valid == 1))
print('负例:',sum(pre_valid == 0)) 
看一下准确率:
from sklearn.metrics import accuracy_score

score = accuracy_score(pre_valid,valid_y)
print("准确率:",score) 
优化处理 向下采样
由于负向情感的评价太少了,所以我进行了下采样,希望能看到更加真实的预测结果:
def under_sampling(data, target_col, balance_rate, random_state):
    if target_col == 1:
        target_col = "level"
    major, minor = data[target_col].value_counts(sort=True,
                                                 ascending=False).index
    line_no = pd.Series(data[target_col].values,
                        index=range(data.shape[0]))
    minor_ln = line_no[line_no.eq(minor)].index
    major_ln = line_no[line_no.eq(major)]
    major_ln = major_ln.sample(n=int(minor_ln.size * balance_rate),
                               random_state=random_state).index
    bingo_ln = minor_ln.append(major_ln)
    return data.iloc[bingo_ln, :]
data_u_s = under_sampling(minsu, target_col=1,
                            balance_rate=1, random_state=1)
print("自定义函数结果\\n%s" % data_u_s["level"].value_counts()) 
from sklearn.feature_extraction.text import TfidfVectorizer as TFIDF  # 原始文本转化为tf-idf的特征矩阵
from sklearn.svm import LinearSVC
from sklearn.calibration import CalibratedClassifierCV
from sklearn.model_selection import train_test_split

# 训练集验证集划分
train_X,valid_X,train_y,valid_y = train_test_split(data_u_s['comment'],data_u_s['level'],test_size=0.3,random_state=24)

model_tfidf = TFIDF(min_df=2, max_features=5000, ngram_range=(1,5), use_idf=1, smooth_idf=1)
model_tfidf.fit(train_X)
train_vec = model_tfidf.transform(train_X)

# 模型训练
model_SVC = LinearSVC()
clf = CalibratedClassifierCV(model_SVC)
clf.fit(train_vec,train_y)
# 把文档转换成矩阵
valid_vec = model_tfidf.transform(valid_X)
# 验证
pre_valid = clf.predict_proba(valid_vec)
pre_valid = clf.predict(valid_vec)
print('正例:',sum(pre_valid == 1))
print('负例:',sum(pre_valid == 0))

from sklearn.metrics import accuracy_score

score = accuracy_score(pre_valid,valid_y)
print("准确率:",score) 
2. 自定义情感倾向分析模型
情感分析词汇(正负面评价词语、正负面情绪词、否定词):
链接:https://pan.baidu.com/s/1TKR8xBFMhUH7AZPePqBGJQ
提取码:7wwz
word = pd.read_csv("./word_zong.csv")
path="./情感分析用词/情感极性词典"

pos_comment = pd.read_csv(path+"/正面评价词语.txt", header=None,sep="/n", encoding = 'utf-8', engine='python')
neg_comment = pd.read_csv(path+"/负面评价词语.txt", header=None,sep="/n", encoding = 'utf-8', engine='python')
pos_emotion = pd.read_csv(path+"/正面情绪词.txt", header=None,sep="/n", encoding = 'utf-8', engine='python')
neg_emotion = pd.read_csv(path+"/负面情绪词.txt", header=None,sep="/n", encoding = 'utf-8', engine='python')


positive = set(pos_comment.iloc[:,0])|set(pos_emotion.iloc[:,0])
negative = set(neg_comment.iloc[:,0])|set(neg_emotion.iloc[:,0])


intersection = positive&negative

positive = list(positive - intersection)
negative = list(negative - intersection)

positive = pd.DataFrame("word":positive,"weight":[1]*len(positive))
negative = pd.DataFrame("word":negative,"weight":[-1]*len(negative))

posneg = positive.append(negative)


data_posneg = posneg.merge(word, left_on = 'word', right_on = 'word',
                           how = 'right')
data_posneg = data_posneg.sort_values(by = ['index_content','word'])

data_posneg.tail(10)
notdict = pd.read_csv(path+"/否定词.txt")
# 构造新列,作为经过否定词修正后的情感值
data_posneg['amend_weight'] = data_posneg['weight']
data_posneg['id'] = np.arange(0, len(data_posneg))
# 只保留有情感值的词语
only_inclination = data_posneg.dropna().reset_index(drop=True)
index = only_inclination['id']
for i in np.arange(0, len(only_inclination)):
# 提取第i个情感词所在的评论
review = data_posneg[data_posneg['index_content'] == only_inclination['index_content'][i]]
review.index = np.arange(0, len(review))
# 第i个情感值在该文档的位置
affective = only_inclination['index_word'][i]
if affective == 1:
ne = sum([i in notdict for i in review['word'][affective - 1]])%2
if ne == 1:
data_posneg['amend_weight'][index[i]] = -data_posneg['weight'][index[i]]
elif affective > 1:
ne = sum([i in notdict for i in review['word'][[affective - 1,
affective - 2]]])%2
if ne == 1:
data_posneg['amend_weight'][index[i]] = -data_posneg['weight'][index[i]]
# 更新只保留情感值的数据
only_inclination = only_inclination.dropna()
# 计算每条评论的情感值
value = only_inclination.groupby(['index_content'],
as_index=False)['amend_weight'].sum()
# 去除情感值为0的评论
value = value[value['amend_weight'] != 0]value['amend_level'] = ''
value['amend_level'][value['amend_weight'] > 0] = '好'
value['amend_level'][value['amend_weight'] < 0] = '差'
result = value.merge(word,left_on = 'index_content',
right_on = 'index_content',
how = 'left')
# 提取正向和负向评论信息
ind_pos = list(value[value['amend_level'] == '好']['index_content'])
ind_neg = list(value[value['amend_level'] == '差']['index_content'])
posdata = word[[i in ind_pos for i in word['index_content']]]
negdata = word[[i in ind_neg for i in word['index_content']]]爱彼迎民宿正向评论词云图:
import matplotlib.pyplot as plt
from wordcloud import WordCloud


# 正向评论词云图
freq_pos = posdata.groupby('word')['word'].count()
freq_pos = freq_pos.sort_values(ascending = False)
wordcloud = WordCloud(font_path="simsun.ttc",
                      max_words=100,
                      background_color='white')
pos_wordcloud = wordcloud.fit_words(freq_pos)

plt.subplots(figsize=(12,8))
plt.imshow(pos_wordcloud)
plt.axis('off')
plt.show()
爱彼迎民宿负向评论词云图:
# 负向评论词云图
freq_neg = negdata.groupby(by = ['word'])['word'].count()
freq_neg = freq_neg.sort_values(ascending = False)
neg_wordcloud = wordcloud.fit_words(freq_neg)

plt.subplots(figsize=(12,8))
plt.imshow(neg_wordcloud)
plt.axis('off')
plt.show()
获取正向、负向评论关键词并保存:
freq_pos.head(20)
freq_neg.head(20)
posdata.to_csv("./posdata.csv", index = False, encoding = 'utf-8')
negdata.to_csv("./negdata.csv", index = False, encoding = 'utf-8')
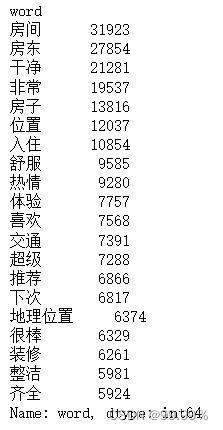
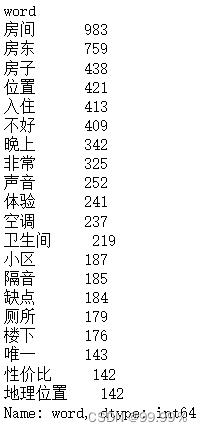
爱彼迎民宿正向评论关键词 爱彼迎民宿负向评论关键词
3. 使用LDA主题分类模型进行数据分析
为了更好地分析影响积极评论和消极评论的因素,我将正向评论中的词语和负向评论中的词语提取为posdata和negdata,然后分别利用TF-IDF算法将词汇向量化,然后赋给字词各自的权重,使用LDA主题分类模型分别对正向评论中的词汇和负向评论中的词汇进行主题分析。
在进行了多次参数调优之后,我发现正向评论中LDA设为3个主题的效果较好,负向评论中LDA设为4个主题的效果较好,得到结果如下:
path = '停用词汇总.txt'
f = open(path,"r",encoding='utf-8').read()  #设置文件对象
stopwords=list(f)

#计算TF-IDF值
from sklearn.feature_extraction.text import TfidfVectorizer, CountVectorizer

n_features = 2000

tf_vectorizer = TfidfVectorizer(strip_accents = 'unicode',
                                max_features=n_features,
                                stop_words=stopwords,
                                max_df = 0.99,
                                min_df = 0.002) #去除文档内出现几率过大或过小的词汇
tf = tf_vectorizer.fit_transform(posdata['word'])

print(tf.shape)
print(tf)

#LDA主题分类
from sklearn.decomposition import LatentDirichletAllocation

#设置主题数
n_topics = 3

lda = LatentDirichletAllocation(n_components=n_topics,
                                max_iter=100,
                                learning_method='online',
                                learning_offset=50,
                                random_state=0)
lda.fit(tf)

#显示主题数
print(lda.components_)
#几个主题就是几行 多少个关键词就是几列
print(lda.components_.shape)

def print_top_words(model, tf_feature_names, n_top_words):
    for topic_idx,topic in enumerate(model.components_):
        print('Topic #%d:' % topic_idx)
        print(' '.join([tf_feature_names[i] for i in topic.argsort()[:-n_top_words-1:-1]]))
        print("")

#每个主题输出前20个关键词
n_top_words = 20
tf_feature_names = tf_vectorizer.get_feature_names()

print_top_words(lda, tf_feature_names, n_top_words)

import pyLDAvis
import pyLDAvis.gensim_models
red_vis_data = pyLDAvis.sklearn.prepare(lda,tf,tf_vectorizer)
pyLDAvis.display(red_vis_data)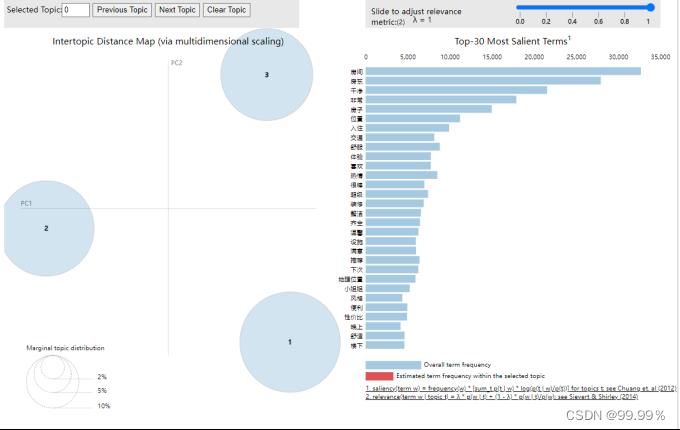
正向积极评论LDA分类可视化结果
#计算TF-IDF值
from sklearn.feature_extraction.text import TfidfVectorizer, CountVectorizer

n_features = 2000


tf_vectorizer = TfidfVectorizer(strip_accents = 'unicode',
                                max_features=n_features,
                                stop_words=stopwords,
                                max_df = 0.99,
                                min_df = 0.002) #去除文档内出现几率过大或过小的词汇
tf = tf_vectorizer.fit_transform(negdata['word'])

#LDA主题分类
from sklearn.decomposition import LatentDirichletAllocation

#设置主题数
n_topics = 4

#Python 2.X: n_topics=n_topics
lda = LatentDirichletAllocation(n_components=n_topics,
                                max_iter=100,
                                learning_method='online',
                                learning_offset=50,
                                random_state=0)
lda.fit(tf)

#显示主题数
print(lda.components_)

print(lda.components_.shape)


def print_top_words(model, tf_feature_names, n_top_words):
    for topic_idx,topic in enumerate(model.components_):
        print('Topic #%d:' % topic_idx)
        print(' '.join([tf_feature_names[i] for i in topic.argsort()[:-n_top_words-1:-1]]))
        print("")

#每个主题输出前20个关键词
n_top_words = 20
tf_feature_names = tf_vectorizer.get_feature_names()

print_top_words(lda, tf_feature_names, n_top_words)

import pyLDAvis
import pyLDAvis.gensim_models
red_vis_data = pyLDAvis.sklearn.prepare(lda,tf,tf_vectorizer)
pyLDAvis.display(red_vis_data)
负向积极评论LDA分类可视化结果
4. 各城市评论数据比较
使用SnowNLP对9个地区的民宿评论分别打分,算出9个地区的平均分为:

爱彼迎民宿各地区情感均分
可以看到数据集中大部分的评论都是积极评论,各个地区的评论均分基本在0.8左右,其中成都的均分最高,为0.834,而广州的均分最低,为0.7864,我猜想这与城市的人文环境、城市设施以及用户的出行目的有关,成都、北京、重庆、南京、西安和杭州都有大量且著名的旅游景点,以旅行为出行目的的用户往往自身心情就会很好,所以更容易给出好评,而上海和广州作为现代化都市,以出差办公或是紧急事宜为出行目的的用户会相对较多,而在工作中的用户往往压力会更大,也就更容易给出差评,以上是我基于SnowNLP结果的初步推测,虽然各地区之间的均分相差并不大,但是由于数据量较大,所以这种0.05级别的均分差异也不能忽视。
为了进一步验证推论,防止是由于部分评论评分过低或过高造成差异,我将SnowNLP评分高于0.4的评论算为好评,将分数低于0.4的评论算为差评,观察每个地区的消极评论占比。
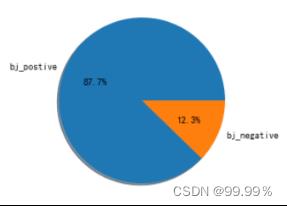

北京地区正向与负向评论数据占比情况 上海地区正向与负向评论数据占比情况
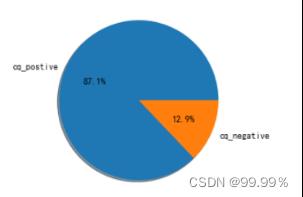

重庆地区正向与负向评论数据占比情况 广州地区正向与负向评论数据占比情况


杭州地区正向与负向评论数据占比情况 南京地区正向与负向评论数据占比情况
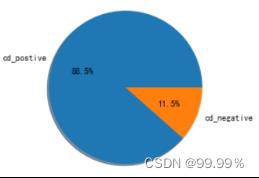

成都地区正向与负向评论数据占比情况 苏州地区正向与负向评论数据占比情况

西安地区正向与负向评论数据占比情况
通过这些饼图中的占比,我们可以看出,均分较低的省份消极评论确实会更多,所以评分中并不存在明显的分数极端化。
总结
通过爱彼迎民宿评论数据的分析结果可以看出,用户们喜欢民宿的原因主要有以下几点:
一、民宿地理位置好,交通便利或是位于景点周边,这主要是因为民宿基本位于居民区,周围往往会有地铁站、公交站等便民设施;
二、房间的装修风格和陈设符合用户审美,例如有的民宿包含投影仪,符合爱看电影的用户的爱好;
三、房间整洁干净,有温馨的氛围;四是房东热情贴心的服务。
而使民宿住户们留下差评的原因主要有以下几点:
一、民宿厕所不卫生或是房间有怪味;
二、民宿配套设施有不尽如人意的时候,比如洗澡没有热水、床单清洗不彻底等;
三、民宿具体位置不好找,对于带着大件行李的住户不友好;
四、民宿隔音效果差,小区环境不好,经常有噪音;
五、住户认为民宿性价比较低,不合心意。
以上是关于基于出行住宿评论数据的情感分析研究(民宿篇,含python代码)的主要内容,如果未能解决你的问题,请参考以下文章