LeaFlet学习之结合turf.js生成简单的等值线demo
Posted hpugisers
tags:
篇首语:本文由小常识网(cha138.com)小编为大家整理,主要介绍了LeaFlet学习之结合turf.js生成简单的等值线demo相关的知识,希望对你有一定的参考价值。
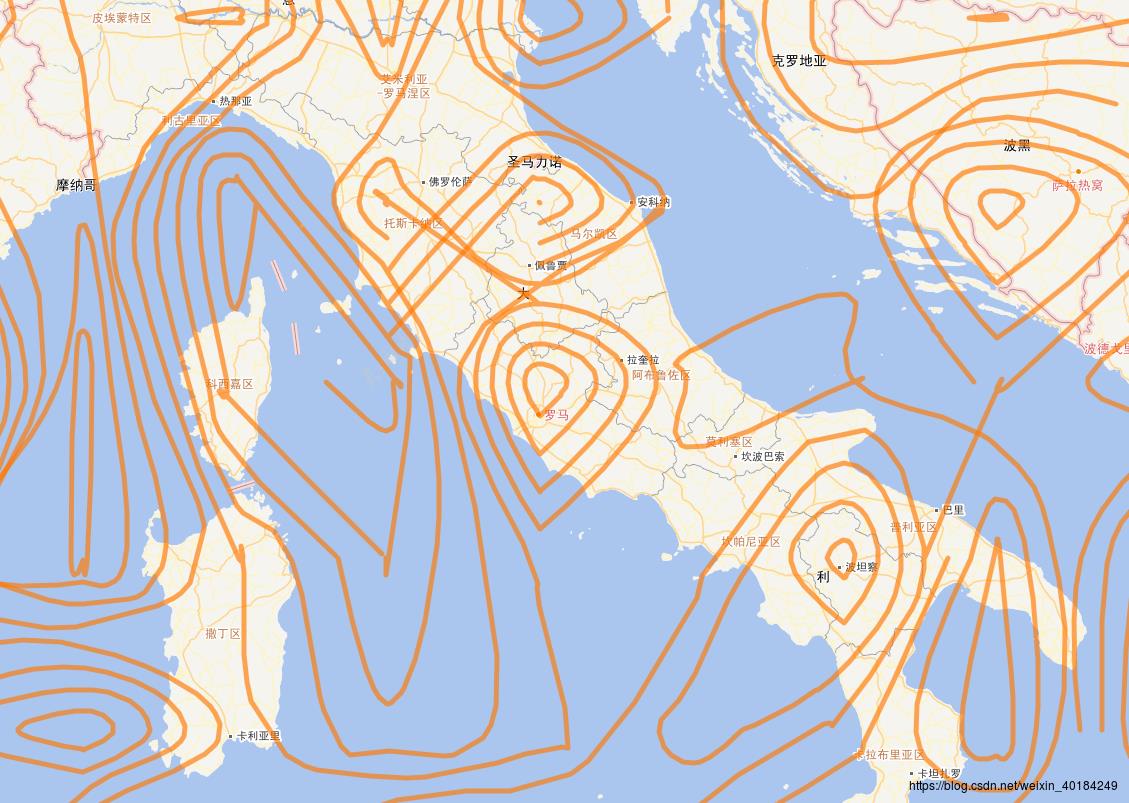
本文主要结合turf.js生成等值线俺,进行展示效
一、放张图:
二、全部源码
<!DOCTYPE html>
<html xmlns="http://www.w3.org/1999/xhtml">
<head>
    <meta http-equiv="Content-Type" content="text/html; charset=utf-8" />
    <title>等值线的生成</title>
    <link href="Script/leaflet/leaflet.css" rel="stylesheet" />
    <style>
        #map

            height: 2000px;
            width: 1500px;

    </style>
    <script src="Script/leaflet/leaflet.js"></script>
    <script src="Script/leaflet/leaflet.ChineseTmsProviders.js"></script>
    <script src='https://npmcdn.com/@turf/turf/turf.min.js'></script>
</head>
<body>
    <div id="map"></div>

</body>
    <script>
        var normalm = L.tileLayer.chinaProvider('TianDiTu.Normal.Map',
            maxZoom: 18,
            minZoom: 1
        ),
            normala = L.tileLayer.chinaProvider('TianDiTu.Normal.Annotion',
                maxZoom: 18,
                minZoom: 1
            ),
            imgm = L.tileLayer.chinaProvider('TianDiTu.Satellite.Map',
                maxZoom: 18,
                minZoom: 1
            ),
            imga = L.tileLayer.chinaProvider('TianDiTu.Satellite.Annotion',
                maxZoom: 18,
                minZoom: 1
            );

        var normal = L.layerGroup([normalm, normala]);
        image = L.layerGroup([imgm, imga]);

        var baseLayers =
            "地图": normal,
            "影像": image,


        var overlayLayers =
            "图": normal,
            "像": image,


        var map = L.map("map",
            center: [31.59, 120.29],
            zoom: 12,
            layers: [normal],
            zoomControl: false

        );
        // 创建等值线区域
        var extent = [0, 30, 20, 50];
        var cellWidth = 100;
        var pointGrid = turf.pointGrid(extent, cellWidth,  units: 'miles' );

        for (var i = 0; i < pointGrid.features.length; i++)
            pointGrid.features[i].properties.temperature = Math.random() * 10;

        console.log(pointGrid.features.length);
        //等值线的级数
        var breaks = [0, 1, 2, 3, 4, 5, 6, 7, 8, 9, 10];

        var lines = turf.isolines(pointGrid, breaks,  zProperty: 'temperature' );
        //设置颜色
        var myStyle =
            "color": "#ff7800",
            "weight": 5,
            "opacity": 0.65
        ;
        //进行平滑处理
            var _lFeatures = lines.features;
            for(var i=0;i<_lFeatures.length;i++)
                var _coords = _lFeatures[i].geometry.coordinates;
                var _lCoords = [];
                for(var j=0;j<_coords.length;j++)
                    var _coord = _coords[j];
                    var line = turf.lineString(_coord);
                    var curved = turf.bezierSpline(line);
                    _lCoords.push(curved.geometry.coordinates);

                _lFeatures[i].geometry.coordinates = _lCoords;

        //geojson数据读取
        L.geoJSON(lines,
            style: myStyle
        ).addTo(map);
    </script>
</html>
三、总结
这里是等值线,可不是等高线,等高线不会相交,等值线可能相交,数据平滑参考牛老师ol4的等值线效果。
以上是关于LeaFlet学习之结合turf.js生成简单的等值线demo的主要内容,如果未能解决你的问题,请参考以下文章