基于canvas和ol的点标注的避让实现
Posted 牛老师讲GIS
tags:
篇首语:本文由小常识网(cha138.com)小编为大家整理,主要介绍了基于canvas和ol的点标注的避让实现相关的知识,希望对你有一定的参考价值。
概述
在做地图的时候,点的标注展示是一个非常常见的功能,但是十几种点在某些区域比较密集是非常常见的,但是业务表达中却需要将之展示出来。基于此需求,本文结合canvas和ol做一简单的实现。
效果
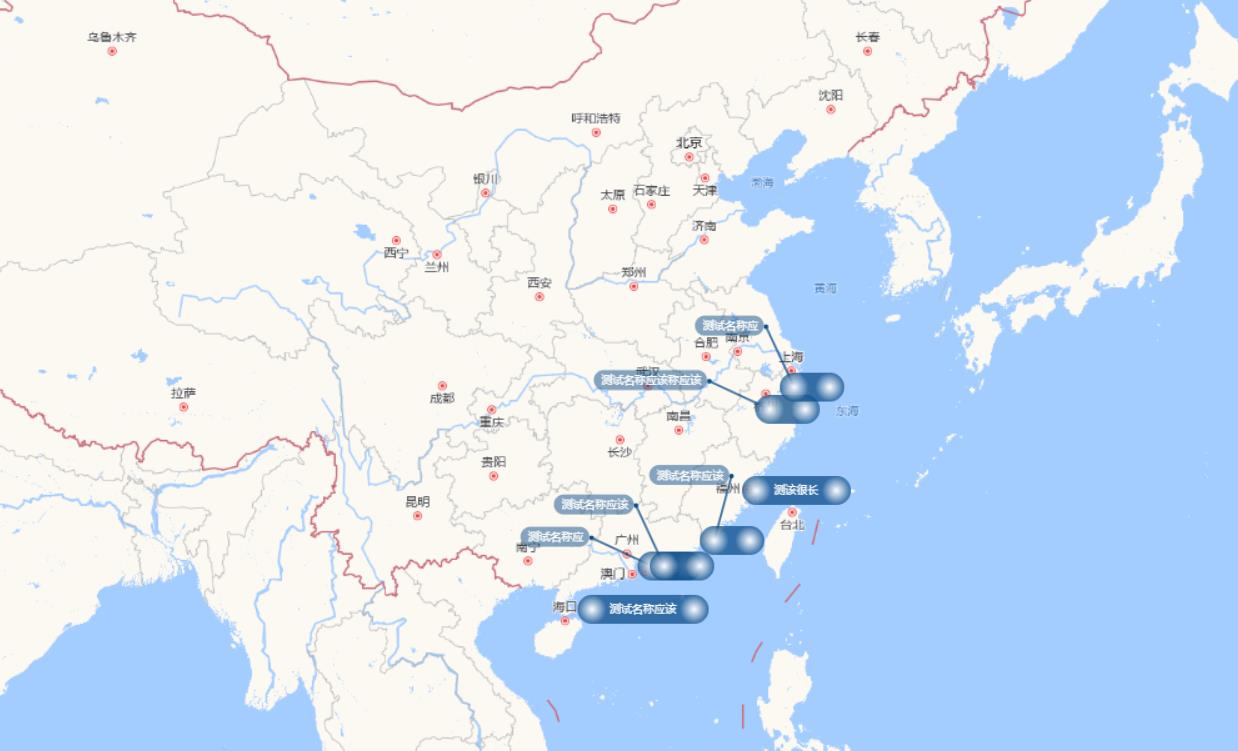
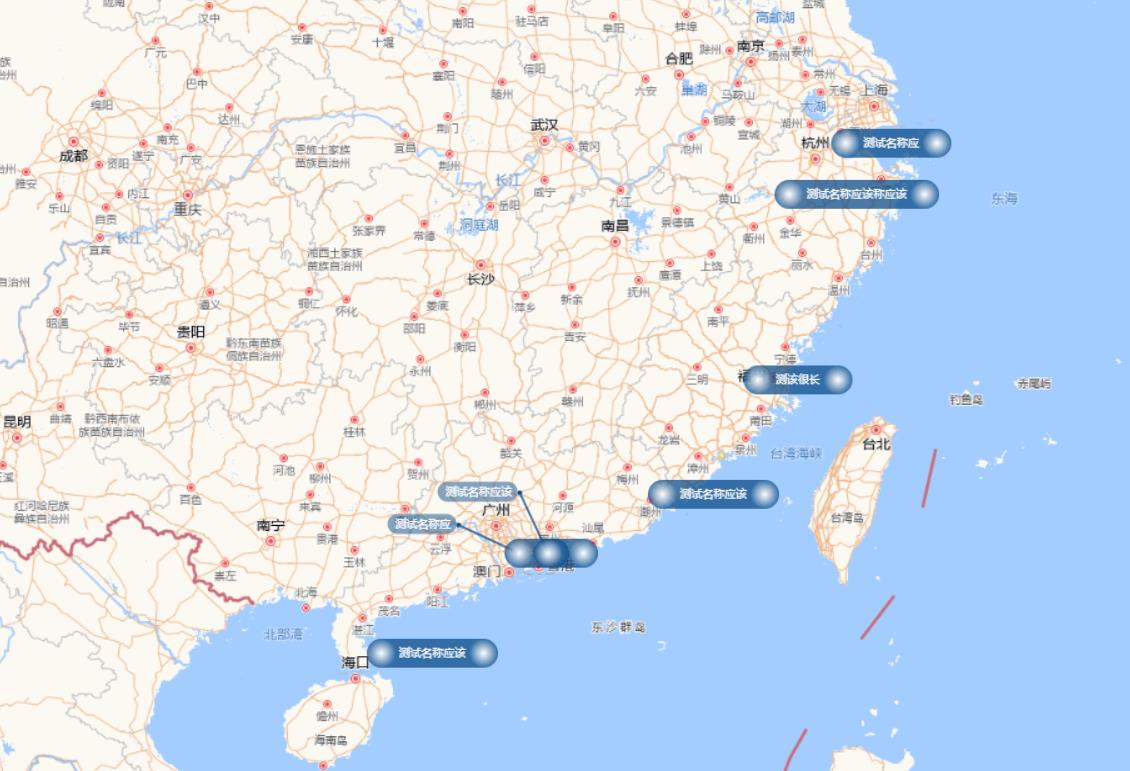
实现:
- 密集区点的标注通过牵引线的方式引出展示;
- 地图放大的时候更新展示;
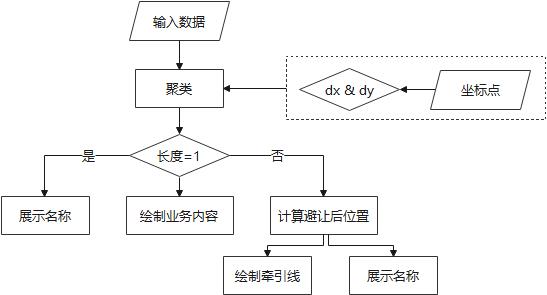
思路
实现代码
const points = [
   "properties": "name":"测试名称应该", "geometry":  "type": "Point", "coordinates": [ 110.15558, 19.91038 ]  ,
   "properties": "name":"测试名称应", "geometry":  "type": "Point", "coordinates": [ 113.52309, 22.21177 ]  ,
   "properties": "name":"测试名称应该", "geometry":  "type": "Point", "coordinates": [ 114.23454, 22.21177 ]  ,
   "properties": "name":"测该很长", "geometry":  "type": "Point", "coordinates": [ 119.35695, 26.06293 ]  ,
   "properties": "name":"测试名称应该称应该", "geometry":  "type": "Point", "coordinates": [ 120.11582, 30.07927 ]  ,
   "properties": "name":"测试名称应", "geometry":  "type": "Point", "coordinates": [ 121.49129, 31.14058 ]  ,
   "properties": "name":"测试名称应该", "geometry":  "type": "Point", "coordinates": [ 117.03289, 23.5228 ]
]
let canvasFunction = function (extent, resolution, pixelRatio, size, projection)
  const canvasWidth = size[0]
  const canvasHeight = size[1]
  const [w, h] = map.getSize()
  const xoff = canvasWidth - w,
    yoff = canvasHeight - h
  const canvas = document.createElement('canvas');
  canvas.width = canvasWidth
  canvas.height = canvasHeight
  const context = canvas.getContext('2d');
  // 数据聚类处理,根据上下和左右的距离进行判断
  function clusterData(data)
    let res =
    let clusterTest = function (pixel, tolrance = [200, 30])
      let r = pixel.join(',')
      const [x, y] = pixel
      for (let key in res)
        const [_x, _y] = key.split(',').map(Number)
        const dx = Math.abs(x - _x),
          dy = Math.abs(y - _y)
        if(dx < tolrance[0] && dy < tolrance[1])
          r = key
          break


      return r

    for (let i = 0; i < data.length; i++)
      const d = data[i]
      const coords = ol.proj.fromLonLat(d.geometry.coordinates)
      let pixel = map.getPixelFromCoordinate(coords)
      pixel = [pixel[0]  + xoff / 2, pixel[1] + yoff / 2].map(p => Math.round(p))
      d.pixel = pixel
      let key = pixel.join(',')
      const width = 26 * 2 + 6 + context.measureText(d.properties.name).width
      key = clusterTest(pixel, [width, 30])
      if(!res[key]) res[key] = []
      res[key].push(d)

    return res

  // 绘制两边为圆的矩形
  function drawRoundRect (ctx, x, y, width, height = 24, fillStyle = 'rgba(14,77,137,0.75)')
    const r = height / 2
    ctx.fillStyle = fillStyle
    ctx.beginPath()
    ctx.moveTo(x + r, y)
    ctx.lineTo(x + width - r, y)
    ctx.arc(x + width - r, y + r, r, Math.PI * 1.5, Math.PI * 0.5)
    ctx.lineTo(x + r, y + height)
    ctx.arc(x + r, y + height - r, r, Math.PI * 0.5, Math.PI * 1.5)
    ctx.closePath()
    ctx.fill()

  // 绘制feature
  function drawFeature (ctx, x = 10, y = 10, text, notCluster = true, index = 0)
    let height = 26, width = height * 2 + 6,  r = height / 2
    if(notCluster) width += ctx.measureText(text).width
    ctx.save()
    // 如果有聚类,则避让绘制文字,放在前面是为了让指引线在下面
    if(!notCluster && map.getView().getZoom() > 4)
      const radius = 60
      const ang  = (-index * 40 - 115) / 180 * Math.PI ;
      const cx = x + r, cy = y + height - r
      const px = cx + Math.sin(ang) * radius,
        py = cy + Math.cos(ang) * radius
      // 绘制牵引线
      ctx.beginPath()
      ctx.strokeStyle = 'rgba(14,77,137,0.75)'
      ctx.lineWidth = 2
      ctx.moveTo(cx, cy)
      ctx.lineTo(px, py)
      ctx.stroke()
      // 绘制牵引线终点小圆圈
      ctx.beginPath()
      ctx.fillStyle = 'rgba(14,77,137,1)'
      ctx.arc(px, py, 2, 0, Math.PI * 2)
      ctx.fill()
      // 绘制矩形
      const h = 18
      const w = ctx.measureText(text).width + 12
      drawRoundRect(ctx, px - w - 2, py - h / 2 - 1, w, h, 'rgba(14,77,137,0.5)')
      // 绘制文字
      ctx.fillStyle = 'rgb(255,255,255)'
      ctx.beginPath()
      ctx.textAlign = 'right'
      ctx.textBaseline = 'middle'
      ctx.fillText(text, px - 7, py)

    // 绘制矩形
    drawRoundRect(ctx, x, y, width, height)
    // 绘制左边的图标
    ctx.beginPath()
    const radialLeft = ctx.createRadialGradient(x + r, y + height - r, 0, x + r, y + height - r, r)
    radialLeft.addColorStop(0, '#fff')
    radialLeft.addColorStop(1, 'rgba(255,255,255,0)')
    ctx.fillStyle = radialLeft
    ctx.arc(x + r, y + height - r, r, 0, Math.PI * 2)
    ctx.fill()
    // 绘制右边的图标
    ctx.beginPath()
    const radialRight = ctx.createRadialGradient(x + width - r, y + r, 0, x + width - r, y + r, r)
    radialRight.addColorStop(0, '#fff')
    radialRight.addColorStop(1, 'rgba(255,255,255,0)')
    ctx.fillStyle = radialRight
    ctx.arc(x + width - r, y + r, r, 0, Math.PI * 2)
    ctx.fill()
    // 如果没有聚类,则绘制文字
    if(notCluster)
      ctx.fillStyle = '#fff'
      ctx.beginPath()
      ctx.textAlign = 'left'
      ctx.textBaseline = 'middle'
      ctx.fillText(text, x + height + 3, y + height - r)

    ctx.restore()

  const cluster = clusterData(points)
  for (let key in cluster)
    const data = cluster[key]
    const showText = data.length === 1
    data.forEach((d, index) =>
      const [x, y] = d.pixel
      drawFeature(context, x, y, d.properties.name, showText, index)
    )

  return canvas;

const layer = new ol.layer.Image(
  source: new ol.source.ImageCanvas(
    canvasFunction: canvasFunction
  )
);
map.addLayer(layer);
script>
以上是关于基于canvas和ol的点标注的避让实现的主要内容,如果未能解决你的问题,请参考以下文章