小技巧获取matlab中cdfplot函数的x轴,y轴的数值
Posted fpga和matlab
tags:
篇首语:本文由小常识网(cha138.com)小编为大家整理,主要介绍了小技巧获取matlab中cdfplot函数的x轴,y轴的数值相关的知识,希望对你有一定的参考价值。
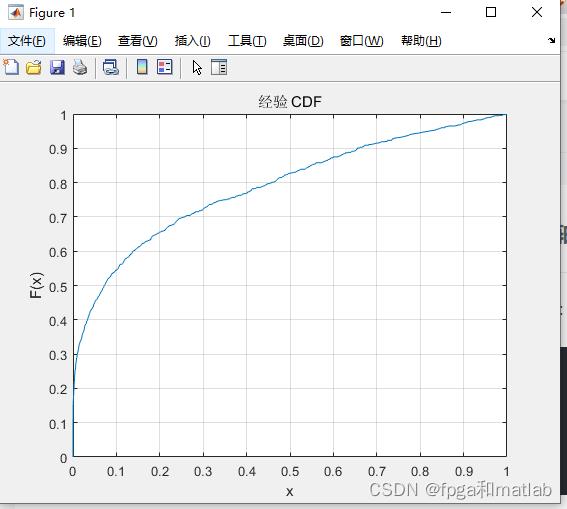
在matlab中可以通过cdfplot画出数据的累积分布函数曲线,如下程序:
clc;
clear;
close all;
warning off;
x = rand(1,1000).^4;
cdfplot(x)
运行结果如下:
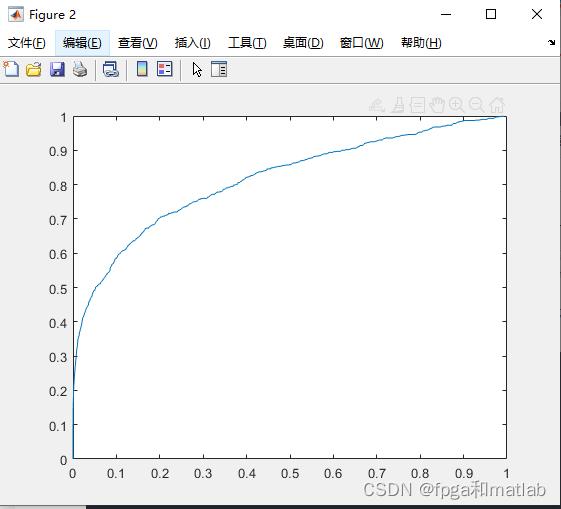
那么如何从cdfplot中获得对应的数值呢?非常简单,我们将上述程序做如下的调整。
clc;
clear;
close all;
warning off;
x = rand(1,1000).^4;
[xx]=cdfplot(x);

x1 = xx.XData;
y1 = xx.YData;

figure;
plot(x1,y1);
运行后,可以看到和直接cdfplot的输出结果一样,这说明x1和y1就是从cdfplot中提取的数据。
 高性能云服务器
 精品线路独享带宽,毫秒延迟,年中盛惠 1 折起
以上是关于小技巧获取matlab中cdfplot函数的x轴,y轴的数值的主要内容,如果未能解决你的问题,请参考以下文章